Jacksonville real estate market report June 2017
•
1 gostou•538 visualizações

Jacksonville real estate market report June 2017

Recomendados
Recomendados
Mais conteúdo relacionado
Mais procurados
Mais procurados (20)
Semelhante a Jacksonville real estate market report June 2017
Semelhante a Jacksonville real estate market report June 2017 (17)
Último
Último (20)
Jacksonville real estate market report June 2017
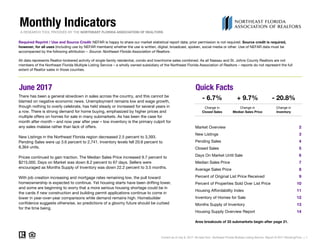
- 1. Monthly Indicators A RESEARCH TOOL PROVIDED BY THE NORTHEAST FLORIDA ASSOCIATION OF REALTORS June 2017 Quick Facts Market Overview 2 New Listings 3 Pending Sales 4 Closed Sales 5 Days On Market Until Sale 6 Median Sales Price 7 Average Sales Price 8 9 10 Housing Affordability Index 11 Inventory of Homes for Sale 12 Months Supply of Inventory 13 Housing Supply Overview Report 14 Current as of July 8, 2017. All data from Northeast Florida Multiple Listing Service. Report © 2017 ShowingTime. | 1 Required Reprint / Use and Source Credit: NEFAR is happy to share our market statistical report data; prior permission is not required. Source credit is required, however, for all uses (including use by NEFAR members) whether the use is written, digital, broadcast, spoken, social media or other. Use of NEFAR data must be accompanied by the following attribution – Source: Northeast Florida Association of Realtors . + 9.7% Change in Median Sales Price There has been a general slowdown in sales across the country, and this cannot be blamed on negative economic news. Unemployment remains low and wage growth, though nothing to overly celebrate, has held steady or increased for several years in a row. There is strong demand for home buying, emphasized by higher prices and multiple offers on homes for sale in many submarkets. As has been the case for month after month – and now year after year – low inventory is the primary culprit for any sales malaise rather than lack of offers. New Listings in the Northeast Florida region decreased 2.5 percent to 3,393. Pending Sales were up 3.6 percent to 2,741. Inventory levels fell 20.8 percent to 8,364 units. Prices continued to gain traction. The Median Sales Price increased 9.7 percent to $215,000. Days on Market was down 8.2 percent to 67 days. Sellers were encouraged as Months Supply of Inventory was down 22.2 percent to 3.5 months. With job creation increasing and mortgage rates remaining low, the pull toward homeownership is expected to continue. Yet housing starts have been drifting lower, and some are beginning to worry that a more serious housing shortage could be in the cards if new construction and building permit applications continue to come in lower in year-over-year comparisons while demand remains high. Homebuilder confidence suggests otherwise, so predictions of a gloomy future should be curbed for the time being. - 20.8% Change in Inventory - 6.7% Change in Closed Sales Area breakouts of 33 submarkets begin after page 21. Percent of Original List Price Received Percent of Properties Sold Over List Price All data represents Realtor-brokered activity of single-family residential, condo and townhome sales combined. As all Nassau and St. Johns County Realtors are not members of the Northeast Florida Multiple Listing Service – a wholly owned subsidiary of the Northeast Florida Association of Realtors – reports do not represent the full extent of Realtor sales in those counties.
- 2. Market Overview Key market metrics for the current month and year-to-date. Key Metrics Historical Sparklines 6-2016 6-2017 +/- YTD 2016 YTD 2017 +/- - 4.5% 12.9% 11.7% - 9.3% 14,206 + 1.3% $199,900 - 8.2% 79 76 - 3.8% + 10.1% + 0.4% 172 10,557 73 67 163 $196,000 $215,000 $258,376 + 8.8% 95.4% 95.8% $237,532 13.2% 12.6% + 9.7% $181,500 - 12.4% -- $221,939 $242,791 + 9.4% + 0.6%94.7% 95.3% Housing Affordability Index Days on Market Until Sale Median Sales Price Average Sales Price Percent of Original List Price Received Percent of Properties Sold Over List Price 2,902 2,708 - 6.7% 14,023 New Listings Pending Sales Closed Sales - 2.2% 2,645 2,741 + 3.6% 14,942 15,457 + 3.4% 19,7233,480 3,393 - 2.5% 20,161 Current as of July 8, 2017. All data from Northeast Florida Multiple Listing Service. Report © 2017 ShowingTime. | 2 4.5 152 - 11.6% - 20.8% - 22.2% 8,364 3.5 186 -- -- -- -- -- Months Supply of Homes for Sale Inventory of Homes for Sale 6-2014 6-2015 6-2016 6-2017 6-2014 6-2015 6-2016 6-2017 6-2014 6-2015 6-2016 6-2017 6-2014 6-2015 6-2016 6-2017 6-2014 6-2015 6-2016 6-2017 6-2014 6-2015 6-2016 6-2017 6-2014 6-2015 6-2016 6-2017 6-2014 6-2015 6-2016 6-2017 6-2014 6-2015 6-2016 6-2017 6-2014 6-2015 6-2016 6-2017 6-2014 6-2015 6-2016 6-2017
- 3. New Listings A count of the properties that have been newly listed on the market in a given month. Month Prior Year Current Year + / – July 2016 3,413 3,123 -8.5% August 2016 3,148 3,282 +4.3% September 2016 2,967 2,869 -3.3% October 2016 2,968 2,361 -20.5% November 2016 2,439 2,390 -2.0% December 2016 2,126 2,065 -2.9% January 2017 3,060 3,055 -0.2% February 2017 3,186 2,865 -10.1% March 2017 3,655 3,648 -0.2% April 2017 3,394 3,327 -2.0% May 2017 3,386 3,435 +1.4% June 2017 3,480 3,393 -2.5% 12-Month Avg 3,102 2,984 -3.8% Current as of July 8, 2017. All data from Northeast Florida Multiple Listing Service. Report © 2017 ShowingTime. | 3 3,511 3,480 3,393 2015 2016 2017 June 1,000 1,500 2,000 2,500 3,000 3,500 4,000 4,500 5,000 1-2003 1-2004 1-2005 1-2006 1-2007 1-2008 1-2009 1-2010 1-2011 1-2012 1-2013 1-2014 1-2015 1-2016 1-2017 Historical New Listing Activity 19,741 20,161 19,723 2015 2016 2017 Year To Date -2.2%-0.9% -2.5% +2.1%
- 4. Pending Sales A count of the properties on which contracts have been written in a given month. Month Prior Year Current Year + / – July 2016 2,519 2,418 -4.0% August 2016 2,482 2,383 -4.0% September 2016 2,156 2,204 +2.2% October 2016 2,140 2,000 -6.5% November 2016 1,889 1,976 +4.6% December 2016 1,889 1,865 -1.3% January 2017 2,037 2,081 +2.2% February 2017 2,313 2,350 +1.6% March 2017 2,619 2,816 +7.5% April 2017 2,657 2,716 +2.2% May 2017 2,671 2,753 +3.1% June 2017 2,645 2,741 +3.6% 12-Month Avg 2,335 2,359 +1.0% Current as of July 8, 2017. All data from Northeast Florida Multiple Listing Service. Report © 2017 ShowingTime. | 4 2,625 2,645 2,741 2015 2016 2017 June 750 1,000 1,250 1,500 1,750 2,000 2,250 2,500 2,750 3,000 1-2003 1-2004 1-2005 1-2006 1-2007 1-2008 1-2009 1-2010 1-2011 1-2012 1-2013 1-2014 1-2015 1-2016 1-2017 Historical Pending Sales Activity 14,451 14,942 15,457 2015 2016 2017 Year To Date +3.4%+0.8% +3.6% +3.4%
- 5. Closed Sales A count of actual sales that have closed within a given month. Month Prior Year Current Year + / – July 2016 2,712 2,576 -5.0% August 2016 2,416 2,697 +11.6% September 2016 2,363 2,437 +3.1% October 2016 2,132 2,058 -3.5% November 2016 1,846 2,013 +9.0% December 2016 2,292 2,302 +0.4% January 2017 1,659 1,714 +3.3% February 2017 1,895 1,837 -3.1% March 2017 2,539 2,617 +3.1% April 2017 2,473 2,470 -0.1% May 2017 2,555 2,860 +11.9% June 2017 2,902 2,708 -6.7% 12-Month Avg 2,315 2,357 +2.0% Current as of July 8, 2017. All data from Northeast Florida Multiple Listing Service. Report © 2017 ShowingTime. | 5 2,758 2,902 2,708 2015 2016 2017 June 500 1,000 1,500 2,000 2,500 3,000 3,500 1-2003 1-2004 1-2005 1-2006 1-2007 1-2008 1-2009 1-2010 1-2011 1-2012 1-2013 1-2014 1-2015 1-2016 1-2017 Historical Closed Sales Activity 13,079 14,023 14,206 2015 2016 2017 Year To Date +1.3%+5.2% -6.7% +7.2%
- 6. Days on Market Until Sale Average number of days between when a property is listed and when an offer is accepted in a given month. Month Prior Year Current Year + / – July 2016 77 70 -9.1% August 2016 75 72 -4.0% September 2016 76 73 -3.9% October 2016 80 78 -2.5% November 2016 80 70 -12.5% December 2016 84 78 -7.1% January 2017 84 78 -7.1% February 2017 89 85 -4.5% March 2017 81 83 +2.5% April 2017 78 75 -3.8% May 2017 75 73 -2.7% June 2017 73 67 -8.2% 12-Month Avg 79 75 -5.3% Current as of July 8, 2017. All data from Northeast Florida Multiple Listing Service. Report © 2017 ShowingTime. | 6 81 73 67 2015 2016 2017 June 40 50 60 70 80 90 100 110 120 130 1-2003 1-2004 1-2005 1-2006 1-2007 1-2008 1-2009 1-2010 1-2011 1-2012 1-2013 1-2014 1-2015 1-2016 1-2017 Historical Days on Market Until Sale 88 79 76 2015 2016 2017 Year To Date -3.8%-9.9% -8.2% -10.2%
- 7. Median Sales Price Median price point for all closed sales, not accounting for seller concessions, in a given month. Month Prior Year Current Year + / – July 2016 $180,000 $194,030 +7.8% August 2016 $172,900 $191,950 +11.0% September 2016 $175,000 $189,995 +8.6% October 2016 $170,000 $185,000 +8.8% November 2016 $164,500 $182,000 +10.6% December 2016 $179,210 $195,000 +8.8% January 2017 $164,950 $175,000 +6.1% February 2017 $160,000 $192,000 +20.0% March 2017 $180,000 $194,406 +8.0% April 2017 $181,000 $199,000 +9.9% May 2017 $192,000 $210,300 +9.5% June 2017 $196,000 $215,000 +9.7% 12-Month Med $178,000 $195,000 +9.6% Current as of July 8, 2017. All data from Northeast Florida Multiple Listing Service. Report © 2017 ShowingTime. | 7 $181,000 $196,000 $215,000 2015 2016 2017 June $100,000 $120,000 $140,000 $160,000 $180,000 $200,000 $220,000 1-2003 1-2004 1-2005 1-2006 1-2007 1-2008 1-2009 1-2010 1-2011 1-2012 1-2013 1-2014 1-2015 1-2016 1-2017 Historical Median Sales Price $167,000 $181,500 $199,900 2015 2016 2017 Year To Date +10.1%+8.3% +9.7% +8.7%
- 8. Average Sales Price Average sales price for all closed sales, not accounting for seller concessions, in a given month. Month Prior Year Current Year + / – July 2016 $223,261 $239,128 +7.1% August 2016 $210,628 $238,899 +13.4% September 2016 $208,105 $234,047 +12.5% October 2016 $215,623 $225,466 +4.6% November 2016 $214,162 $223,574 +4.4% December 2016 $224,273 $232,873 +3.8% January 2017 $206,430 $217,623 +5.4% February 2017 $202,873 $228,801 +12.8% March 2017 $214,776 $241,766 +12.6% April 2017 $225,094 $244,314 +8.5% May 2017 $232,493 $251,717 +8.3% June 2017 $237,532 $258,376 +8.8% 12-Month Avg $219,100 $237,898 +8.6% Current as of July 8, 2017. All data from Northeast Florida Multiple Listing Service. Report © 2017 ShowingTime. | 8 $223,830 $237,532 $258,376 2015 2016 2017 June $140,000 $160,000 $180,000 $200,000 $220,000 $240,000 $260,000 $280,000 1-2003 1-2004 1-2005 1-2006 1-2007 1-2008 1-2009 1-2010 1-2011 1-2012 1-2013 1-2014 1-2015 1-2016 1-2017 Historical Average Sales Price $207,830 $221,939 $242,791 2015 2016 2017 Year To Date + 9.4%+ 6.1% + 8.8% + 6.8%
- 9. Percent of Original List Price Received Month Prior Year Current Year + / – July 2016 94.4% 95.7% +1.4% August 2016 94.5% 95.6% +1.2% September 2016 94.2% 95.5% +1.4% October 2016 93.9% 95.0% +1.2% November 2016 93.9% 94.9% +1.1% December 2016 93.9% 94.8% +1.0% January 2017 93.6% 95.0% +1.5% February 2017 93.5% 94.6% +1.2% March 2017 94.6% 95.1% +0.5% April 2017 95.0% 95.5% +0.5% May 2017 95.2% 95.6% +0.4% June 2017 95.4% 95.8% +0.4% 12-Month Avg 94.4% 95.3% +1.0% Current as of July 8, 2017. All data from Northeast Florida Multiple Listing Service. Report © 2017 ShowingTime. | 9 Percentage found when dividing a property’s sales price by its original list price, then taking the average for all properties sold in a given month, not accounting for seller concessions. 94.4% 95.4% 95.8% 2015 2016 2017 June 84% 86% 88% 90% 92% 94% 96% 98% 100% 1-2003 1-2004 1-2005 1-2006 1-2007 1-2008 1-2009 1-2010 1-2011 1-2012 1-2013 1-2014 1-2015 1-2016 1-2017 Historical Percent of Original List Price Received 93.5% 94.7% 95.3% 2015 2016 2017 Year To Date +0.6%+1.1% +0.4% +1.3%
- 10. Percent of Properties Sold Over List Price Month Prior Year Current Year + / – July 2016 12.3% 12.6% +2.4% August 2016 13.4% 13.6% +1.5% September 2016 12.8% 13.1% +2.3% October 2016 12.0% 13.0% +8.3% November 2016 12.1% 11.8% -2.5% December 2016 14.4% 11.7% -18.8% January 2017 11.9% 10.2% -14.3% February 2017 12.1% 11.1% -8.3% March 2017 13.9% 10.3% -25.9% April 2017 13.2% 13.1% -0.8% May 2017 12.5% 12.4% -0.8% June 2017 13.2% 12.6% -4.5% 12-Month Avg 12.9% 12.2% -5.3% Percent of closed sales that sold for more than the most recent list price. Current as of July 8, 2017. All data from Northeast Florida Multiple Listing Service. Report © 2017 ShowingTime. | 10 13.2% 13.2% 12.6% 2015 2016 2017 June 6% 8% 10% 12% 14% 16% 18% 20% 1-2003 1-2004 1-2005 1-2006 1-2007 1-2008 1-2009 1-2010 1-2011 1-2012 1-2013 1-2014 1-2015 1-2016 1-2017 Historical Percent of Properties Sold Over List Price 12.5% 12.9% 11.7% 2015 2016 2017 Year To Date -9.3%+0.4% -4.5% +2.9%
- 11. Housing Affordability Index Month Prior Year Current Year + / – July 2016 175 174 -0.6% August 2016 185 177 -4.3% September 2016 185 178 -3.8% October 2016 190 183 -3.7% November 2016 195 178 -8.7% December 2016 179 160 -10.6% January 2017 195 182 -6.7% February 2017 204 166 -18.6% March 2017 180 164 -8.9% April 2017 183 162 -11.5% May 2017 173 155 -10.4% June 2017 172 152 -11.6% 12-Month Avg 185 169 -8.3% Current as of July 8, 2017. All data from Northeast Florida Multiple Listing Service. Report © 2017 ShowingTime. | 11 This index measures housing affordability for the region. An index of 120 means the median household income was 120% of what is necessary to qualify for the median-priced home under prevailing interest rates. A higher number means greater affordability. 177 172 152 2015 2016 2017 June 100 150 200 250 300 1-2004 1-2005 1-2006 1-2007 1-2008 1-2009 1-2010 1-2011 1-2012 1-2013 1-2014 1-2015 1-2016 1-2017 Historical Housing Affordability Index 192 186 163 2015 2016 2017 Year To Date -12.4%-2.8% -11.6% -3.1%
- 12. Inventory of Homes for Sale The number of properties available for sale in active status at the end of the month. Month Prior Year Current Year + / – July 2016 11,023 10,440 -5.3% August 2016 10,872 10,403 -4.3% September 2016 10,783 10,177 -5.6% October 2016 10,706 9,769 -8.8% November 2016 10,460 9,420 -9.9% December 2016 9,675 8,655 -10.5% January 2017 9,964 8,824 -11.4% February 2017 10,158 8,657 -14.8% March 2017 10,478 8,752 -16.5% April 2017 10,499 8,684 -17.3% May 2017 10,524 8,598 -18.3% June 2017 10,557 8,364 -20.8% 12-Month Avg 10,475 9,229 -12.0% Current as of July 8, 2017. All data from Northeast Florida Multiple Listing Service. Report © 2017 ShowingTime. | 12 11,014 10,557 8,364 2015 2016 2017 June 5,000 7,000 9,000 11,000 13,000 15,000 17,000 19,000 21,000 23,000 1-2003 1-2004 1-2005 1-2006 1-2007 1-2008 1-2009 1-2010 1-2011 1-2012 1-2013 1-2014 1-2015 1-2016 1-2017 Historical Inventory of Homes for Sale -20.8%-4.1%
- 13. Months Supply of Inventory The inventory of homes for sale at the end of a given month, divided by the average monthly pending sales from the last 12 months. Month Prior Year Current Year + / – July 2016 5.0 4.5 -10.0% August 2016 4.9 4.5 -8.2% September 2016 4.8 4.4 -8.3% October 2016 4.7 4.2 -10.6% November 2016 4.6 4.1 -10.9% December 2016 4.2 3.7 -11.9% January 2017 4.3 3.8 -11.6% February 2017 4.4 3.7 -15.9% March 2017 4.5 3.7 -17.8% April 2017 4.5 3.7 -17.8% May 2017 4.5 3.7 -17.8% June 2017 4.5 3.5 -22.2% 12-Month Avg 4.6 4.0 -13.6% Current as of July 8, 2017. All data from Northeast Florida Multiple Listing Service. Report © 2017 ShowingTime. | 13 5.1 4.5 3.5 2015 2016 2017 June 2 4 6 8 10 12 14 16 18 1-2004 1-2005 1-2006 1-2007 1-2008 1-2009 1-2010 1-2011 1-2012 1-2013 1-2014 1-2015 1-2016 1-2017 Historical Months Supply of Inventory -22.2%-11.8%
- 14. Housing Supply Overview A RESEARCH TOOL PROVIDED BY THE NORTHEAST FLORIDA ASSOCIATION OF REALTORS June 2017 Quick Facts $1,000,000 and Above New Construction Pending Sales 15 Days on Market Until Sale 16 Median Sales Price 17 Percent of Original List Price Received 18 Percent of Properties Sold Over List Price 19 Inventory of Homes for Sale 20 Months Supply of Inventory 21 Current as of July 8, 2017. All data from Northeast Florida Multiple Listing Service. Report © 2017 ShowingTime. | 14 Required Reprint / Use and Source Credit: NEFAR is happy to share our market statistical report data; prior permission is not required. Source credit is required, however, for all uses (including use by NEFAR members) whether the use is written, digital, broadcast, spoken, social media or other. Use of NEFAR data must be accompanied by the following attribution – Source: Northeast Florida Association of Realtors . Condo-Townhouse A RESEARCH TOOL PROVIDED BY THE NORTHEAST FLORIDA ASSOCIATION OF REALTORS + 23.5% - 3.7% + 1.6% Price Range With Strongest Sales: Construction Status With Strongest Sales: Property Type With Strongest Sales: All data represents Realtor-brokered activity of single-family residential, condo and townhome sales combined. As all Nassau and St. Johns County Realtors are not members of the Northeast Florida Multiple Listing Service – a wholly owned subsidiary of the Northeast Florida Association of Realtors – reports do not represent the full extent of Realtor sales in those counties.
- 15. Pending Sales A count of properties on which offers have been accepted. Based on a rolling 12-month total. By Price Range 6-2016 6-2017 Change 6-2016 6-2017 Change 6-2016 6-2017 Change $149,999 and Below 10,949 9,259 - 15.4% 8,472 7,001 - 17.4% 2,477 2,258 - 8.8% $150,000 to $199,999 4,750 5,073 + 6.8% 4,068 4,271 + 5.0% 682 802 + 17.6% $200,000 to $299,999 6,337 7,184 + 13.4% 5,919 6,652 + 12.4% 418 532 + 27.3% $300,000 to $499,999 4,364 4,866 + 11.5% 4,028 4,524 + 12.3% 336 342 + 1.8% $500,000 to $999,999 1,357 1,600 + 17.9% 1,230 1,451 + 18.0% 127 149 + 17.3% $1,000,000 and Above 260 321 + 23.5% 237 278 + 17.3% 23 43 + 87.0% All Price Ranges 28,017 28,303 + 1.0% 23,954 24,177 + 0.9% 4,063 4,126 + 1.6% By Construction Status 6-2016 6-2017 Change 6-2016 6-2017 Change 6-2016 6-2017 Change Previously Owned 23,798 22,117 - 7.1% 20,141 18,638 - 7.5% 3,657 3,479 - 4.9% New Construction 4,229 4,074 - 3.7% 3,812 3,613 - 5.2% 417 461 + 10.6% All Property Types 28,017 28,303 + 1.0% 23,954 24,177 + 0.9% 4,063 4,126 + 1.6% Current as of July 8, 2017. All data from Northeast Florida Multiple Listing Service. Report © 2017 ShowingTime. | 15 All Properties Single-Family Condo-Townhouse 10,949 4,750 6,337 4,364 1,357 260 9,259 5,073 7,184 4,866 1,600 321 $149,999 and Below $150,000 to $199,999 $200,000 to $299,999 $300,000 to $499,999 $500,000 to $999,999 $1,000,000 and Above By Price Range 6-2016 6-2017 23,798 4,229 22,117 4,074 Previously Owned New Construction By Construction Status 6-2016 6-2017 - 15.4% 23,954 4,063 24,177 4,126 Single-Family Condo-Townhouse By Property Type 6-2016 6-2017 + 6.8% + 13.4% + 11.5% + 23.5% + 0.9% + 1.6%- 7.1% - 3.7%+ 17.9%
- 16. Days on Market Until Sale By Price Range 6-2016 6-2017 Change 6-2016 6-2017 Change 6-2016 6-2017 Change $149,999 and Below 75 66 - 12.0% 79 70 - 11.4% 63 54 - 14.3% $150,000 to $199,999 72 64 - 11.1% 71 63 - 11.3% 79 71 - 10.1% $200,000 to $299,999 76 75 - 1.3% 75 74 - 1.3% 84 94 + 11.9% $300,000 to $499,999 89 89 0.0% 87 88 + 1.1% 119 99 - 16.8% $500,000 to $999,999 106 108 + 1.9% 102 106 + 3.9% 136 125 - 8.1% $1,000,000 and Above 133 139 + 4.5% 137 135 - 1.5% 91 167 + 83.5% All Price Ranges 79 75 - 5.1% 80 76 - 5.0% 74 69 - 6.8% By Construction Status 6-2016 6-2017 Change 6-2016 6-2017 Change 6-2016 6-2017 Change Previously Owned 77 71 - 7.8% 78 72 - 7.7% 71 65 - 8.5% New Construction 89 97 + 9.0% 87 96 + 10.3% 104 107 + 2.9% All Property Types 79 75 - 5.1% 80 76 - 5.0% 74 69 - 6.8% Current as of July 8, 2017. All data from Northeast Florida Multiple Listing Service. Report © 2017 ShowingTime. | 16 Average number of days between when a property is listed and when an offer is accepted. Based on a rolling 12-month average. All Properties Single-Family Condo-Townhouse 75 72 76 89 106 133 66 64 75 89 108 139 $149,999 and Below $150,000 to $199,999 $200,000 to $299,999 $300,000 to $499,999 $500,000 to $999,999 $1,000,000 and Above By Price Range 6-2016 6-2017 77 89 71 97 Previously Owned New Construction By Construction Status 6-2016 6-2017 - 12.0% 80 74 76 69 Single-Family Condo-Townhouse By Property Type 6-2016 6-2017 - 11.1% - 1.3% 0.0% + 4.5% - 5.0% - 6.8%- 7.8% + 9.0%+ 1.9%
- 17. Median Sales Price By Construction Status 6-2016 6-2017 Change 6-2016 6-2017 Change 6-2016 6-2017 Change Previously Owned $160,000 $178,000 + 11.3% $170,000 $187,945 + 10.6% $120,001 $135,000 + 12.5% New Construction $273,000 $280,215 + 2.6% $282,927 $292,451 + 3.4% $169,970 $155,000 - 8.8% All Construction Statuses $178,000 $195,000 + 9.6% $190,000 $207,500 + 9.2% $125,000 $138,550 + 10.8% Current as of July 8, 2017. All data from Northeast Florida Multiple Listing Service. Report © 2017 ShowingTime. | 17 Median price point for all closed sales, not accounting for seller concessions. Based on a rolling 12-month median. All Properties Single-Family Condo-Townhouse $160,000 $273,000 $178,000 $280,215 Previously Owned New Construction By Construction Status 6-2016 6-2017 $178,000 $190,000 $125,000 $195,000 $207,500 $138,550 All Properties Single-Family Condo-Townhouse By Property Type 6-2016 6-2017 + 9.2% + 10.8%+ 11.3% + 9.6%+ 2.6%
- 18. Percent of Original List Price Received By Price Range 6-2016 6-2017 Change 6-2016 6-2017 Change 6-2016 6-2017 Change $149,999 and Below 92.3% 93.8% + 1.6% 91.7% 93.1% + 1.5% 94.4% 95.7% + 1.4% $150,000 to $199,999 95.9% 96.4% + 0.5% 95.8% 96.3% + 0.5% 96.5% 96.9% + 0.4% $200,000 to $299,999 96.0% 96.3% + 0.3% 96.0% 96.4% + 0.4% 95.9% 95.6% - 0.3% $300,000 to $499,999 96.0% 96.1% + 0.1% 96.1% 96.1% 0.0% 95.5% 95.7% + 0.2% $500,000 to $999,999 94.8% 94.6% - 0.2% 94.9% 94.7% - 0.2% 93.2% 94.1% + 1.0% $1,000,000 and Above 90.3% 91.1% + 0.9% 89.9% 91.0% + 1.2% 94.2% 92.1% - 2.2% All Price Ranges 94.4% 95.3% + 1.0% 94.3% 95.2% + 1.0% 95.0% 95.8% + 0.8% By Construction Status 6-2016 6-2017 Change 6-2016 6-2017 Change 6-2016 6-2017 Change Previously Owned 93.5% 94.7% + 1.3% 93.4% 94.5% + 1.2% 94.2% 95.3% + 1.2% New Construction 99.4% 98.9% - 0.5% 99.2% 98.7% - 0.5% 101.1% 100.2% - 0.9% All Property Types 94.4% 95.3% + 1.0% 94.3% 95.2% + 1.0% 95.0% 95.8% + 0.8% Current as of July 8, 2017. All data from Northeast Florida Multiple Listing Service. Report © 2017 ShowingTime. | 18 Percentage found when dividing a property’s sales price by its original list price, then taking the average for all properties sold, not accounting for seller concessions. Based on a rolling 12-month average. All Properties Single-Family Condo-Townhouse 92.3% 95.9% 96.0% 96.0% 94.8% 90.3% 93.8% 96.4% 96.3% 96.1% 94.6% 91.1% $149,999 and Below $150,000 to $199,999 $200,000 to $299,999 $300,000 to $499,999 $500,000 to $999,999 $1,000,000 and Above By Price Range 6-2016 6-2017 93.5% 99.4% 94.7% 98.9% Previously Owned New Construction By Construction Status 6-2016 6-2017 + 1.6% 94.3% 95.0% 95.2% 95.8% Single-Family Condo-Townhouse By Property Type 6-2016 6-2017 + 0.5% + 0.3% + 0.1% + 0.9% + 1.0% + 0.8%+ 1.3% - 0.5%- 0.2%
- 19. Percent of Properties Sold Over List Price By Price Range 6-2016 6-2017 Change 6-2016 6-2017 Change 6-2016 6-2017 Change $149,999 and Below 16.9% 17.5% + 3.6% 17.4% 18.7% + 7.7% 14.0% 10.9% - 22.2% $150,000 to $199,999 15.3% 13.8% - 9.6% 15.8% 14.3% - 9.2% 8.7% 7.3% - 16.6% $200,000 to $299,999 13.3% 11.4% - 14.1% 13.5% 11.8% - 12.5% 10.7% 6.4% - 40.0% $300,000 to $499,999 10.7% 9.7% - 9.3% 11.0% 10.2% - 6.9% 7.3% 3.8% - 47.6% $500,000 to $999,999 6.1% 3.6% - 41.4% 6.4% 4.1% - 36.4% 3.6% 0.0% - 100.0% $1,000,000 and Above 19.9% 18.8% - 5.4% 21.1% 20.4% - 3.2% 16.0% 13.9% - 13.0% All Price Ranges 16.6% 15.1% - 8.6% 17.0% 15.8% - 7.0% 14.2% 11.2% - 20.7% By Construction Status 6-2016 6-2017 Change 6-2016 6-2017 Change 6-2016 6-2017 Change Previously Owned 14.8% 14.2% - 3.8% 15.3% 14.9% - 2.7% 12.0% 10.5% - 12.5% New Construction 26.9% 20.2% - 25.0% 26.2% 20.5% - 21.8% 32.9% 17.4% - 47.2% All Property Types 16.6% 15.1% - 8.6% 17.0% 15.8% - 7.0% 14.2% 11.2% - 20.7% Current as of July 8, 2017. All data from Northeast Florida Multiple Listing Service. Report © 2017 ShowingTime. | 19 Percent of closed sales that sold for more than the most recent list price. Based on a rolling 12-month average. All Properties Single-Family Condo-Townhouse 16.9% 15.3% 13.3% 10.7% 6.1% 19.9% 17.5% 13.8% 11.4% 9.7% 3.6% 18.8% $149,999 and Below $150,000 to $199,999 $200,000 to $299,999 $300,000 to $499,999 $500,000 to $999,999 $1,000,000 and Above By Price Range 6-2016 6-2017 14.8% 26.9% 14.2% 20.2% Previously Owned New Construction By Construction Status 6-2016 6-2017 + 3.6% 17.0% 14.2% 15.8% 11.2% Single-Family Condo-Townhouse By Property Type 6-2016 6-2017 - 9.6% - 14.1% - 9.3% - 5.4% - 7.0% - 20.7%- 3.8% - 25.0%- 41.4%
- 20. Inventory of Homes for Sale The number of properties available for sale in active status at the end of the most recent month. Based on one month of activity. By Price Range 6-2016 6-2017 Change 6-2016 6-2017 Change 6-2016 6-2017 Change $149,999 and Below 2,952 1,640 - 44.4% 2,355 1,314 - 44.2% 597 326 - 45.4% $150,000 to $199,999 1,373 968 - 29.5% 1,151 778 - 32.4% 222 190 - 14.4% $200,000 to $299,999 2,280 1,948 - 14.6% 2,060 1,798 - 12.7% 220 150 - 31.8% $300,000 to $499,999 2,192 2,193 + 0.0% 1,990 2,015 + 1.3% 202 178 - 11.9% $500,000 to $999,999 1,268 1,157 - 8.8% 1,148 1,045 - 9.0% 120 112 - 6.7% $1,000,000 and Above 492 458 - 6.9% 448 422 - 5.8% 44 36 - 18.2% All Price Ranges 10,557 8,364 - 20.8% 9,152 7,372 - 19.4% 1,405 992 - 29.4% By Construction Status 6-2016 6-2017 Change 6-2016 6-2017 Change 6-2016 6-2017 Change Previously Owned 9,005 7,111 - 21.0% 7,798 6,215 - 20.3% 1,207 896 - 25.8% New Construction 1,552 1,253 - 19.3% 1,354 1,157 - 14.5% 198 96 - 51.5% All Property Types 10,557 8,364 - 20.8% 9,152 7,372 - 19.4% 1,405 992 - 29.4% Current as of July 8, 2017. All data from Northeast Florida Multiple Listing Service. Report © 2017 ShowingTime. | 20 All Properties Single-Family Condo-Townhouse 2,952 1,373 2,280 2,192 1,268 492 1,640 968 1,948 2,193 1,157 458 $149,999 and Below $150,000 to $199,999 $200,000 to $299,999 $300,000 to $499,999 $500,000 to $999,999 $1,000,000 and Above By Price Range 6-2016 6-2017 9,005 1,552 7,111 1,253 Previously Owned New Construction By Construction Status 6-2016 6-2017 - 44.4% 9,152 1,405 7,372 992 Single-Family Condo-Townhouse By Property Type 6-2016 6-2017 - 29.5% - 14.6% + 0.0% - 6.9% - 19.4% - 29.4%- 21.0% - 19.3%- 8.8%
- 21. Months Supply of Inventory By Price Range 6-2016 6-2017 Change 6-2016 6-2017 Change 6-2016 6-2017 Change $149,999 and Below 3.2 2.1 - 34.4% 3.3 2.3 - 30.3% 2.9 1.7 - 41.4% $150,000 to $199,999 3.5 2.3 - 34.3% 3.4 2.2 - 35.3% 3.9 2.8 - 28.2% $200,000 to $299,999 4.3 3.3 - 23.3% 4.2 3.2 - 23.8% 6.3 3.4 - 46.0% $300,000 to $499,999 6.0 5.4 - 10.0% 5.9 5.3 - 10.2% 7.2 6.2 - 13.9% $500,000 to $999,999 11.2 8.7 - 22.3% 11.2 8.6 - 23.2% 11.3 9.0 - 20.4% $1,000,000 and Above 22.7 17.1 - 24.7% 22.7 18.2 - 19.8% 21.0 10.0 - 52.4% All Price Ranges 4.5 3.5 - 22.2% 4.6 3.7 - 19.6% 4.1 2.9 - 29.3% By Construction Status 6-2016 6-2017 Change 6-2016 6-2017 Change 6-2016 6-2017 Change Previously Owned 4.5 3.6 - 21.3% 4.6 3.7 - 20.7% 4.0 3.0 - 25.5% New Construction 4.4 3.4 - 22.9% 4.3 3.5 - 17.1% 5.7 2.3 - 59.2% All Property Types 4.5 3.5 - 22.2% 4.6 3.7 - 19.6% 4.1 2.9 - 29.3% Current as of July 8, 2017. All data from Northeast Florida Multiple Listing Service. Report © 2017 ShowingTime. | 21 The inventory of homes for sale at the end of the most recent month, based on one month of activity, divided by the average monthly pending sales from the last 12 months. All Properties Single-Family Condo-Townhouse 3.2 3.5 4.3 6.0 11.2 22.7 2.1 2.3 3.3 5.4 8.7 17.1 $149,999 and Below $150,000 to $199,999 $200,000 to $299,999 $300,000 to $499,999 $500,000 to $999,999 $1,000,000 and Above By Price Range 6-2016 6-2017 4.5 4.4 3.6 3.4 Previously Owned New Construction By Construction Status 6-2016 6-2017 - 34.4% 4.6 4.1 3.7 2.9 Single-Family Condo-Townhouse By Property Type 6-2016 6-2017 - 34.3% - 23.3% - 10.0% - 24.7% - 19.6% - 29.3%- 21.3% - 22.9%- 22.3%
- 22. A RESEARCH TOOL PROVIDED BY THE NORTHEAST FLORIDA ASSOCIATION OF REALTORS® 2016 2017 + / – 2016 2017 + / – New Listings 352 345 - 2.0% 1,855 1,900 + 2.4% Closed Sales 286 271 - 5.2% 1,379 1,342 - 2.7% Median Sales Price* $220,000 $222,900 + 1.3% $195,000 $225,000 + 15.4% Percent of Original List Price Received* 96.3% 96.7% + 0.4% 95.7% 96.3% + 0.6% Percent of Properties Sold Over List Price* 19.2% 16.2% - 15.6% 17.5% 14.1% - 19.4% Days on Market Until Sale 59 53 - 10.2% 67 61 - 9.0% Inventory of Homes for Sale 827 732 - 11.5% -- -- -- Months Supply of Inventory 3.7 3.3 - 10.8% -- -- -- Year to Date ** Each dot represents the change in median sales price from the prior year using a 6-month weighted average. This means that each of the 6 months used in a dot are proportioned according to their share of sales during that period. | Current as of July 8, 2017. All data from Northeast Florida Multiple Listing Service. | Powered by ShowingTime 10K. Local Market Update – June 2017 All MLS Southside / Mandarin / Bartram * Does not account for seller concessions. | Activity for one month can sometimes look extreme due to small sample size. Southside / Mandarin / Bartram - 2.0% - 5.2% + 1.3% Change in New Listings Change in Closed Sales Change in Median Sales Price Region 01 June - 25% - 20% - 15% - 10% - 5% 0% + 5% + 10% + 15% + 20% 1-2008 7-2008 1-2009 7-2009 1-2010 7-2010 1-2011 7-2011 1-2012 7-2012 1-2013 7-2013 1-2014 7-2014 1-2015 7-2015 1-2016 7-2016 1-2017 Change in Median Sales Price from Prior Year (6-Month Average)** b a 1,855 1,379 1,900 1,342 New Listings Closed Sales Year to Date 2016 2017 - 2.7%+ 2.4% 352 286 345 271 New Listings Closed Sales June 2016 2017 - 5.2%- 2.0%
- 23. A RESEARCH TOOL PROVIDED BY THE NORTHEAST FLORIDA ASSOCIATION OF REALTORS® 2016 2017 + / – 2016 2017 + / – New Listings 411 389 - 5.4% 2,367 2,238 - 5.4% Closed Sales 370 300 - 18.9% 1,803 1,713 - 5.0% Median Sales Price* $186,650 $218,950 + 17.3% $179,950 $189,100 + 5.1% Percent of Original List Price Received* 96.1% 97.1% + 1.0% 95.7% 96.4% + 0.7% Percent of Properties Sold Over List Price* 15.4% 17.0% + 10.4% 16.6% 13.9% - 16.3% Days on Market Until Sale 62 62 0.0% 68 67 - 1.5% Inventory of Homes for Sale 1,012 800 - 20.9% -- -- -- Months Supply of Inventory 3.4 2.8 - 17.6% -- -- -- Year to Date ** Each dot represents the change in median sales price from the prior year using a 6-month weighted average. This means that each of the 6 months used in a dot are proportioned according to their share of sales during that period. | Current as of July 8, 2017. All data from Northeast Florida Multiple Listing Service. | Powered by ShowingTime 10K. Local Market Update – June 2017 All MLS Southside * Does not account for seller concessions. | Activity for one month can sometimes look extreme due to small sample size. Southside - 5.4% - 18.9% + 17.3% Change in New Listings Change in Closed Sales Change in Median Sales Price Region 02 June - 30% - 20% - 10% 0% + 10% + 20% + 30% + 40% 1-2008 7-2008 1-2009 7-2009 1-2010 7-2010 1-2011 7-2011 1-2012 7-2012 1-2013 7-2013 1-2014 7-2014 1-2015 7-2015 1-2016 7-2016 1-2017 Change in Median Sales Price from Prior Year (6-Month Average)** b a 2,367 1,803 2,238 1,713 New Listings Closed Sales Year to Date 2016 2017 - 5.0%- 5.4% 411 370389 300 New Listings Closed Sales June 2016 2017 - 18.9%- 5.4%
- 24. A RESEARCH TOOL PROVIDED BY THE NORTHEAST FLORIDA ASSOCIATION OF REALTORS® 2016 2017 + / – 2016 2017 + / – New Listings 84 66 - 21.4% 484 405 - 16.3% Closed Sales 67 62 - 7.5% 295 282 - 4.4% Median Sales Price* $239,500 $293,610 + 22.6% $247,500 $262,375 + 6.0% Percent of Original List Price Received* 94.1% 93.7% - 0.4% 94.1% 93.0% - 1.2% Percent of Properties Sold Over List Price* 10.4% 11.3% + 8.7% 9.5% 7.8% - 17.9% Days on Market Until Sale 83 76 - 8.4% 79 83 + 5.1% Inventory of Homes for Sale 271 185 - 31.7% -- -- -- Months Supply of Inventory 5.4 3.8 - 29.6% -- -- -- Year to Date ** Each dot represents the change in median sales price from the prior year using a 6-month weighted average. This means that each of the 6 months used in a dot are proportioned according to their share of sales during that period. | Current as of July 8, 2017. All data from Northeast Florida Multiple Listing Service. | Powered by ShowingTime 10K. Local Market Update – June 2017 All MLS Riverside / Avondale / Ortega * Does not account for seller concessions. | Activity for one month can sometimes look extreme due to small sample size. Riverside / Avondale / Ortega - 21.4% - 7.5% + 22.6% Change in New Listings Change in Closed Sales Change in Median Sales Price Region 03 June - 30% - 20% - 10% 0% + 10% + 20% + 30% + 40% 1-2008 7-2008 1-2009 7-2009 1-2010 7-2010 1-2011 7-2011 1-2012 7-2012 1-2013 7-2013 1-2014 7-2014 1-2015 7-2015 1-2016 7-2016 1-2017 Change in Median Sales Price from Prior Year (6-Month Average)** b a 484 295 405 282 New Listings Closed Sales Year to Date 2016 2017 - 4.4%- 16.3% 84 6766 62 New Listings Closed Sales June 2016 2017 - 7.5%- 21.4%
- 25. A RESEARCH TOOL PROVIDED BY THE NORTHEAST FLORIDA ASSOCIATION OF REALTORS® 2016 2017 + / – 2016 2017 + / – New Listings 257 230 - 10.5% 1,310 1,355 + 3.4% Closed Sales 180 190 + 5.6% 1,011 1,010 - 0.1% Median Sales Price* $160,500 $196,200 + 22.2% $155,000 $175,000 + 12.9% Percent of Original List Price Received* 95.7% 96.3% + 0.6% 95.2% 96.6% + 1.5% Percent of Properties Sold Over List Price* 19.0% 16.3% - 14.2% 18.1% 18.3% + 1.1% Days on Market Until Sale 59 44 - 25.4% 68 58 - 14.7% Inventory of Homes for Sale 556 458 - 17.6% -- -- -- Months Supply of Inventory 3.2 2.8 - 12.5% -- -- -- Year to Date ** Each dot represents the change in median sales price from the prior year using a 6-month weighted average. This means that each of the 6 months used in a dot are proportioned according to their share of sales during that period. | Current as of July 8, 2017. All data from Northeast Florida Multiple Listing Service. | Powered by ShowingTime 10K. Local Market Update – June 2017 All MLS Arlington / Fort Caroline * Does not account for seller concessions. | Activity for one month can sometimes look extreme due to small sample size. Arlington / Fort Caroline - 10.5% + 5.6% + 22.2% Change in New Listings Change in Closed Sales Change in Median Sales Price Region 04 June - 25% - 20% - 15% - 10% - 5% 0% + 5% + 10% + 15% + 20% + 25% 1-2008 7-2008 1-2009 7-2009 1-2010 7-2010 1-2011 7-2011 1-2012 7-2012 1-2013 7-2013 1-2014 7-2014 1-2015 7-2015 1-2016 7-2016 1-2017 Change in Median Sales Price from Prior Year (6-Month Average)** b a 1,310 1,011 1,355 1,010 New Listings Closed Sales Year to Date 2016 2017 - 0.1%+ 3.4% 257 180 230 190 New Listings Closed Sales June 2016 2017 + 5.6%- 10.5%
- 26. A RESEARCH TOOL PROVIDED BY THE NORTHEAST FLORIDA ASSOCIATION OF REALTORS® 2016 2017 + / – 2016 2017 + / – New Listings 136 139 + 2.2% 811 746 - 8.0% Closed Sales 124 104 - 16.1% 588 598 + 1.7% Median Sales Price* $110,900 $125,000 + 12.7% $94,950 $117,000 + 23.2% Percent of Original List Price Received* 94.8% 96.3% + 1.6% 93.6% 94.8% + 1.3% Percent of Properties Sold Over List Price* 16.9% 24.0% + 42.0% 18.0% 18.4% + 2.2% Days on Market Until Sale 58 60 + 3.4% 64 70 + 9.4% Inventory of Homes for Sale 327 226 - 30.9% -- -- -- Months Supply of Inventory 3.3 2.3 - 30.3% -- -- -- Year to Date ** Each dot represents the change in median sales price from the prior year using a 6-month weighted average. This means that each of the 6 months used in a dot are proportioned according to their share of sales during that period. | Current as of July 8, 2017. All data from Northeast Florida Multiple Listing Service. | Powered by ShowingTime 10K. Local Market Update – June 2017 All MLS Hyde Grove / Murray Hill / Lakeshore / Wesconnett * Does not account for seller concessions. | Activity for one month can sometimes look extreme due to small sample size. Hyde Grove / Murray Hill / Lakeshore / Wesconnett + 2.2% - 16.1% + 12.7% Change in New Listings Change in Closed Sales Change in Median Sales Price Region 05 June - 60% - 40% - 20% 0% + 20% + 40% + 60% 1-2008 7-2008 1-2009 7-2009 1-2010 7-2010 1-2011 7-2011 1-2012 7-2012 1-2013 7-2013 1-2014 7-2014 1-2015 7-2015 1-2016 7-2016 1-2017 Change in Median Sales Price from Prior Year (6-Month Average)** b a 811 588 746 598 New Listings Closed Sales Year to Date 2016 2017 + 1.7%- 8.0% 136 124 139 104 New Listings Closed Sales June 2016 2017 - 16.1%+ 2.2%
- 27. A RESEARCH TOOL PROVIDED BY THE NORTHEAST FLORIDA ASSOCIATION OF REALTORS® 2016 2017 + / – 2016 2017 + / – New Listings 165 171 + 3.6% 1,080 1,016 - 5.9% Closed Sales 171 136 - 20.5% 838 750 - 10.5% Median Sales Price* $131,500 $150,000 + 14.1% $127,948 $150,000 + 17.2% Percent of Original List Price Received* 96.2% 96.1% - 0.1% 95.2% 96.0% + 0.8% Percent of Properties Sold Over List Price* 19.3% 22.1% + 14.5% 19.8% 18.4% - 7.1% Days on Market Until Sale 65 51 - 21.5% 67 59 - 11.9% Inventory of Homes for Sale 445 337 - 24.3% -- -- -- Months Supply of Inventory 3.1 2.5 - 19.4% -- -- -- Year to Date ** Each dot represents the change in median sales price from the prior year using a 6-month weighted average. This means that each of the 6 months used in a dot are proportioned according to their share of sales during that period. | Current as of July 8, 2017. All data from Northeast Florida Multiple Listing Service. | Powered by ShowingTime 10K. Local Market Update – June 2017 All MLS West Jacksonville * Does not account for seller concessions. | Activity for one month can sometimes look extreme due to small sample size. West Jacksonville + 3.6% - 20.5% + 14.1% Change in New Listings Change in Closed Sales Change in Median Sales Price Region 06 June - 30% - 20% - 10% 0% + 10% + 20% + 30% 1-2008 7-2008 1-2009 7-2009 1-2010 7-2010 1-2011 7-2011 1-2012 7-2012 1-2013 7-2013 1-2014 7-2014 1-2015 7-2015 1-2016 7-2016 1-2017 Change in Median Sales Price from Prior Year (6-Month Average)** b a 1,080 838 1,016 750 New Listings Closed Sales Year to Date 2016 2017 - 10.5%- 5.9% 165 171171 136 New Listings Closed Sales June 2016 2017 - 20.5%+ 3.6%
- 28. A RESEARCH TOOL PROVIDED BY THE NORTHEAST FLORIDA ASSOCIATION OF REALTORS® 2016 2017 + / – 2016 2017 + / – New Listings 155 190 + 22.6% 890 980 + 10.1% Closed Sales 96 108 + 12.5% 533 622 + 16.7% Median Sales Price* $37,000 $49,500 + 33.8% $31,000 $46,250 + 49.2% Percent of Original List Price Received* 90.2% 91.4% + 1.3% 89.0% 90.7% + 1.9% Percent of Properties Sold Over List Price* 15.8% 17.0% + 7.6% 20.4% 14.7% - 27.9% Days on Market Until Sale 76 70 - 7.9% 91 73 - 19.8% Inventory of Homes for Sale 544 362 - 33.5% -- -- -- Months Supply of Inventory 6.2 3.5 - 43.5% -- -- -- Year to Date ** Each dot represents the change in median sales price from the prior year using a 6-month weighted average. This means that each of the 6 months used in a dot are proportioned according to their share of sales during that period. | Current as of July 8, 2017. All data from Northeast Florida Multiple Listing Service. | Powered by ShowingTime 10K. Local Market Update – June 2017 All MLS Springfield / Downtown / Paxon / Trout River South / Downtown Jacksonville - E * Does not account for seller concessions. | Activity for one month can sometimes look extreme due to small sample size. Springfield / Downtown / Paxon / Trout River South / Downtown Jacksonville - E + 22.6% + 12.5% + 33.8% Change in New Listings Change in Closed Sales Change in Median Sales Price Region 07 June - 80% - 60% - 40% - 20% 0% + 20% + 40% + 60% + 80% 1-2008 7-2008 1-2009 7-2009 1-2010 7-2010 1-2011 7-2011 1-2012 7-2012 1-2013 7-2013 1-2014 7-2014 1-2015 7-2015 1-2016 7-2016 1-2017 Change in Median Sales Price from Prior Year (6-Month Average)** b a 890 533 980 622 New Listings Closed Sales Year to Date 2016 2017 + 16.7%+ 10.1% 155 96 190 108 New Listings Closed Sales June 2016 2017 + 12.5%+ 22.6%
- 29. A RESEARCH TOOL PROVIDED BY THE NORTHEAST FLORIDA ASSOCIATION OF REALTORS® 2016 2017 + / – 2016 2017 + / – New Listings 43 29 - 32.6% 214 138 - 35.5% Closed Sales 30 18 - 40.0% 140 109 - 22.1% Median Sales Price* $157,175 $142,500 - 9.3% $153,843 $146,000 - 5.1% Percent of Original List Price Received* 96.7% 96.1% - 0.6% 95.6% 93.9% - 1.8% Percent of Properties Sold Over List Price* 14.3% 22.2% + 55.2% 24.6% 14.7% - 40.2% Days on Market Until Sale 81 79 - 2.5% 84 72 - 14.3% Inventory of Homes for Sale 102 53 - 48.0% -- -- -- Months Supply of Inventory 4.1 2.6 - 36.6% -- -- -- Year to Date ** Each dot represents the change in median sales price from the prior year using a 6-month weighted average. This means that each of the 6 months used in a dot are proportioned according to their share of sales during that period. | Current as of July 8, 2017. All data from Northeast Florida Multiple Listing Service. | Powered by ShowingTime 10K. Local Market Update – June 2017 All MLS Marietta / Whitehouse / Baldwin / Garden St / Dinsmore * Does not account for seller concessions. | Activity for one month can sometimes look extreme due to small sample size. Marietta / Whitehouse / Baldwin / Garden St / Dinsmore - 32.6% - 40.0% - 9.3% Change in New Listings Change in Closed Sales Change in Median Sales Price Region 08 June - 40% - 20% 0% + 20% + 40% + 60% + 80% + 100% + 120% + 140% 1-2008 7-2008 1-2009 7-2009 1-2010 7-2010 1-2011 7-2011 1-2012 7-2012 1-2013 7-2013 1-2014 7-2014 1-2015 7-2015 1-2016 7-2016 1-2017 Change in Median Sales Price from Prior Year (6-Month Average)** b a 214 140138 109 New Listings Closed Sales Year to Date 2016 2017 - 22.1%- 35.5% 43 3029 18 New Listings Closed Sales June 2016 2017 - 40.0%- 32.6%
- 30. A RESEARCH TOOL PROVIDED BY THE NORTHEAST FLORIDA ASSOCIATION OF REALTORS® 2016 2017 + / – 2016 2017 + / – New Listings 145 186 + 28.3% 992 1,018 + 2.6% Closed Sales 156 132 - 15.4% 724 783 + 8.1% Median Sales Price* $185,000 $192,500 + 4.1% $178,500 $189,000 + 5.9% Percent of Original List Price Received* 97.2% 95.4% - 1.9% 95.9% 95.6% - 0.3% Percent of Properties Sold Over List Price* 21.8% 16.7% - 23.4% 20.6% 17.7% - 14.1% Days on Market Until Sale 68 65 - 4.4% 83 73 - 12.0% Inventory of Homes for Sale 487 388 - 20.3% -- -- -- Months Supply of Inventory 3.9 3.1 - 20.5% -- -- -- Year to Date ** Each dot represents the change in median sales price from the prior year using a 6-month weighted average. This means that each of the 6 months used in a dot are proportioned according to their share of sales during that period. | Current as of July 8, 2017. All data from Northeast Florida Multiple Listing Service. | Powered by ShowingTime 10K. Local Market Update – June 2017 All MLS Jacksonville - North * Does not account for seller concessions. | Activity for one month can sometimes look extreme due to small sample size. Jacksonville - North + 28.3% - 15.4% + 4.1% Change in New Listings Change in Closed Sales Change in Median Sales Price Region 09 June - 20% - 15% - 10% - 5% 0% + 5% + 10% + 15% + 20% + 25% + 30% + 35% 1-2008 7-2008 1-2009 7-2009 1-2010 7-2010 1-2011 7-2011 1-2012 7-2012 1-2013 7-2013 1-2014 7-2014 1-2015 7-2015 1-2016 7-2016 1-2017 Change in Median Sales Price from Prior Year (6-Month Average)** b a 992 724 1,018 783 New Listings Closed Sales Year to Date 2016 2017 + 8.1%+ 2.6% 145 156 186 132 New Listings Closed Sales June 2016 2017 - 15.4%+ 28.3%
- 31. A RESEARCH TOOL PROVIDED BY THE NORTHEAST FLORIDA ASSOCIATION OF REALTORS® 2016 2017 + / – 2016 2017 + / – New Listings 111 88 - 20.7% 526 498 - 5.3% Closed Sales 59 80 + 35.6% 277 377 + 36.1% Median Sales Price* $250,000 $286,450 + 14.6% $240,000 $255,000 + 6.3% Percent of Original List Price Received* 96.1% 96.5% + 0.4% 95.2% 95.8% + 0.6% Percent of Properties Sold Over List Price* 8.5% 18.8% + 121.2% 11.6% 13.5% + 16.4% Days on Market Until Sale 81 58 - 28.4% 75 81 + 8.0% Inventory of Homes for Sale 265 172 - 35.1% -- -- -- Months Supply of Inventory 5.2 3.0 - 42.3% -- -- -- Year to Date ** Each dot represents the change in median sales price from the prior year using a 6-month weighted average. This means that each of the 6 months used in a dot are proportioned according to their share of sales during that period. | Current as of July 8, 2017. All data from Northeast Florida Multiple Listing Service. | Powered by ShowingTime 10K. Local Market Update – June 2017 All MLS Fleming Island Area * Does not account for seller concessions. | Activity for one month can sometimes look extreme due to small sample size. Fleming Island Area - 20.7% + 35.6% + 14.6% Change in New Listings Change in Closed Sales Change in Median Sales Price Region 12 June - 25% - 20% - 15% - 10% - 5% 0% + 5% + 10% + 15% + 20% + 25% 1-2008 7-2008 1-2009 7-2009 1-2010 7-2010 1-2011 7-2011 1-2012 7-2012 1-2013 7-2013 1-2014 7-2014 1-2015 7-2015 1-2016 7-2016 1-2017 Change in Median Sales Price from Prior Year (6-Month Average)** b a 526 277 498 377 New Listings Closed Sales Year to Date 2016 2017 + 36.1%- 5.3% 111 59 88 80 New Listings Closed Sales June 2016 2017 + 35.6%- 20.7%
- 32. A RESEARCH TOOL PROVIDED BY THE NORTHEAST FLORIDA ASSOCIATION OF REALTORS® 2016 2017 + / – 2016 2017 + / – New Listings 200 172 - 14.0% 1,160 1,076 - 7.2% Closed Sales 176 151 - 14.2% 889 878 - 1.2% Median Sales Price* $154,450 $190,000 + 23.0% $154,000 $170,000 + 10.4% Percent of Original List Price Received* 97.1% 97.4% + 0.3% 95.4% 96.8% + 1.5% Percent of Properties Sold Over List Price* 23.3% 19.9% - 14.6% 18.1% 20.4% + 12.7% Days on Market Until Sale 58 58 0.0% 73 61 - 16.4% Inventory of Homes for Sale 520 311 - 40.2% -- -- -- Months Supply of Inventory 3.5 2.2 - 37.1% -- -- -- Year to Date ** Each dot represents the change in median sales price from the prior year using a 6-month weighted average. This means that each of the 6 months used in a dot are proportioned according to their share of sales during that period. | Current as of July 8, 2017. All data from Northeast Florida Multiple Listing Service. | Powered by ShowingTime 10K. Local Market Update – June 2017 All MLS Orange Park * Does not account for seller concessions. | Activity for one month can sometimes look extreme due to small sample size. Orange Park - 14.0% - 14.2% + 23.0% Change in New Listings Change in Closed Sales Change in Median Sales Price Region 13 June - 20% - 15% - 10% - 5% 0% + 5% + 10% + 15% + 20% + 25% 1-2008 7-2008 1-2009 7-2009 1-2010 7-2010 1-2011 7-2011 1-2012 7-2012 1-2013 7-2013 1-2014 7-2014 1-2015 7-2015 1-2016 7-2016 1-2017 Change in Median Sales Price from Prior Year (6-Month Average)** b a 1,160 889 1,076 878 New Listings Closed Sales Year to Date 2016 2017 - 1.2%- 7.2% 200 176172 151 New Listings Closed Sales June 2016 2017 - 14.2%- 14.0%
- 33. A RESEARCH TOOL PROVIDED BY THE NORTHEAST FLORIDA ASSOCIATION OF REALTORS® 2016 2017 + / – 2016 2017 + / – New Listings 96 119 + 24.0% 654 622 - 4.9% Closed Sales 97 92 - 5.2% 503 482 - 4.2% Median Sales Price* $150,000 $194,950 + 30.0% $164,900 $177,450 + 7.6% Percent of Original List Price Received* 93.1% 96.1% + 3.2% 93.7% 95.5% + 1.9% Percent of Properties Sold Over List Price* 16.5% 18.5% + 12.1% 16.3% 15.6% - 4.3% Days on Market Until Sale 78 60 - 23.1% 86 74 - 14.0% Inventory of Homes for Sale 333 253 - 24.0% -- -- -- Months Supply of Inventory 4.0 3.1 - 22.5% -- -- -- Year to Date ** Each dot represents the change in median sales price from the prior year using a 6-month weighted average. This means that each of the 6 months used in a dot are proportioned according to their share of sales during that period. | Current as of July 8, 2017. All data from Northeast Florida Multiple Listing Service. | Powered by ShowingTime 10K. Local Market Update – June 2017 All MLS Middleburg Vicinity * Does not account for seller concessions. | Activity for one month can sometimes look extreme due to small sample size. Middleburg Vicinity + 24.0% - 5.2% + 30.0% Change in New Listings Change in Closed Sales Change in Median Sales Price Region 14 June - 30% - 20% - 10% 0% + 10% + 20% + 30% + 40% 1-2008 7-2008 1-2009 7-2009 1-2010 7-2010 1-2011 7-2011 1-2012 7-2012 1-2013 7-2013 1-2014 7-2014 1-2015 7-2015 1-2016 7-2016 1-2017 Change in Median Sales Price from Prior Year (6-Month Average)** b a 654 503 622 482 New Listings Closed Sales Year to Date 2016 2017 - 4.2%- 4.9% 96 97 119 92 New Listings Closed Sales June 2016 2017 - 5.2%+ 24.0%
- 34. A RESEARCH TOOL PROVIDED BY THE NORTHEAST FLORIDA ASSOCIATION OF REALTORS® 2016 2017 + / – 2016 2017 + / – New Listings 23 38 + 65.2% 160 172 + 7.5% Closed Sales 19 17 - 10.5% 96 107 + 11.5% Median Sales Price* $106,000 $118,000 + 11.3% $84,950 $98,000 + 15.4% Percent of Original List Price Received* 87.1% 94.3% + 8.3% 90.2% 91.4% + 1.3% Percent of Properties Sold Over List Price* 10.5% 17.6% + 67.6% 11.5% 14.0% + 21.7% Days on Market Until Sale 99 79 - 20.2% 112 98 - 12.5% Inventory of Homes for Sale 135 110 - 18.5% -- -- -- Months Supply of Inventory 8.9 6.5 - 27.0% -- -- -- Year to Date ** Each dot represents the change in median sales price from the prior year using a 6-month weighted average. This means that each of the 6 months used in a dot are proportioned according to their share of sales during that period. | Current as of July 8, 2017. All data from Northeast Florida Multiple Listing Service. | Powered by ShowingTime 10K. Local Market Update – June 2017 All MLS Keystone Heights Vicinity * Does not account for seller concessions. | Activity for one month can sometimes look extreme due to small sample size. Keystone Heights Vicinity + 65.2% - 10.5% + 11.3% Change in New Listings Change in Closed Sales Change in Median Sales Price Region 15 June - 40% - 30% - 20% - 10% 0% + 10% + 20% + 30% + 40% + 50% 1-2008 7-2008 1-2009 7-2009 1-2010 7-2010 1-2011 7-2011 1-2012 7-2012 1-2013 7-2013 1-2014 7-2014 1-2015 7-2015 1-2016 7-2016 1-2017 Change in Median Sales Price from Prior Year (6-Month Average)** b a 160 96 172 107 New Listings Closed Sales Year to Date 2016 2017 + 11.5%+ 7.5% 23 19 38 17 New Listings Closed Sales June 2016 2017 - 10.5%+ 65.2%
- 35. A RESEARCH TOOL PROVIDED BY THE NORTHEAST FLORIDA ASSOCIATION OF REALTORS® 2016 2017 + / – 2016 2017 + / – New Listings 36 31 - 13.9% 189 198 + 4.8% Closed Sales 19 25 + 31.6% 144 134 - 6.9% Median Sales Price* $215,000 $280,000 + 30.2% $205,000 $200,495 - 2.2% Percent of Original List Price Received* 97.0% 95.7% - 1.3% 95.6% 95.9% + 0.3% Percent of Properties Sold Over List Price* 15.8% 16.0% + 1.3% 21.7% 10.4% - 52.1% Days on Market Until Sale 65 57 - 12.3% 95 86 - 9.5% Inventory of Homes for Sale 113 107 - 5.3% -- -- -- Months Supply of Inventory 4.6 4.8 + 4.3% -- -- -- Year to Date ** Each dot represents the change in median sales price from the prior year using a 6-month weighted average. This means that each of the 6 months used in a dot are proportioned according to their share of sales during that period. | Current as of July 8, 2017. All data from Northeast Florida Multiple Listing Service. | Powered by ShowingTime 10K. Local Market Update – June 2017 All MLS Green Cove Springs * Does not account for seller concessions. | Activity for one month can sometimes look extreme due to small sample size. Green Cove Springs - 13.9% + 31.6% + 30.2% Change in New Listings Change in Closed Sales Change in Median Sales Price Region 16 June - 40% - 20% 0% + 20% + 40% + 60% + 80% + 100% + 120% 1-2008 7-2008 1-2009 7-2009 1-2010 7-2010 1-2011 7-2011 1-2012 7-2012 1-2013 7-2013 1-2014 7-2014 1-2015 7-2015 1-2016 7-2016 1-2017 Change in Median Sales Price from Prior Year (6-Month Average)** b a 189 144 198 134 New Listings Closed Sales Year to Date 2016 2017 - 6.9%+ 4.8% 36 19 31 25 New Listings Closed Sales June 2016 2017 + 31.6%- 13.9%
- 36. A RESEARCH TOOL PROVIDED BY THE NORTHEAST FLORIDA ASSOCIATION OF REALTORS® 2016 2017 + / – 2016 2017 + / – New Listings 67 86 + 28.4% 438 500 + 14.2% Closed Sales 60 59 - 1.7% 300 320 + 6.7% Median Sales Price* $334,000 $342,500 + 2.5% $301,200 $355,000 + 17.9% Percent of Original List Price Received* 95.2% 95.4% + 0.2% 94.9% 95.8% + 0.9% Percent of Properties Sold Over List Price* 5.0% 8.5% + 70.0% 7.7% 10.9% + 41.6% Days on Market Until Sale 81 55 - 32.1% 92 64 - 30.4% Inventory of Homes for Sale 210 226 + 7.6% -- -- -- Months Supply of Inventory 3.9 4.6 + 17.9% -- -- -- Year to Date ** Each dot represents the change in median sales price from the prior year using a 6-month weighted average. This means that each of the 6 months used in a dot are proportioned according to their share of sales during that period. | Current as of July 8, 2017. All data from Northeast Florida Multiple Listing Service. | Powered by ShowingTime 10K. Local Market Update – June 2017 All MLS Jacksonville Beach * Does not account for seller concessions. | Activity for one month can sometimes look extreme due to small sample size. Jacksonville Beach + 28.4% - 1.7% + 2.5% Change in New Listings Change in Closed Sales Change in Median Sales Price Region 21 June - 30% - 25% - 20% - 15% - 10% - 5% 0% + 5% + 10% + 15% + 20% + 25% 1-2008 7-2008 1-2009 7-2009 1-2010 7-2010 1-2011 7-2011 1-2012 7-2012 1-2013 7-2013 1-2014 7-2014 1-2015 7-2015 1-2016 7-2016 1-2017 Change in Median Sales Price from Prior Year (6-Month Average)** b a 438 300 500 320 New Listings Closed Sales Year to Date 2016 2017 + 6.7%+ 14.2% 67 60 86 59 New Listings Closed Sales June 2016 2017 - 1.7%+ 28.4%
- 37. A RESEARCH TOOL PROVIDED BY THE NORTHEAST FLORIDA ASSOCIATION OF REALTORS® 2016 2017 + / – 2016 2017 + / – New Listings 15 14 - 6.7% 84 83 - 1.2% Closed Sales 10 9 - 10.0% 54 68 + 25.9% Median Sales Price* $382,000 $362,000 - 5.2% $349,000 $365,000 + 4.6% Percent of Original List Price Received* 95.9% 96.4% + 0.5% 94.8% 94.0% - 0.8% Percent of Properties Sold Over List Price* 10.0% 11.1% + 11.0% 14.8% 11.8% - 20.3% Days on Market Until Sale 39 87 + 123.1% 63 76 + 20.6% Inventory of Homes for Sale 43 36 - 16.3% -- -- -- Months Supply of Inventory 4.5 3.4 - 24.4% -- -- -- Year to Date ** Each dot represents the change in median sales price from the prior year using a 6-month weighted average. This means that each of the 6 months used in a dot are proportioned according to their share of sales during that period. | Current as of July 8, 2017. All data from Northeast Florida Multiple Listing Service. | Powered by ShowingTime 10K. Local Market Update – June 2017 All MLS Neptune Beach * Does not account for seller concessions. | Activity for one month can sometimes look extreme due to small sample size. Neptune Beach - 6.7% - 10.0% - 5.2% Change in New Listings Change in Closed Sales Change in Median Sales Price Region 22 June - 60% - 40% - 20% 0% + 20% + 40% + 60% + 80% 1-2008 7-2008 1-2009 7-2009 1-2010 7-2010 1-2011 7-2011 1-2012 7-2012 1-2013 7-2013 1-2014 7-2014 1-2015 7-2015 1-2016 7-2016 1-2017 Change in Median Sales Price from Prior Year (6-Month Average)** b a 84 54 83 68 New Listings Closed Sales Year to Date 2016 2017 + 25.9%- 1.2% 15 10 14 9 New Listings Closed Sales June 2016 2017 - 10.0%- 6.7%
- 38. A RESEARCH TOOL PROVIDED BY THE NORTHEAST FLORIDA ASSOCIATION OF REALTORS® 2016 2017 + / – 2016 2017 + / – New Listings 45 42 - 6.7% 241 245 + 1.7% Closed Sales 26 36 + 38.5% 158 167 + 5.7% Median Sales Price* $186,000 $324,750 + 74.6% $241,500 $313,750 + 29.9% Percent of Original List Price Received* 95.2% 96.1% + 0.9% 93.9% 95.6% + 1.8% Percent of Properties Sold Over List Price* 15.4% 11.1% - 27.9% 13.9% 15.1% + 8.6% Days on Market Until Sale 52 46 - 11.5% 73 67 - 8.2% Inventory of Homes for Sale 128 112 - 12.5% -- -- -- Months Supply of Inventory 4.8 3.8 - 20.8% -- -- -- Year to Date ** Each dot represents the change in median sales price from the prior year using a 6-month weighted average. This means that each of the 6 months used in a dot are proportioned according to their share of sales during that period. | Current as of July 8, 2017. All data from Northeast Florida Multiple Listing Service. | Powered by ShowingTime 10K. Local Market Update – June 2017 All MLS Atlantic Beach * Does not account for seller concessions. | Activity for one month can sometimes look extreme due to small sample size. Atlantic Beach - 6.7% + 38.5% + 74.6% Change in New Listings Change in Closed Sales Change in Median Sales Price Region 23 June - 40% - 20% 0% + 20% + 40% + 60% + 80% 1-2008 7-2008 1-2009 7-2009 1-2010 7-2010 1-2011 7-2011 1-2012 7-2012 1-2013 7-2013 1-2014 7-2014 1-2015 7-2015 1-2016 7-2016 1-2017 Change in Median Sales Price from Prior Year (6-Month Average)** b a 241 158 245 167 New Listings Closed Sales Year to Date 2016 2017 + 5.7%+ 1.7% 45 26 42 36 New Listings Closed Sales June 2016 2017 + 38.5%- 6.7%
- 39. A RESEARCH TOOL PROVIDED BY THE NORTHEAST FLORIDA ASSOCIATION OF REALTORS® 2016 2017 + / – 2016 2017 + / – New Listings 29 21 - 27.6% 172 188 + 9.3% Closed Sales 24 25 + 4.2% 106 113 + 6.6% Median Sales Price* $707,500 $665,750 - 5.9% $393,750 $675,000 + 71.4% Percent of Original List Price Received* 92.5% 96.0% + 3.8% 93.1% 93.8% + 0.8% Percent of Properties Sold Over List Price* 8.3% 24.0% + 189.2% 6.6% 11.5% + 74.2% Days on Market Until Sale 76 87 + 14.5% 89 90 + 1.1% Inventory of Homes for Sale 120 126 + 5.0% -- -- -- Months Supply of Inventory 7.1 7.6 + 7.0% -- -- -- Year to Date ** Each dot represents the change in median sales price from the prior year using a 6-month weighted average. This means that each of the 6 months used in a dot are proportioned according to their share of sales during that period. | Current as of July 8, 2017. All data from Northeast Florida Multiple Listing Service. | Powered by ShowingTime 10K. Local Market Update – June 2017 All MLS NE St. Johns County – Ponte Vedra Beach North * Does not account for seller concessions. | Activity for one month can sometimes look extreme due to small sample size. NE St. Johns County – Ponte Vedra Beach North - 27.6% + 4.2% - 5.9% Change in New Listings Change in Closed Sales Change in Median Sales Price Region 25 June - 80% - 60% - 40% - 20% 0% + 20% + 40% + 60% + 80% + 100% + 120% + 140% 1-2008 7-2008 1-2009 7-2009 1-2010 7-2010 1-2011 7-2011 1-2012 7-2012 1-2013 7-2013 1-2014 7-2014 1-2015 7-2015 1-2016 7-2016 1-2017 Change in Median Sales Price from Prior Year (6-Month Average)** b a 172 106 188 113 New Listings Closed Sales Year to Date 2016 2017 + 6.6%+ 9.3% 29 24 21 25 New Listings Closed Sales June 2016 2017 + 4.2%- 27.6%
- 40. A RESEARCH TOOL PROVIDED BY THE NORTHEAST FLORIDA ASSOCIATION OF REALTORS® 2016 2017 + / – 2016 2017 + / – New Listings 94 96 + 2.1% 644 598 - 7.1% Closed Sales 65 66 + 1.5% 311 347 + 11.6% Median Sales Price* $485,000 $437,450 - 9.8% $412,000 $472,000 + 14.6% Percent of Original List Price Received* 94.5% 94.5% 0.0% 93.6% 94.9% + 1.4% Percent of Properties Sold Over List Price* 7.7% 4.5% - 41.6% 5.1% 8.9% + 74.5% Days on Market Until Sale 100 93 - 7.0% 100 93 - 7.0% Inventory of Homes for Sale 476 354 - 25.6% -- -- -- Months Supply of Inventory 9.2 6.1 - 33.7% -- -- -- Year to Date ** Each dot represents the change in median sales price from the prior year using a 6-month weighted average. This means that each of the 6 months used in a dot are proportioned according to their share of sales during that period. | Current as of July 8, 2017. All data from Northeast Florida Multiple Listing Service. | Powered by ShowingTime 10K. Local Market Update – June 2017 All MLS Ponte Vedra Bch / S Ponte Vedra Beach / Vilano Bch / Palm Valley * Does not account for seller concessions. | Activity for one month can sometimes look extreme due to small sample size. Ponte Vedra Bch / S Ponte Vedra Beach / Vilano Bch / Palm Valley + 2.1% + 1.5% - 9.8% Change in New Listings Change in Closed Sales Change in Median Sales Price Region 26 June - 40% - 30% - 20% - 10% 0% + 10% + 20% + 30% 1-2008 7-2008 1-2009 7-2009 1-2010 7-2010 1-2011 7-2011 1-2012 7-2012 1-2013 7-2013 1-2014 7-2014 1-2015 7-2015 1-2016 7-2016 1-2017 Change in Median Sales Price from Prior Year (6-Month Average)** b a 644 311 598 347 New Listings Closed Sales Year to Date 2016 2017 + 11.6%- 7.1% 94 65 96 66 New Listings Closed Sales June 2016 2017 + 1.5%+ 2.1%
- 41. A RESEARCH TOOL PROVIDED BY THE NORTHEAST FLORIDA ASSOCIATION OF REALTORS® 2016 2017 + / – 2016 2017 + / – New Listings 135 83 - 38.5% 614 497 - 19.1% Closed Sales 105 93 - 11.4% 409 386 - 5.6% Median Sales Price* $386,375 $406,500 + 5.2% $376,944 $375,000 - 0.5% Percent of Original List Price Received* 97.5% 97.7% + 0.2% 98.7% 97.9% - 0.8% Percent of Properties Sold Over List Price* 17.1% 9.7% - 43.3% 23.8% 12.4% - 47.9% Days on Market Until Sale 72 94 + 30.6% 58 101 + 74.1% Inventory of Homes for Sale 280 193 - 31.1% -- -- -- Months Supply of Inventory 4.0 2.8 - 30.0% -- -- -- Year to Date ** Each dot represents the change in median sales price from the prior year using a 6-month weighted average. This means that each of the 6 months used in a dot are proportioned according to their share of sales during that period. | Current as of July 8, 2017. All data from Northeast Florida Multiple Listing Service. | Powered by ShowingTime 10K. Local Market Update – June 2017 All MLS Ponte Vedra / Nocatee (St. Johns County) * Does not account for seller concessions. | Activity for one month can sometimes look extreme due to small sample size. Ponte Vedra / Nocatee (St. Johns County) - 38.5% - 11.4% + 5.2% Change in New Listings Change in Closed Sales Change in Median Sales Price Region 27 June - 30% - 20% - 10% 0% + 10% + 20% + 30% + 40% 1-2008 7-2008 1-2009 7-2009 1-2010 7-2010 1-2011 7-2011 1-2012 7-2012 1-2013 7-2013 1-2014 7-2014 1-2015 7-2015 1-2016 7-2016 1-2017 Change in Median Sales Price from Prior Year (6-Month Average)** b a 614 409 497 386 New Listings Closed Sales Year to Date 2016 2017 - 5.6%- 19.1% 135 105 83 93 New Listings Closed Sales June 2016 2017 - 11.4%- 38.5%
- 42. A RESEARCH TOOL PROVIDED BY THE NORTHEAST FLORIDA ASSOCIATION OF REALTORS® 2016 2017 + / – 2016 2017 + / – New Listings 344 296 - 14.0% 1,996 1,936 - 3.0% Closed Sales 325 259 - 20.3% 1,286 1,332 + 3.6% Median Sales Price* $292,922 $308,000 + 5.1% $280,000 $293,750 + 4.9% Percent of Original List Price Received* 96.8% 96.6% - 0.2% 96.3% 96.3% 0.0% Percent of Properties Sold Over List Price* 17.2% 8.9% - 48.3% 17.2% 11.6% - 32.6% Days on Market Until Sale 69 81 + 17.4% 78 86 + 10.3% Inventory of Homes for Sale 972 857 - 11.8% -- -- -- Months Supply of Inventory 4.8 3.9 - 18.8% -- -- -- Year to Date ** Each dot represents the change in median sales price from the prior year using a 6-month weighted average. This means that each of the 6 months used in a dot are proportioned according to their share of sales during that period. | Current as of July 8, 2017. All data from Northeast Florida Multiple Listing Service. | Powered by ShowingTime 10K. Local Market Update – June 2017 All MLS St. Johns County - NW * Does not account for seller concessions. | Activity for one month can sometimes look extreme due to small sample size. St. Johns County - NW - 14.0% - 20.3% + 5.1% Change in New Listings Change in Closed Sales Change in Median Sales Price Region 30 June - 20% - 15% - 10% - 5% 0% + 5% + 10% + 15% + 20% 1-2008 7-2008 1-2009 7-2009 1-2010 7-2010 1-2011 7-2011 1-2012 7-2012 1-2013 7-2013 1-2014 7-2014 1-2015 7-2015 1-2016 7-2016 1-2017 Change in Median Sales Price from Prior Year (6-Month Average)** b a 1,996 1,286 1,936 1,332 New Listings Closed Sales Year to Date 2016 2017 + 3.6%- 3.0% 344 325 296 259 New Listings Closed Sales June 2016 2017 - 20.3%- 14.0%
- 43. A RESEARCH TOOL PROVIDED BY THE NORTHEAST FLORIDA ASSOCIATION OF REALTORS® 2016 2017 + / – 2016 2017 + / – New Listings 47 44 - 6.4% 248 266 + 7.3% Closed Sales 41 38 - 7.3% 174 150 - 13.8% Median Sales Price* $338,000 $393,200 + 16.3% $352,950 $393,340 + 11.4% Percent of Original List Price Received* 96.6% 94.3% - 2.4% 96.5% 95.2% - 1.3% Percent of Properties Sold Over List Price* 12.2% 13.2% + 8.2% 10.9% 8.7% - 20.2% Days on Market Until Sale 111 74 - 33.3% 111 106 - 4.5% Inventory of Homes for Sale 182 153 - 15.9% -- -- -- Months Supply of Inventory 6.8 5.8 - 14.7% -- -- -- Year to Date ** Each dot represents the change in median sales price from the prior year using a 6-month weighted average. This means that each of the 6 months used in a dot are proportioned according to their share of sales during that period. | Current as of July 8, 2017. All data from Northeast Florida Multiple Listing Service. | Powered by ShowingTime 10K. Local Market Update – June 2017 All MLS St. Johns County - NE * Does not account for seller concessions. | Activity for one month can sometimes look extreme due to small sample size. St. Johns County - NE - 6.4% - 7.3% + 16.3% Change in New Listings Change in Closed Sales Change in Median Sales Price Region 31 June - 50% - 40% - 30% - 20% - 10% 0% + 10% + 20% + 30% + 40% + 50% 1-2008 7-2008 1-2009 7-2009 1-2010 7-2010 1-2011 7-2011 1-2012 7-2012 1-2013 7-2013 1-2014 7-2014 1-2015 7-2015 1-2016 7-2016 1-2017 Change in Median Sales Price from Prior Year (6-Month Average)** b a 248 174 266 150 New Listings Closed Sales Year to Date 2016 2017 - 13.8%+ 7.3% 47 41 44 38 New Listings Closed Sales June 2016 2017 - 7.3%- 6.4%
- 44. A RESEARCH TOOL PROVIDED BY THE NORTHEAST FLORIDA ASSOCIATION OF REALTORS® 2016 2017 + / – 2016 2017 + / – New Listings 17 24 + 41.2% 115 104 - 9.6% Closed Sales 10 15 + 50.0% 71 54 - 23.9% Median Sales Price* $303,000 $274,000 - 9.6% $265,000 $315,000 + 18.9% Percent of Original List Price Received* 91.7% 90.9% - 0.9% 91.8% 91.8% 0.0% Percent of Properties Sold Over List Price* 0.0% 6.7% -- 4.2% 7.4% + 76.2% Days on Market Until Sale 87 107 + 23.0% 114 129 + 13.2% Inventory of Homes for Sale 104 87 - 16.3% -- -- -- Months Supply of Inventory 9.9 8.6 - 13.1% -- -- -- Year to Date ** Each dot represents the change in median sales price from the prior year using a 6-month weighted average. This means that each of the 6 months used in a dot are proportioned according to their share of sales during that period. | Current as of July 8, 2017. All data from Northeast Florida Multiple Listing Service. | Powered by ShowingTime 10K. Local Market Update – June 2017 All MLS St. Johns County - St. Augustine Area - East of US 1 * Does not account for seller concessions. | Activity for one month can sometimes look extreme due to small sample size. St. Johns County - St. Augustine Area - East of US 1 + 41.2% + 50.0% - 9.6% Change in New Listings Change in Closed Sales Change in Median Sales Price Region 32 June - 60% - 40% - 20% 0% + 20% + 40% + 60% + 80% 1-2008 7-2008 1-2009 7-2009 1-2010 7-2010 1-2011 7-2011 1-2012 7-2012 1-2013 7-2013 1-2014 7-2014 1-2015 7-2015 1-2016 7-2016 1-2017 Change in Median Sales Price from Prior Year (6-Month Average)** b a 115 71 104 54 New Listings Closed Sales Year to Date 2016 2017 - 23.9%- 9.6% 17 10 24 15 New Listings Closed Sales June 2016 2017 + 50.0%+ 41.2%
- 45. A RESEARCH TOOL PROVIDED BY THE NORTHEAST FLORIDA ASSOCIATION OF REALTORS® 2016 2017 + / – 2016 2017 + / – New Listings 124 146 + 17.7% 822 861 + 4.7% Closed Sales 100 110 + 10.0% 527 551 + 4.6% Median Sales Price* $237,950 $241,500 + 1.5% $216,990 $238,245 + 9.8% Percent of Original List Price Received* 93.8% 96.5% + 2.9% 94.9% 95.3% + 0.4% Percent of Properties Sold Over List Price* 2.0% 7.3% + 265.0% 6.5% 8.9% + 36.9% Days on Market Until Sale 85 82 - 3.5% 91 92 + 1.1% Inventory of Homes for Sale 495 437 - 11.7% -- -- -- Months Supply of Inventory 5.7 4.5 - 21.1% -- -- -- Year to Date ** Each dot represents the change in median sales price from the prior year using a 6-month weighted average. This means that each of the 6 months used in a dot are proportioned according to their share of sales during that period. | Current as of July 8, 2017. All data from Northeast Florida Multiple Listing Service. | Powered by ShowingTime 10K. Local Market Update – June 2017 All MLS St. Johns County - SE * Does not account for seller concessions. | Activity for one month can sometimes look extreme due to small sample size. St. Johns County - SE + 17.7% + 10.0% + 1.5% Change in New Listings Change in Closed Sales Change in Median Sales Price Region 33 June - 30% - 20% - 10% 0% + 10% + 20% + 30% 1-2008 7-2008 1-2009 7-2009 1-2010 7-2010 1-2011 7-2011 1-2012 7-2012 1-2013 7-2013 1-2014 7-2014 1-2015 7-2015 1-2016 7-2016 1-2017 Change in Median Sales Price from Prior Year (6-Month Average)** b a 822 527 861 551 New Listings Closed Sales Year to Date 2016 2017 + 4.6%+ 4.7% 124 100 146 110 New Listings Closed Sales June 2016 2017 + 10.0%+ 17.7%
- 46. A RESEARCH TOOL PROVIDED BY THE NORTHEAST FLORIDA ASSOCIATION OF REALTORS® 2016 2017 + / – 2016 2017 + / – New Listings 18 20 + 11.1% 92 84 - 8.7% Closed Sales 8 7 - 12.5% 50 49 - 2.0% Median Sales Price* $221,375 $153,500 - 30.7% $144,000 $199,500 + 38.5% Percent of Original List Price Received* 89.3% 99.8% + 11.8% 91.5% 97.5% + 6.6% Percent of Properties Sold Over List Price* 25.0% 57.1% + 128.4% 14.0% 28.6% + 104.3% Days on Market Until Sale 115 47 - 59.1% 91 75 - 17.6% Inventory of Homes for Sale 65 46 - 29.2% -- -- -- Months Supply of Inventory 7.7 5.1 - 33.8% -- -- -- Year to Date ** Each dot represents the change in median sales price from the prior year using a 6-month weighted average. This means that each of the 6 months used in a dot are proportioned according to their share of sales during that period. | Current as of July 8, 2017. All data from Northeast Florida Multiple Listing Service. | Powered by ShowingTime 10K. Local Market Update – June 2017 All MLS St. Johns County - SW * Does not account for seller concessions. | Activity for one month can sometimes look extreme due to small sample size. St. Johns County - SW + 11.1% - 12.5% - 30.7% Change in New Listings Change in Closed Sales Change in Median Sales Price Region 34 June - 100% - 50% 0% + 50% + 100% + 150% + 200% 1-2008 7-2008 1-2009 7-2009 1-2010 7-2010 1-2011 7-2011 1-2012 7-2012 1-2013 7-2013 1-2014 7-2014 1-2015 7-2015 1-2016 7-2016 1-2017 Change in Median Sales Price from Prior Year (6-Month Average)** b a 92 50 84 49 New Listings Closed Sales Year to Date 2016 2017 - 2.0%- 8.7% 18 8 20 7 New Listings Closed Sales June 2016 2017 - 12.5%+ 11.1%
- 47. A RESEARCH TOOL PROVIDED BY THE NORTHEAST FLORIDA ASSOCIATION OF REALTORS® 2016 2017 + / – 2016 2017 + / – New Listings 46 52 + 13.0% 264 285 + 8.0% Closed Sales 33 48 + 45.5% 179 207 + 15.6% Median Sales Price* $75,000 $71,550 - 4.6% $64,900 $83,000 + 27.9% Percent of Original List Price Received* 87.3% 92.1% + 5.5% 86.8% 89.7% + 3.3% Percent of Properties Sold Over List Price* 12.1% 16.7% + 38.0% 12.8% 12.6% - 1.6% Days on Market Until Sale 147 77 - 47.6% 111 121 + 9.0% Inventory of Homes for Sale 248 184 - 25.8% -- -- -- Months Supply of Inventory 7.6 5.3 - 30.3% -- -- -- Year to Date ** Each dot represents the change in median sales price from the prior year using a 6-month weighted average. This means that each of the 6 months used in a dot are proportioned according to their share of sales during that period. | Current as of July 8, 2017. All data from Northeast Florida Multiple Listing Service. | Powered by ShowingTime 10K. Local Market Update – June 2017 All MLS Putnam County NE * Does not account for seller concessions. | Activity for one month can sometimes look extreme due to small sample size. Putnam County NE + 13.0% + 45.5% - 4.6% Change in New Listings Change in Closed Sales Change in Median Sales Price Region 56 June - 40% - 30% - 20% - 10% 0% + 10% + 20% + 30% + 40% + 50% + 60% 1-2008 7-2008 1-2009 7-2009 1-2010 7-2010 1-2011 7-2011 1-2012 7-2012 1-2013 7-2013 1-2014 7-2014 1-2015 7-2015 1-2016 7-2016 1-2017 Change in Median Sales Price from Prior Year (6-Month Average)** b a 264 179 285 207 New Listings Closed Sales Year to Date 2016 2017 + 15.6%+ 8.0% 46 33 52 48 New Listings Closed Sales June 2016 2017 + 45.5%+ 13.0%
- 48. A RESEARCH TOOL PROVIDED BY THE NORTHEAST FLORIDA ASSOCIATION OF REALTORS® 2016 2017 + / – 2016 2017 + / – New Listings 30 26 - 13.3% 180 172 - 4.4% Closed Sales 16 23 + 43.8% 120 130 + 8.3% Median Sales Price* $87,450 $100,000 + 14.4% $45,000 $60,000 + 33.3% Percent of Original List Price Received* 89.7% 88.6% - 1.2% 85.7% 89.3% + 4.2% Percent of Properties Sold Over List Price* 6.3% 8.7% + 38.1% 10.2% 11.8% + 15.7% Days on Market Until Sale 184 89 - 51.6% 137 133 - 2.9% Inventory of Homes for Sale 169 120 - 29.0% -- -- -- Months Supply of Inventory 8.0 5.7 - 28.8% -- -- -- Year to Date ** Each dot represents the change in median sales price from the prior year using a 6-month weighted average. This means that each of the 6 months used in a dot are proportioned according to their share of sales during that period. | Current as of July 8, 2017. All data from Northeast Florida Multiple Listing Service. | Powered by ShowingTime 10K. Local Market Update – June 2017 All MLS Putnam County - West * Does not account for seller concessions. | Activity for one month can sometimes look extreme due to small sample size. Putnam County - West - 13.3% + 43.8% + 14.4% Change in New Listings Change in Closed Sales Change in Median Sales Price Region 57 June - 60% - 40% - 20% 0% + 20% + 40% + 60% + 80% 1-2008 7-2008 1-2009 7-2009 1-2010 7-2010 1-2011 7-2011 1-2012 7-2012 1-2013 7-2013 1-2014 7-2014 1-2015 7-2015 1-2016 7-2016 1-2017 Change in Median Sales Price from Prior Year (6-Month Average)** b a 180 120 172 130 New Listings Closed Sales Year to Date 2016 2017 + 8.3%- 4.4% 30 16 26 23 New Listings Closed Sales June 2016 2017 + 43.8%- 13.3%
- 49. A RESEARCH TOOL PROVIDED BY THE NORTHEAST FLORIDA ASSOCIATION OF REALTORS® 2016 2017 + / – 2016 2017 + / – New Listings 39 21 - 46.2% 205 191 - 6.8% Closed Sales 27 28 + 3.7% 146 146 0.0% Median Sales Price* $80,000 $60,250 - 24.7% $59,900 $64,250 + 7.3% Percent of Original List Price Received* 86.0% 91.7% + 6.6% 86.6% 88.6% + 2.3% Percent of Properties Sold Over List Price* 0.0% 14.3% -- 9.7% 7.5% - 22.7% Days on Market Until Sale 163 83 - 49.1% 147 122 - 17.0% Inventory of Homes for Sale 184 128 - 30.4% -- -- -- Months Supply of Inventory 8.1 5.3 - 34.6% -- -- -- Year to Date ** Each dot represents the change in median sales price from the prior year using a 6-month weighted average. This means that each of the 6 months used in a dot are proportioned according to their share of sales during that period. | Current as of July 8, 2017. All data from Northeast Florida Multiple Listing Service. | Powered by ShowingTime 10K. Local Market Update – June 2017 All MLS Putnam County - South * Does not account for seller concessions. | Activity for one month can sometimes look extreme due to small sample size. Putnam County - South - 46.2% + 3.7% - 24.7% Change in New Listings Change in Closed Sales Change in Median Sales Price Region 58 June - 60% - 40% - 20% 0% + 20% + 40% + 60% 1-2008 7-2008 1-2009 7-2009 1-2010 7-2010 1-2011 7-2011 1-2012 7-2012 1-2013 7-2013 1-2014 7-2014 1-2015 7-2015 1-2016 7-2016 1-2017 Change in Median Sales Price from Prior Year (6-Month Average)** b a 205 146 191 146 New Listings Closed Sales Year to Date 2016 2017 0.0%- 6.8% 39 27 21 28 New Listings Closed Sales June 2016 2017 + 3.7%- 46.2%
- 50. A RESEARCH TOOL PROVIDED BY THE NORTHEAST FLORIDA ASSOCIATION OF REALTORS® 2016 2017 + / – 2016 2017 + / – New Listings 29 25 - 13.8% 148 148 0.0% Closed Sales 29 23 - 20.7% 101 122 + 20.8% Median Sales Price* $121,500 $133,000 + 9.5% $132,000 $142,500 + 8.0% Percent of Original List Price Received* 96.3% 96.1% - 0.2% 91.0% 94.6% + 4.0% Percent of Properties Sold Over List Price* 25.0% 13.0% - 48.0% 14.1% 18.0% + 27.7% Days on Market Until Sale 79 83 + 5.1% 116 80 - 31.0% Inventory of Homes for Sale 89 68 - 23.6% -- -- -- Months Supply of Inventory 4.8 3.5 - 27.1% -- -- -- Year to Date ** Each dot represents the change in median sales price from the prior year using a 6-month weighted average. This means that each of the 6 months used in a dot are proportioned according to their share of sales during that period. | Current as of July 8, 2017. All data from Northeast Florida Multiple Listing Service. | Powered by ShowingTime 10K. Local Market Update – June 2017 All MLS Baker County * Does not account for seller concessions. | Activity for one month can sometimes look extreme due to small sample size. Baker County - 13.8% - 20.7% + 9.5% Change in New Listings Change in Closed Sales Change in Median Sales Price June - 40% - 30% - 20% - 10% 0% + 10% + 20% + 30% + 40% 1-2008 7-2008 1-2009 7-2009 1-2010 7-2010 1-2011 7-2011 1-2012 7-2012 1-2013 7-2013 1-2014 7-2014 1-2015 7-2015 1-2016 7-2016 1-2017 Change in Median Sales Price from Prior Year (6-Month Average)** b a 148 101 148 122 New Listings Closed Sales Year to Date 2016 2017 + 20.8%0.0% 29 29 25 23 New Listings Closed Sales June 2016 2017 - 20.7%- 13.8%
- 51. A RESEARCH TOOL PROVIDED BY THE NORTHEAST FLORIDA ASSOCIATION OF REALTORS® 2016 2017 + / – 2016 2017 + / – New Listings 458 447 - 2.4% 2,648 2,549 - 3.7% Closed Sales 364 363 - 0.3% 1,883 1,964 + 4.3% Median Sales Price* $160,000 $209,000 + 30.6% $165,000 $185,000 + 12.1% Percent of Original List Price Received* 95.4% 96.7% + 1.4% 94.7% 95.9% + 1.3% Percent of Properties Sold Over List Price* 18.4% 19.0% + 3.3% 16.6% 16.9% + 1.8% Days on Market Until Sale 70 59 - 15.7% 80 72 - 10.0% Inventory of Homes for Sale 1,345 948 - 29.5% -- -- -- Months Supply of Inventory 4.2 3.0 - 28.6% -- -- -- Year to Date ** Each dot represents the change in median sales price from the prior year using a 6-month weighted average. This means that each of the 6 months used in a dot are proportioned according to their share of sales during that period. | Current as of July 8, 2017. All data from Northeast Florida Multiple Listing Service. | Powered by ShowingTime 10K. Local Market Update – June 2017 All MLS Clay County * Does not account for seller concessions. | Activity for one month can sometimes look extreme due to small sample size. Clay County - 2.4% - 0.3% + 30.6% Change in New Listings Change in Closed Sales Change in Median Sales Price June - 20% - 15% - 10% - 5% 0% + 5% + 10% + 15% + 20% 1-2008 7-2008 1-2009 7-2009 1-2010 7-2010 1-2011 7-2011 1-2012 7-2012 1-2013 7-2013 1-2014 7-2014 1-2015 7-2015 1-2016 7-2016 1-2017 Change in Median Sales Price from Prior Year (6-Month Average)** b a 2,648 1,883 2,549 1,964 New Listings Closed Sales Year to Date 2016 2017 + 4.3%- 3.7% 458 364 447 363 New Listings Closed Sales June 2016 2017 - 0.3%- 2.4%
- 52. A RESEARCH TOOL PROVIDED BY THE NORTHEAST FLORIDA ASSOCIATION OF REALTORS® 2016 2017 + / – 2016 2017 + / – New Listings 1,899 1,898 - 0.1% 10,874 10,750 - 1.1% Closed Sales 1,588 1,440 - 9.3% 7,867 7,862 - 0.1% Median Sales Price* $170,000 $189,000 + 11.2% $160,000 $176,250 + 10.2% Percent of Original List Price Received* 95.7% 95.9% + 0.2% 94.9% 95.5% + 0.6% Percent of Properties Sold Over List Price* 17.0% 17.0% 0.0% 17.5% 15.5% - 11.4% Days on Market Until Sale 64 58 - 9.4% 72 66 - 8.3% Inventory of Homes for Sale 5,014 3,956 - 21.1% -- -- -- Months Supply of Inventory 3.8 3.0 - 21.1% -- -- -- Year to Date ** Each dot represents the change in median sales price from the prior year using a 6-month weighted average. This means that each of the 6 months used in a dot are proportioned according to their share of sales during that period. | Current as of July 8, 2017. All data from Northeast Florida Multiple Listing Service. | Powered by ShowingTime 10K. Local Market Update – June 2017 All MLS Duval County * Does not account for seller concessions. | Activity for one month can sometimes look extreme due to small sample size. Duval County - 0.1% - 9.3% + 11.2% Change in New Listings Change in Closed Sales Change in Median Sales Price June - 25% - 20% - 15% - 10% - 5% 0% + 5% + 10% + 15% + 20% + 25% 1-2008 7-2008 1-2009 7-2009 1-2010 7-2010 1-2011 7-2011 1-2012 7-2012 1-2013 7-2013 1-2014 7-2014 1-2015 7-2015 1-2016 7-2016 1-2017 Change in Median Sales Price from Prior Year (6-Month Average)** b a 10,874 7,867 10,750 7,862 New Listings Closed Sales Year to Date 2016 2017 - 0.1%- 1.1% 1,899 1,588 1,898 1,440 New Listings Closed Sales June 2016 2017 - 9.3%- 0.1%
- 53. A RESEARCH TOOL PROVIDED BY THE NORTHEAST FLORIDA ASSOCIATION OF REALTORS® 2016 2017 + / – 2016 2017 + / – New Listings 98 127 + 29.6% 731 676 - 7.5% Closed Sales 119 87 - 26.9% 579 500 - 13.6% Median Sales Price* $210,000 $215,000 + 2.4% $204,615 $220,950 + 8.0% Percent of Original List Price Received* 94.5% 95.1% + 0.6% 94.8% 95.3% + 0.5% Percent of Properties Sold Over List Price* 25.2% 6.9% - 72.6% 23.1% 13.4% - 42.0% Days on Market Until Sale 88 95 + 8.0% 91 104 + 14.3% Inventory of Homes for Sale 455 351 - 22.9% -- -- -- Months Supply of Inventory 4.9 4.1 - 16.3% -- -- -- Year to Date ** Each dot represents the change in median sales price from the prior year using a 6-month weighted average. This means that each of the 6 months used in a dot are proportioned according to their share of sales during that period. | Current as of July 8, 2017. All data from Northeast Florida Multiple Listing Service. | Powered by ShowingTime 10K. Local Market Update – June 2017 All MLS Nassau County * Does not account for seller concessions. | Activity for one month can sometimes look extreme due to small sample size. Nassau County + 29.6% - 26.9% + 2.4% Change in New Listings Change in Closed Sales Change in Median Sales Price June - 25% - 20% - 15% - 10% - 5% 0% + 5% + 10% + 15% + 20% + 25% 1-2008 7-2008 1-2009 7-2009 1-2010 7-2010 1-2011 7-2011 1-2012 7-2012 1-2013 7-2013 1-2014 7-2014 1-2015 7-2015 1-2016 7-2016 1-2017 Change in Median Sales Price from Prior Year (6-Month Average)** b a 731 579 676 500 New Listings Closed Sales Year to Date 2016 2017 - 13.6%- 7.5% 98 119 127 87 New Listings Closed Sales June 2016 2017 - 26.9%+ 29.6%
- 54. A RESEARCH TOOL PROVIDED BY THE NORTHEAST FLORIDA ASSOCIATION OF REALTORS® 2016 2017 + / – 2016 2017 + / – New Listings 115 100 - 13.0% 649 648 - 0.2% Closed Sales 77 99 + 28.6% 446 482 + 8.1% Median Sales Price* $79,000 $70,100 - 11.3% $58,000 $73,000 + 25.9% Percent of Original List Price Received* 87.4% 91.2% + 4.3% 86.5% 89.2% + 3.1% Percent of Properties Sold Over List Price* 6.5% 14.1% + 116.9% 11.1% 10.6% - 4.5% Days on Market Until Sale 161 81 - 49.7% 130 125 - 3.8% Inventory of Homes for Sale 603 432 - 28.4% -- -- -- Months Supply of Inventory 7.9 5.4 - 31.6% -- -- -- Year to Date ** Each dot represents the change in median sales price from the prior year using a 6-month weighted average. This means that each of the 6 months used in a dot are proportioned according to their share of sales during that period. | Current as of July 8, 2017. All data from Northeast Florida Multiple Listing Service. | Powered by ShowingTime 10K. Local Market Update – June 2017 All MLS Putnam County * Does not account for seller concessions. | Activity for one month can sometimes look extreme due to small sample size. Putnam County - 13.0% + 28.6% - 11.3% Change in New Listings Change in Closed Sales Change in Median Sales Price June - 40% - 30% - 20% - 10% 0% + 10% + 20% + 30% + 40% + 50% + 60% 1-2008 7-2008 1-2009 7-2009 1-2010 7-2010 1-2011 7-2011 1-2012 7-2012 1-2013 7-2013 1-2014 7-2014 1-2015 7-2015 1-2016 7-2016 1-2017 Change in Median Sales Price from Prior Year (6-Month Average)** b a 649 446 648 482 New Listings Closed Sales Year to Date 2016 2017 + 8.1%- 0.2% 115 77 100 99 New Listings Closed Sales June 2016 2017 + 28.6%- 13.0%
- 55. A RESEARCH TOOL PROVIDED BY THE NORTHEAST FLORIDA ASSOCIATION OF REALTORS® 2016 2017 + / – 2016 2017 + / – New Listings 796 723 - 9.2% 4,659 4,491 - 3.6% Closed Sales 676 608 - 10.1% 2,923 2,953 + 1.0% Median Sales Price* $309,945 $324,900 + 4.8% $295,000 $310,000 + 5.1% Percent of Original List Price Received* 95.9% 96.2% + 0.3% 95.8% 96.0% + 0.2% Percent of Properties Sold Over List Price* 13.3% 9.7% - 27.1% 13.9% 11.0% - 20.9% Days on Market Until Sale 78 85 + 9.0% 84 92 + 9.5% Inventory of Homes for Sale 2,666 2,235 - 16.2% -- -- -- Months Supply of Inventory 5.6 4.4 - 21.4% -- -- -- Year to Date ** Each dot represents the change in median sales price from the prior year using a 6-month weighted average. This means that each of the 6 months used in a dot are proportioned according to their share of sales during that period. | Current as of July 8, 2017. All data from Northeast Florida Multiple Listing Service. | Powered by ShowingTime 10K. Local Market Update – June 2017 All MLS St. Johns County * Does not account for seller concessions. | Activity for one month can sometimes look extreme due to small sample size. St. Johns County - 9.2% - 10.1% + 4.8% Change in New Listings Change in Closed Sales Change in Median Sales Price June - 25% - 20% - 15% - 10% - 5% 0% + 5% + 10% + 15% + 20% 1-2008 7-2008 1-2009 7-2009 1-2010 7-2010 1-2011 7-2011 1-2012 7-2012 1-2013 7-2013 1-2014 7-2014 1-2015 7-2015 1-2016 7-2016 1-2017 Change in Median Sales Price from Prior Year (6-Month Average)** b a 4,659 2,923 4,491 2,953 New Listings Closed Sales Year to Date 2016 2017 + 1.0%- 3.6% 796 676723 608 New Listings Closed Sales June 2016 2017 - 10.1%- 9.2%