Blake Lapthorn's south coast green breakfast - the changing landscape of renewables
•Transferir como PPT, PDF•
0 gostou•279 visualizações

The document discusses the changing landscape of renewable energy sources. It covers topics like past and present renewable technologies, trends towards the future, and considerations for what the future may hold. Specific areas discussed include the feed-in tariff mix over time, predicting future deployment, the renewable heat incentive, and considerations around wind turbine choice, aviation impacts, grid connection costs, and project financing.

Recomendados
Recomendados
Mais conteúdo relacionado
Destaque
Destaque (7)
Semelhante a Blake Lapthorn's south coast green breakfast - the changing landscape of renewables
Semelhante a Blake Lapthorn's south coast green breakfast - the changing landscape of renewables (20)
Mais de Blake Morgan
Mais de Blake Morgan (20)
Último
Último (20)
Blake Lapthorn's south coast green breakfast - the changing landscape of renewables
- 1. The Changing Landscape of Renewables Gregory Dix May 2012
- 2. The Changing Landscape of Renewables • Past and Present • Towards the Future • The Present • What the future might hold
- 11. Now
- 12. Considerations
- 13. Now and Solar 11th Dec Deadline 3rd March Deadline 1st April Deadline
- 14. The FiT Mix 1,200,000 1,000,000 800,000 MicroCHP pilot 600,000 Anaerobic digestion Hydro 400,000 Wind W n p d e a k y c s t ) ( I i l 200,000 Photovoltaics 0 Q2 Q3 Q4 Q1 Q2 Q3 Q4 Q1 Quarter (2010) Quarter (2011) Quarter (2012)
- 16. The RHI
- 17. Summary • Past and Present • Towards the Future • The Present • What the future might hold
- 18. If I have the time.........
- 19. Considerations in Wind Deployment in Detail • Wind Turbines The correct choice of turbine will be critical to project viability.
- 20. Considerations • Wind Turbines The correct choice of turbine will be critical to project viability. Does the turbine have a track history? Does the turbine have “real” not “theoretical” demonstrated outputs? Is the turbine manufacture solvent? Is the turbine bankable? What time scales for delivery? Can the manufacture provide localised service? What warranty levels available/ and O&M contracts?
- 21. Considerations • Aviation 5% of projects have significant aviation issues resulting in project failure 20% have adverse aviation issues which could result in project failure Who might object: MoD, RAF, NATS, CAA, unlicenced aerodromes Don’t forget telecommunication operators. Less of a problem as normally line of site, but on smaller projects could be a show stopper.
- 22. Considerations • Grid 30% of projects are not financially viable due to excessive grid costs 20% of projects have significant grid connection costs Most projects will require as a minimum a 3 phase supply connection point or 3 wire 11kV HV, larger developments will require 33kV. Capital costs of upgrading 11kV/33kV line or switchgear/bus bars in substations can be significant. Easements or wayleaves with 3rd parties can take a long time to resolve.
- 23. Considerations P90 P50 • Finance Project based finance or asset based? Gearing Capacity Factor = ratio of actual output vs Due Diligence/ Risk theoretical max output over a period of time 27% 30% Power Generation
- 24. Summary • Viability vs Feasibility All projects are feasible, but many are not viable • Wind Turbines What are you buying? • Aviation Check early • Grid Check early • Finance Don’t over gear and check your turbine project will be bankable
Notas do Editor
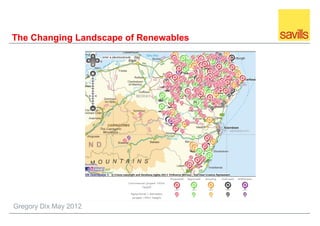
- This map of Aberdeenshire (put together by an anti wind group) shows the level of proposed wind developments (some 900 all told, both big commercial wind turbines and smaller domestic). How different would this same picture have been 10 years ago and how different will it be 10 years hence?
- As my first slide just illustrated, the renewables industry and the landscape it occupies in the broadest sense of the word has changed significantly in the last 10 years We have had the introduction of ROCs, then FiTs and now the RHI. I want to cover in this talk this morning a little bit of the past, where we are now and where we might go in the future. I would like you to come away with a better understanding of the complications of renewables (not just the difficulties of implementing a scheme, but the more subjective issues and risks around financial support and how Govt and DECC react to changes)
- Technology in renewables plays a vital part. Our ability to harness the wind to create power (whether mechanical or electrical is not in doubt), but our ability to do so as effeciently as possible and against the backdrop of economic costs of development still means that we are unable to generate renewable energy at a similar comparative cost to that of more tradditional fossil fuel generation.
- However Advances in technology do allow us now to deploy renewable generating stations in places that would previously have been unsuitable for deployment of more traditional technologies s in the case of this archemedies micro hydro station even allow the safe passage of aquatic life.
- Some technologies we can even look to develop ourselves as this DIY solar thermal panel demonstrates, which cost just some £60 pounds to make and can produce water to 70 degrees temperature if the sun ever shines (just to show that I don’t just do talks on the subject), but modern technology allows for far greater levels of efficiency albeit at a cost.
- As mentioned earlier it is the relative cost of implementing renewable technology that means we still require financial support to help stimulate the market and encourage adoption of renewables. As uptake grows the ensuing economies of scale or production allows technology costs to fall. The rate of such falls is often difficult to predict (although references to other countries which have adopted FiTs should give an indication of trendlines – I will look at this in a bit more detail later on). There are plenty of drivers for renewable energy The need to reduce our reliance on fossil fuel generation, as it is a finite resource and is subject like all commodities to significant fluctuations on price That said the perception that we may run out of oil, coal, gas is an ever changing one. The FT recently ran a series of articles on shale gas a few weeks back and made the point that in the US gas prices have fallen through the floor as they have recently started producing more gas than they need from fracking and are turning from a net importer into a net exporter. In China it is estimated that shale gas reserves could provide China with sufficent gas to cover its demand today for the next 200 years. The need to reduce CO2 emissions – whether you believe in global warming and climate change due to CO2 emissions the principle of reducing pollution is a sound and sensible measure in anybodies books The production of locally embedded energy makes significant sense in terms of producing power where it is needed rather than having to transport it 100 miles from its point of generation to its point of use and the resulting losses that occur in-between Regardless of these points the UK has entered into legally binding agreements with the EU to seek to reduce carbon emissions and the only way this can be achieved (given issues over a nuclear power programme ) is by using less energy and generating cleaner energy. The UK has a target of producing 15% of its energy needs by 2020. This “energy” figure isnt just electricity, but all fuels used including transport. The task of how we might achieve this is set out by DECC and it recently completed its Renewable Energy Roadmap, which examins the potential for various types of renewable technology its anticipated growth and overall contribution to meeting these targets. When you look at the index of this weighty (there never anything else) document you might notice there is something missing from the technology list. Its solar, which you will then see from further detail is lumped in with such other popular technolgies as geothermal and “domestic heat). But Im not going to dwell on the point now, as I will look at the issues of solar a bit later.
- So we have targets and we even have a roadmap (although most people today use Satnavs to work out where they are going to – not really relevant you might think, but when we consider some of the issues that have arisen in the last 18 months over FiTs, I do wonder if people in DECC are still using a paper and pen to add things u and a big leather ledger to make notes on take up rather than the more modern and accurate facitilities of spreadsheets and databases to both capture and process data) If we look at the bigger picture The UK has lagged some way behind many of its European counterparts in the deployment of renewables never mind globally. Whilst somehwat out of date the annual renewables global status report shows how Germany, Spain, Italy and France who implemented FiTs some 7 etc etc years ago have made huge strides in deployment. The UK has been very slow in its deployment which has been hampered by the slow implemntation of a FiT type programme and the constraints of our planning system and the state of our network infrastructure.
- Given the Uks target of 15% renewable energy generation by 2020 its is only likely to be achievable with wind development. The base line for onshore development is limited by a myriad of factors which will be known to many of you, but for those who are not experienced in wind development they are Wind resource – the UK has one of the best wind resources in Europe but there are many places where the wind regime is insufficient to warrant wind development. Availability of land in regards to proximity of housing, access, aviation and the all critical aspect of grid connection (never mind the subjective matter of visual impact) all place restrictions on the growth of onshore wind development So in recent years there has been a switch to offshore deployment
- More Offshore deployment of wind solves a myriad of problems that otherwise relate to onshore wind development. Most critically they remove the issues of planning (in so far as visual impact) and other aspects such as access and feweer issues over aviation. However the all important aspect of grid connection is still a significant barrier. Overall we can see that predicted levels of deployment for offshore wind are potentially a great deal higher than tha of onshore wind.
- It is perhaps worth taking a moment to look at the development process for wind development which should be applied to all scales of wind development. The process seeks to look to mitigate risk against cost as the various hurdles to deployment are examined. First scoping Includes looking at all factors that might effect wind development Planning (which may include ecological and bird studies), grid (which is an ever changing pricture), aviation, access, turbine selection and of course the wind regime The timeline however for large scale wind development is very lengthy taking anything from 4-6 years There is little point in ordering a wind turbine until you established the viability of a site in terms of its wind resource, whether or not you are likely to achieve planning and what the relative costs of construction and connection will be.
- So I have looked at the background and drivers for renewable development and it is clear that it is only through large scale commercial deployment that the target of 15% is going to be met. But what of smaller scale deployment, which is likely to be the scale of development that those of you here today are interested in. The status of the FiT as the main support mechanism for small scale renewable generation is currently in limbo. DECC published in Feb 2012 2 separte consultation documents pertaining to 1) Solar 2) the balance of other FiT technologies (namely wind, hydro, AD and micro chp). For those of you unfamiliar with DECCs consultations and in particularly to solar it is fair to say that its approach has been shambolic at best and destructive in a worse case scenario to the renewables industry as a whole. DECC has produced to date (5 consultations) since the inception of FiTs in April 2010. The first consultation and subsequent changes to the FiT regime occured in Feb 2011 only some 10 months after FiTs were introduced. The purpose of the first consultation was to stop the deployment of large scale solar (upto 5MW) which DECC stated the scheme was not intended for. Subsequent consultation and amendments where then made in August 2011 to close a loophole that still allowed for large scale deployment. In the meantime DECCs apparent inability to read a graph, allowed for a ever increasing deployment of smaller scale domestic and semi domestic installations to take place. The result was a series of further amendments to the FiT regime, with consultations and amendments taking place in October of 2011 and further consultation as already mentioned in Feb 2012. The net result of this has been a series of mini gold rushes as both commercial and private developers against the backdrop of ever falling PV prices sought to beat deadlines of changes to FiTs to maximise on returns. However the damage to the renewable industry as a whole is the complete lack of confidence in DECC and the future of FiTs which has resulted in significant losses to developers (both large and small) as lending has dried up due to investor uncertainity.
- Renewable UK recently released last month a report on the status of wind development in the UK. Within the report it highlighted some key issues that are delaying deployment of wind, pre-construction Commercial Viability of projects c. 17% Projects pending sale c. 14% Aviation issues 14% Grid connection issues 14% It also highlighted that sites in construction are being delayed because Projects pending sale 26% Difficulting sourcing turbines 21% Intractable planning conditions 13% Access route difficulties 11%
- This graph shows the deployment of PV. 11 th Dec deadline (which was subsequently ruled to be illegal by the high court and the supreme court) looked to reduce the support for domestic solar (from 43.3p /kwh to just 21p) 3 rd march 2012 deadline was a back up date by DECC in case they lost their appeals 1 st april 2012 more dramatic as it introduced the requirment for PV to be related to EPCs
- Despite all the changes to solar PV FiT we can see that PV accounts for at least 95% of all renewable installations to date. The question is (and relating back to my first slide) whether or not deployment of wind may give rise to similar issues as we have seen with PV. I calculated some 12 months ago that if 1200 medium scale (sub 500kw) turbines were deployed that these installations alone would take up the entire FiT budget for the current FiT term until 2015. Take up has been slower than PV for some of the reasons mentioned in relation to wind development and there are plenty of sites that despite grants of planning that will not be deployed as they are either uneconomical to build (because of costs of things like grid connection), or because of lack of finance due to being unable to establish wind regime via wind monitoring data or other valuations from credible wind consultants. There are also significant issues relating to sercuring suitable and bankable wind turbine technology, with perhaps just a couple of turbines on the market having the provenance of reliable and long term servicable wind turbines. DECC with its latest phase 2A consultation on other FiT technologies (within which wind is included) has at least proposed that FiT levels of support will be dependant on lvls of take up and have proposed various levels of deployment at whcih wind (and other technologies) will see a fall in FiT, which may at least shield the levy funded budget from breaching further its CAP.
- Along with DECCs inability to predict deployment and take up levels especially in regard to solar has been the issue of recording and better defining the actual number/capacity of installations. This is due to the typical Govt stance of having multiple parties responsible for accrediting and registering installations. This leads to significant delays in validating actual deployment levels. It is estimated that there is some 1.3GW of solar now installed = 1300MW The critical aspect of the FiT rates from July 2012 will be determined (according to consultation) by the level of deployment of PV during march and april 2012. Based on OFGEMS figures total deployment is c 196MW for the 2 months, but you can guarantee that their figures are likely to be significantly off (previously they have been out by as much as 40%).
- So having made such a fine attempt at Feed in Tariffs DECC/Govt decided that we should look to implement a worlds first with the RHI (renewable heat incentive). The RHI is the heat equivalent of the FiT and encompasses a range of technologies such as CHP (combined heat and power) biomass and AD. The RHI is introduced in 2 phases. Phase 1 covers commercial installations and came into effect in Nov 2012. It was then planned that domestic installations would come into effect from late 2012, but DECC has now decided to push this back to 2013. Of note is the fact that they announced a consultation (even quicker than FiTs) relating to deployment levels, so at least they are appearing to learn something I guess. The question is whether in regard to either commercial or domestic installations is there sufficient feedstock, be it biomass (which could be wood or crops) or waste to support long term the RHI. Security of feedstock supply is the critcal element in terms of bankability of a project. Waste is a diminishing resource. Biomass effected by other economics – namely pressure of other demands on wood and/or crops Technology is also critical, with many not sufficiently proven to raise either finance (gasification for example) or simply being difficult to manage. Ie AD plants, very sensitive to feedstocks and require a lot of tinkering with to achieve the best output. In germany and other EU countries like Austria , Switzerland AD has been proven to work both on a simple biogas generation operation and also biomethane production. In the UK the Govt/DECC is very supportive of AD, but one needs to consider how it might be implemented. A 2MW AD biomethane gas to grid plant would require some 35,000 tonnes of Maize for example. This requires approx 2000 acres of land to produce, and maize is a break crop (i.e used in a rotation against other crops like wheat). Most farms would only want to plant up to 25% of their total acreage with something like maize, so in reality you would want a total land holding of between 7000 – 10000 acres to support one AD biomethane gas to grid installation. Smaller plants might be viable but the economics are difficult to support when you factor in the additional costs of the injection system never mind the still developing legislation required for connection into the gas distribution net work.
- So we have looked at the past, present and the question remains what of the future? Well technology and legislation is ever evolving. What lessons can we take out of what has happened in the past and recently. Carrying out appropriate due diligence on your renewable energy development is critical. We should examine all aspects in a sensible order (to minimise costs in relationship to risks) and I would suggest that this order should typically be Planning – given both national and localised planning policy are we likely to achieve a development Given that planning may be likely can we economically connect our development to the grid (whether electrical or other – say biomethane) Is our choice of technology both well proven and even if proven is it bankable? What are the likely deployment times for our choosen renewable development. This is highly critical as we have seen significant issues in terms of support under various DECC/Govt backed schemes, resulting in reductions to Tariffs and potentially even the entire basis on which FiTs are pinned (i.e RPI, grandfathering).
- So we have looked at the past, present and the question remains what of the future? Well technology and legislation is ever evolving. What lessons can we take out of what has happened in the past and recently. Carrying out appropriate due diligence on your renewable energy development is critical. We should examine all aspects in a sensible order (to minimise costs in relationship to risks) and I would suggest that this order should typically be Planning – given both national and localised planning policy are we likely to achieve a development Given that planning may be likely can we economically connect our development to the grid (whether electrical or other – say biomethane) Is our choice of technology both well proven and even if proven is it bankable? What are the likely deployment times for our choosen renewable development. This is highly critical as we have seen significant issues in terms of support under various DECC/Govt backed schemes, resulting in reductions to Tariffs and potentially even the entire basis on which FiTs are pinned (i.e RPI, grandfathering).
- Proven Energy one of the Uks longest standing wind manufactures has gone into administration due to fundimental flaws with one of its turbines. All turbines suffer failures, but some more than others. i.e WES, used to be Lagerway, recent installations at the MEMC AND in NANTUCKET of blade failures C&F Energy recently launched turbine suffering from cracked flanges, Endurance wind turbine in Devon destroyed itself. Many others we don’t hear about.
- Is this turbine proven or unproven? What might we consider by proven? Does it have an independtly verified power curve. Number of hours of operation How many installed Availability in terms of performance vs component failure What warranty on performance is provided and does the manufacture have an interest in smaller, single or multiple type installations???????????
- These figures based on one of our own projects, after initial screening had already been carried out. Civil Aerodromes CAP 764 states the distances from various types of airfields where consultation should take place. These distances include: Airfield with a surveillance radar - 30km Non radar licensed aerodrome with a runway of more than 1100 metres - 17km Non radar licensed aerodrome with a runway of less than 1100 metres – 5km Licensed aerodromes where the turbines would lie within airspace coincidental with any published Instrument Flight Procedure Unlicensed aerodromes with runways of more than 800 metres – 4km Unlicensed aerodromes with runways of less than 800 metres – 3km Other aviation activity such as parachute sites and microlite sights within 3km, developers are referred to appropriate organisations Ministry of Defence It is necessary to take into account the aviation and air defence activities of the Ministry of Defence. The type of issues that will be addressed include: Ministry of Defence Airfields, both radar and non radar equipped Ministry of Defence Air Defence Radars Ministry of Defence Meteorological Radars Physical Safeguarding of Military Airfields using the criteria laid down in JSP554. National Air Traffic Services (NATS) Facilities It is necessary to take into account the possible effects of turbines upon the National Air Traffic Services radar systems, a network of primary and secondary radars and navigation facilities around the country.
- Again based on our own data from current project for a client.
- Issues on project viability effected by lack of financing in the market, the weak pound making turbines more expensive and general uncertainty around the future value of the RO Don’t over gear – whilst attractive to reduce risk we are seeing projects which are too heavily geared failing when wind resource (capacity factor) is not being achieved. Ie last year particullaraly low wind speeds so average yields drop along with receipts, making the servicing of debt very hard. Better that you model your return on a capacity factor based on P90 rather than P50. What is P90 – P50 P90 is all about quantifying the uncertainty of annual energy yield predictions. P90 is the energy prediction that a wind turbine is 90% likely to produce over an average year, given the uncertainties in the measurement, analysis and wind turbine operation. P50, on the other hand, is the average annual energy yield predicted for your site - the annual energy output you are most likely to achieve. Investor decisions are commonly based on P90 (P95 or even P80 are sometimes used). Better instrumentation, long term data, analysis and wind turbine operation are all able to close the gap between P90 and P50, so increasing your project value