Scaling up Ethiopia’s ‘Seeds for Needs’ approach of using agricultural biodiversity to adapt to climate change
•Transferir como PPTX, PDF•
1 gostou•824 visualizações

Bioversity International scientist Carlo Fadda presents to the World Bank on the results we have had so far working with partners in Ethiopia to tap into the genetic diversity of the country and the knowledge of farmers, to help them adapt better to climate change. Find out more about Seeds for Needs: www.bioversityinternational.org/research-portfolio/adaptation-to-climate-change/seeds-for-needs/

Recomendados
Recomendados
Mais conteúdo relacionado
Mais procurados
Mais procurados (20)
Destaque
Destaque (20)
Semelhante a Scaling up Ethiopia’s ‘Seeds for Needs’ approach of using agricultural biodiversity to adapt to climate change
Semelhante a Scaling up Ethiopia’s ‘Seeds for Needs’ approach of using agricultural biodiversity to adapt to climate change (20)
Mais de Bioversity International
Mais de Bioversity International (20)
Último
Último (20)
Scaling up Ethiopia’s ‘Seeds for Needs’ approach of using agricultural biodiversity to adapt to climate change
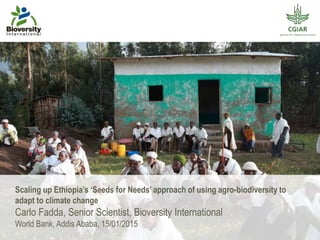
- 1. Scaling up Ethiopia’s ‘Seeds for Needs’ approach of using agro-biodiversity to adapt to climate change Carlo Fadda, Senior Scientist, Bioversity International World Bank, Addis Ababa, 15/01/2015
- 3. Presentation’s Outline Climate change Green economy strategy: agricultural targets Seeds for Needs: what is all about Upscaling seeds for needs
- 4. Climate Change: Is It Real?
- 5. Climate Change: Some Evidence
- 6. •Climate change, floods, droughts, unpredictable temperatures and rainfall •Changing pest and pathogen populations and levels of pollination efficiency •Increased soil and land degradation Major Environmental Threats to Sustainable Production
- 7. Adaptation to climate change: recommended actions by the IPCC Improving crop tolerance to high temperature is a frequently identified adaptation for almost all crops and environments worldwide as high temperatures are known to reduce both yield and quality
- 8. Adaptation to climate change: recommended actions by the IPCC Improving gene conservation and access to extensive gene banks could facilitate the development of variety with appropriate thermal time and thermal tolerance characteristics
- 9. Adaptation to climate change: recommended actions by the IPCC Indigenous Knowledge (IK) has developed to cope with climate hazards contributing to food security in many parts of the world
- 10. Ethiopian Green Economy Strategy Target set for agriculture: • Boost agricultural productivity (+40% increased production for major crops such as teff, maize, wheat); • Intensify agriculture through usage of improved inputs and better residue management resulting in a decreased requirement for additional agricultural land that would primarily be taken from forests; • Create new agricultural land in degraded areas through small-, medium-, and large-scale irrigation to reduce the pressure on forests if expansion of the cultivated area becomes necessary • Introduce into cultivated areas lower-emission agricultural techniques, ranging from the use of carbon- and nitrogen-efficient crop cultivars to the promotion of organic fertilizers
- 11. Under conditions of change (reducing the probability of loss of agricultural productivity in the future, while enhance productivity today) The fundamental question: Productivity and reduced vulnerability How can we ensure that agricultural productivity increases are accomplished in ways that create and enhance ecosystem resilience and services for the poor?
- 12. Minimum Goals for 2050 Environmental GoalsDevelopment Goals Total Agricultural Production Nutritionally Complete Production Biodiversity Conserved Carbon Sequestered Food Security Goals Increased Farmer Livelihoods And Resilience Increase Farm Self Reliance Adapted from Foley et al 2011 The Case of Durum Wheat Improve Human Health Food Distribution and Access Conserve agrobiodiversity Water Conserved Improved Water Quality Soil Formed
- 13. Unexploited Potentials in Landraces • disease resistance (Leppik, 1970; Negassa, 1986; Klindworth et al., 2007; Jemanesh et al., 2013); – e.g. Ethiopian landraces are the source for Sr13 gene, which is responsible for stem rust resistance • Drought tolerance/resistance (Tesfaye, 2001; Mondini et al., 2010, our study) • Very diverse for qualitative and quantitative traits
- 14. What We Did
- 15. Phenotyping trials The genotypes, 373 landraces and 27 improved wheat varieties, were phenotyped at two locations (Hagreselam and Geregera) in 2012 and 2013 main cropping seasons for 10 important traits: A. Phenological traits • days to 50% booting (DB); • days to 50% flowering (DF) and; • days to maturity (DM) B. Morpho – agronomic traits • plant height (PH); • number of effective tillers per plant (NET); • spike length (SPL); • number of seeds per spike (SPS); • above ground dry biomass (BY); • grain yield (GY). Phenotyping (external characteristics)
- 16. 0 10 20 30 40 50 60 70 80 <µ - 2SD µ - 2SD to µ - SD µ - SD to µ + SD µ + SD to µ +2SD >µ +2SD DISTRIBUTION OF GENOTYPES INTO VARIOUS CLASSES HS GER Com Performance of Genotypes Across Locations
- 17. Landraces Performance Compared With the Best Improved Variety The table tells that: •21%, averaged over traits, of the landraces are superior to the best performer IM variety •Many landraces mature earlier than the IM varieties •A yield advantage of 61% obtained from the best landrace over the best IM variety (Robe) Trait Superior (IM) Superior (LRs) no‡ %age No Geregera % Geregera DB* 59.69 55.54 1 0.3 1 0.3 DF* 70.8 69.88 1 0.3 5 1.6 DM* 116.59 109.34 57 18.4 71 23.0 PH 110.34 115.07 8 2.6 5 1.6 NET 7.14 7.48 90 29.1 48 15.5 SPL 7.94 9.5 125 40.5 19 6.1 SPS 41.67 41.83 1 0.3 2 0.6 BY 7.17 9.99 97 31.4 47 15.2 GY 2.17 3.49 68 23.9 22 7.1
- 18. Ethiopian Unique Genetic Diversity
- 19. Landraces vs. Improved Genetic Divergence
- 20. Crop Improvement Grain Yield as quantitative trait in Hagereselam 2012 Plot overall performance in Hagereselam 2012
- 21. Modified from Yu et al. 2008 Principal Facts • 52 RIL families • 180 – 200 lines • > 9,000 F6 lines in Dec. 2014 • wide phenotypic variation Development of a Structured Multiparental Population Nested Association Mapping - NAM-Population
- 25. Seeds for Needs
- 26. (1) Genetic diversity (2) Selection & cultivation (3) Harvest (4) Value addition (5) Marketing (6) Final use Outcomes Empowerment of communities: more resilient to eco-socio-economic changes, more resilient food systems Outcome Preservation of options for resilient systems Outcome Self-reliance of value chain actors on broader set of options, making them more resilient to market changes From Farm to Fork: Biodiversity Contribution along the Value Chain IMPACT Improved nutrition, incomes and other livelihood benefits
- 27. 3. Farmers test and report back by mobile phone 3. Environmental data (GPS, sensors) to assess adaptation4. Data are used to detect demand for new varieties and traits 4. Farmers receive tailored variety recommendations and can order seeds The process 2. Each farmer gets a different combination of varieties 1. A broad set of varieties is evaluated
- 28. Participatory Evaluation • 30 farmers per location (15 male + 15 female) • Individual score on 5 traits for 800 plots • > 200,000 data points
- 29. 29 Participatory Variety Selection (PVS) Mother and Baby Trial Approach
- 30. 3. Farmers test and report back by mobile phone 3. Environmental data (GPS, sensors) to assess adaptation 1. A broad set of varieties is evaluated 4. Data are used to detect demand for new varieties and traits 4. Farmers receive tailored variety recommendations and can order seeds The process 2. Each farmer gets a different combination of varieties
- 31. Crowdsourcing 31 - 2 woredas - 12 villages - 85 km by 32 km cover - 2400 to 3100 masl
- 32. • 32 genotypes (pre-selected by farmers) • 24 farmers • 4 genotype per farmer • 3 times replication of each genotype Mother and Baby Trial Approach 32 Monthly report by a group of farmers Method of communication with farmers I-button in each farmer plot
- 33. Crowdsourcing • 4 genotypes per farmer • All package was sent to each farmer • 200 farmers, 12 different villages • 21 genotypes, 1 common for all 200 farmers • 30 times replication of each genotype
- 34. Crowdsourcing • Enumerator selection and training • Farmers trained • Bylaws developed
- 35. 35 iButtons and Rain Gauge iButton holder preparation
- 36. Different Stage Performances Undergone meeting every month at each village and made report Researchers data collection
- 37. 2. Each farmer gets a different combination of varieties 1. A broad set of varieties is evaluated 4. Data are used to detect demand for new varieties and traits 4. Farmers receive tailored variety recommendations and can order seeds The process 3. Farmers test and report back by mobile phone 3. Environmental data (GPS, sensors) to assess adaptation
- 38. group number Four Farmers Name: 1. Guzguz Gelaw2.Yeshi Nega 3. Aregitu Moges 4. Abebabye Mebrate 5.Melkam Tseganew Farmer No Farmer Name የአ/አደር ስም Plot No. የመደብ ቁጥር Treat No. የተጠኝ ቁጥር Acc Name የዝርያ ስም Earliness/ፈጥኖ ደራሽነት Tillerig C/የጋቻ አመታት Spike Q/የዛላ ሁኔታ Disease/የበሽታ ሁኔታ Overall/አጠቃላይ Remark/ማስታ ወሻየአ/አ ተ.ቁ 1 2 3 4 5 1 2 3 4 5 1 2 3 4 5 1 2 3 4 5 1 2 3 4 5 አራጋው መብራት 1 8 222854 1 1 1 1 1 1 1 1 1 2 2 2 2 2 2 2 3 2 2 2 2 2 3 2 2 Aragaw Mebrat 2 9 238576 3 3 2 2 2 2 2 2 2 2 2 2 2 3 2 3 3 2 2 2 2 2 3 2 3 3 22 236300 4 3 3 2 2 1 1 1 1 1 1 2 1 2 1 2 2 1 2 2 2 3 2 1 3 4 25 222736 1 2 2 2 1 2 2 1 1 1 2 2 1 2 1 2 2 1 2 2 1 2 2 1 2 ምስጋናው ሙሉጌታ 1 2 204488 4 4 4 4 3 3 3 3 3 2 4 4 3 4 3 3 3 3 3 3 3 4 3 3 3 Misganaw Mulugeta 2 11222816B 3 4 4 3 3 3 3 3 3 3 3 4 3 4 4 3 3 3 4 3 4 4 3 4 3 3 24 206551 5 5 5 3 4 3 3 3 3 3 3 3 3 4 4 4 3 3 3 3 3 4 4 5 3 4 27 222408 2 3 3 3 2 3 3 3 4 3 3 4 3 4 4 3 4 3 4 3 4 5 4 5 4 የሽ ነጋ 5 5 5 4 4 2 3 3 4 3 3 2 3 3 3 3 2 2 3 3 3 3 3 3 2 Researcher Data Farmers score Mother trial Farmers score Baby trial Both farmer data and researcher data has been recorded and is being processed
- 39. 39 Harvesting Biomass Grain yieldNumber of seeds per spike Balance was distributed to all villages Harvesting and data collection
- 40. 3. Farmers test and report back by mobile phone 2. Each farmer gets a different combination of varieties 3. Environmental data (GPS, sensors) to assess adaptation 1. A broad set of varieties is evaluated 4. Data are used to detect demand for new varieties and traits 4. Farmers receive tailored variety recommendations and can order seeds The process
- 41. Strengthening Community Seed Systems
- 42. Upscaling and Outscaling Seeds for Needs Reaching more farmers and for more crops • Capacity development • Approach institutionally embedded in extension services and agro- dealer networks • Methodology improved and expanded using ICT-based solutions
- 43. Crowdsourcing plan • Initial investment for a new crop such as teff, sorghum, pulses, targeting 500 farmers/site for 2 years • Crop technical characterization • Participatory evaluation • Capacity development • Crowdsourcing • Subsequent distribution through crowdsourcing: targeting 10,000,000 HH over 3-4 years including seed multiplication
- 44. Strengthening Seed Systems Institutional genebanks (National, private, experimental stations, universities…) Community Seedbanks CGIAR genebanks International Genebanks Regional genebanks
- 45. To strengthen the seed network one needs more than one seed bank/landscape (roughly 10 to reach 10,000 households). Goal: to reach 200,000 households in 20 landscapes across the country
Notas do Editor
- PARTNER LOGOS SLIDE If you have 4 or more logos, place them on a separate slide like this.
- Projected rainfall change over sub-Saharan Africa in the mid- and late 21st century is uncertain. In regions of high or complex topography such as the Ethiopian Highlands, downscaled projections indicate likely increases in rainfall and extreme rainfall by the end of the 21st century. Climate model projections under the SRES A2 and B1 scenarios over Ethiopia show warming in all four seasons across the country, which may cause a higher frequency of heat waves as well as higher rates of evaporation (Conway and Schipper, 2011). Changes in precipitation are difficult to predict: downward trends in some part of the country and upwards in others with increased inter-annual variability.
- Despite the fact that durum wheat was broadly grown in Ethiopia until the 60’s it has been now largely replaced by bread wheat and now it only contributes to 20% of Ethiopian wheat production and mainly in marginal areas. Yet, Ethiopia importes most of its durum wheat from abroad Lack of awareness on the importance (i.e. commercial use) of durum wheat at farm level for bread , drinks and other local products Heavy dependence of pasta making industries on imported durum wheat than promoting the within country production despite potential alternatives for high value locally produced pasta
- Landraces is what farmers developed and varieties are developed by breeders A) Phenotypic data The collected phenotypic data of each trait was analyzed for: Variability (ANOVA) Heritability (h2) Genotype by traits relationship (GGE) B) Genetic data The SNP data was analyzed for: Relatedness (phylogeny, PCA, Structure) Marker – traits association (MTAs)
- The figure depicts: The majority, about 60%, of the genotypes have average performance in both locations for all traits About 20% of the tested genotypes have superior performance in both locations On the other hand, nearly 20% of the genotypes showed inferior performance. This performance distribution assumed normality which is statistically expected.
- Mediterranean groups The improved Ethiopian durum wheat varieties clustered together with the Mediterranean groups This implies that improved durum wheat varieties cultivated in Ethiopia are genetically very distant from the diverse landraces
- Ethiopian durum wheat landraces much diverse from both Ethiopian improved durum wheat varieties and Mediterranean durum wheat groups. The majority of improved durum wheat varieties cultivated in Ethiopia are exotic introduction. The landraces are genetically diverse for phenological and agronomic traits. So far, the breeding program of Ethiopia overlooked the use of these diverse landraces but the result urges revising the ignored resources to produce adaptable durum wheat varieties. Re-thinking on the breeding strategies is needed!! Landraces collected from very distant locations are found more closer genetically than those from the same area of collection. This implies that grouping on the basis of their geography of collection does not necessarily indicate that the landraces from different areas are genetically different. Molecular markers, SNPs, revealed the diversity of the landraces for the studied traits.
- Also focus on crops holding comparative advantages to grow in marginal areas, where poor communities are most challenged- selection based also on nutritional benefits. Many of the so called underutilized species hold great promises in terms of nutrition security, adaptation and income- many other non material benefits also related to their continued use..
- 4 predetermined traits and 1 general scoring Earliness Tillering capacity Spike quality Disease tolerance
- This is a much faster process than conventional breeding, can be part of variety release strategy (it has been tested in Nicaragua with some success) and can be used to more decentralized participatory breeding schemes.
- Yet, one can think at strengthening all sort of intermediate seed systems, including local cooperatives of seed producers (ATA, ISSD, GIZ)