
Recomendados
Mais conteúdo relacionado
Mais procurados
Mais procurados (20)
Semelhante a Spectrolytic Corporate
Semelhante a Spectrolytic Corporate (20)
Último
Último (20)
Spectrolytic Corporate
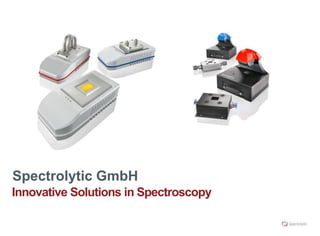
- 1. Spectrolytic GmbH Innovative Solutions in Spectroscopy
- 2. 2 Agenda • Who we are • Mid-IR Spectroscopy • Product Portfolio (Current & Future) • Applications and Examples
- 3. 3 Who is Spectrolytic Spectrolytic was founded in 2012, to exploit the results of a PhD project related to a mid-infrared oil sensor for gearboxes in wind turbines Initially an IP only company with all operations located at Comline, it became a fully operational commercial entity in 2015 to enable further growth with a clear strategic focus on providing cost effective spectroscopic solutions. All current spectroscopy products are still produced at Comline utilizing their expertise in manufacturing electronic products for harsh environments Spectrolytic also offers bespoke MEMs / process development service in its cleanroom facilities. The process development activities are carried out by world class trained MIT / Cambridge physicists and material experts. A privately held and self-funded operation with continued positive growth year on year and offices in Germany, US, UK and Spain.
- 4. 4 Location & Team • Headquarters – Wackersdorf Germany • R&D • SW / HW Development • Application development • Manufacturing subcontracted to Comline Elektronik Elektrotechnik GmbH • Technology Research Center – Spain • Advance process and technology research • Sales, Marketing and Application Support • UK • USA – California
- 5. 5 What is mid-infrared spectroscopy • A broad band emitter shines light through a samples • The molecules in the sample will absorb certain wavelength of the light whist others pass through the sample • The wavelength of the light that is absorbed by the sample can be linked to certain molecular structures that unequivocally identifies the molecules. • Typically light in the wavelength range from 2.000nm to 12.000nm (mid infrared wavelength region) provides the highest absorption signal whiles still providing a unique molecular identifier • Monitoring the changes in the absorption spectrum of a sample over time provides information about the concentration of relevant molecules in the sample. Sample 5001000150020002500300035004000 0 10 20 30 40 50 60 wavenumber (cm-1 ) transmission(%) Broad band emitter Absorption spectrum
- 6. 6 Transmission &ATR Spectrometer Principles multi-element IR-Emitter ATR LVF Pyroelectric linearray oil multi-element IR-emitter cuvette LVF pyroelectric line sensor -Light is emitted from broad band source -Light penetrates cuvette with sample fluid/gas -Certain wavelength get absorbed by sample -Light is separated into its spectral components by Linear Variable Filter (LVF) -Signals (as function of wavelength) are detected with sensor -Light is emitted from broad band source -Light is coupled into an ATR crystal -Sample fluid is placed on top of ATR crystal -Light bounces in a controlled way through ATR crystal and interacts with the sample on its surface -Certain wavelength get absorbed by sample -Light is separated into its spectral components by Linear Variable Filter (LVF) -Signals (as function of wavelength) are detected with sensor
- 7. 7 Product Portfolio Transmission Spectrometer Spectral range: LVF1: 5.5-11µm (1808-909cm-1) LVF2: 2.5-5µm (4000-2000cm-1) Voltage supply: 12-33V / 3W Communication interfaces: Ethernet, CANopen, USB Aditional ports: 16GPIOs, I²C, SPI, UART Cuvette: demountable, 15-250µm spacer ATR Spectrometer Spectral range: LVF1: 5.5-11µm (1808-909cm-1) LVF2: 2.5-5µm (4000-2000cm-1) Voltage supply: 5V / 3W Communication interfaces: Ethernet, Bluetooth, USB ATR: ZnSe, 9 reflections ZnS, 9 reflections Diamond, 9 reflections Additions: Through flow plate Options for fixed installation
- 8. 8 Product Portfolio Static FTIR Spectrometer Spectral range: 2.5um – 15.5um 7.0um – 15.5um Voltage supply: POE / 12V DC,10W Communication interfaces: Ethernet Configurations Transmission, ATR, Reflection, Gas cell Features: World‘s fastest FTIR spectrometer No moving parts Gas Spectrometer Spectral range: LVF1: 5.5-11µm (1808-909cm-1) LVF2: 2.5-5µm (4000-2000cm-1) Voltage supply: 5V / 3W Communication interfaces: Ethernet, Bluetooth, USB Gascell: Stainless steel, 12cm pathlength
- 9. 9 Product Portfolio Lab in a Box • Truly portable solution for instant analysis. • Simplified software user interface to improve usability in the field • Battery operated • No need for additional wet chemistry • Dedicated solution for • Biogas engine oil analysis • Marine engine oil analysis • FAME analysis • Milk analysis
- 10. 10 Software - Sphinx Suite Basic Automation Chemometrics Prediction Standalone Option A: Modulations Frequenz Automation Toolkit • Definition of measurment routine • Continous execution of measurement routine • Automatic data capture • Automatic Reconnect after PC restart • Trigger Modus • Control of extention interface Chemometrics Toolkit • ANN model builder (Classification) • PLS1 model builder (Quantifikation) • SIX model builder (Similarity Index) • Band pass filter model builder (Industrial Transmission device) • Definition of control parameters • Saving of models • Analysis of historic data (Offline) Prediction Toolkit • Integration in Automation Toolkit • Automatic evaluation of measured IR-spectra • Visualisation of control values • Saving of the analytical results • Generating pdf report Stand allone Toolkit • Activation of OCOM interface • Transfer of the automation sequences onto the spectrometer • Autonomous measurement by spectrometer without PC Modulation Toolkit • Select modulation freuqency between 5-20 Hz.
- 11. 11 Validated Market Segments Marine Wind Turbine Agricultural Medical Fuel Engine Oils,Grease and Lubricant Transmission/Gearbox and Hydraulic Oil Cholesterol, Pulmonary Disorders and Cancer Dairy: Adulterant Analysis – Urea, Melamine, etc. Content – Fat, Glucose, Protein etc. Commodities: Spices, rape seed, etc. Biofuels, Jetfuel, Diesel and Petrol, Fuel Genuinity
- 12. 12 Soot measurement in marine engine oils Samples: 25 unknown samples of engine oil Explority interpretation of IR spectra: IR spectra of uncalibrated oils can be interpreted as the soot content of engine oil appears as a baseline shift of the spectra 100011001200130014001500160017001800 10 20 30 40 50 60 70 80 wavenumber (cm-1 ) Spektrenübersicht - LVF - marine engine transmission(%) 100011001200130014001500160017001800 20 30 40 50 60 wavenumber (cm-1 ) Spektrenübersicht - LVF - MSC- marine engine oil transmission(%) Mathematical correction the spectra can quantify the of the soot content of the engine oil
- 13. 13 Total Base Number (Biogas engine oil) Öltyp: Addinol GMO MG 40 Extra PLUS Quantitative Interpretation of IR spectra: Calibration files available from oil analysis partners Spectrolytic has established relationships with a number of reputable oil analysis labs TBN can be measured very accurately. 100011001200130014001500160017001800 10 20 30 40 50 60 70 80 wavenumber (cm-1 ) spectra - LVF - biogas engine oil transmission(%) 2 3 4 5 6 7 8 9 10 2 3 4 5 6 7 8 9 10 11 measured y predictedy Spectrometer: LVF - parameter: TBN samples target line regression line RMSE0.2279 SE0.2375 R 0.9957 R-Square 0.9912 y = 1.0030x+ 0.0086
- 14. 14 Water contamination (Windturbine gear oil) Absorptionsbands of water v1: 3280 cm-1 (streck) v2: 1644 cm-1 (beuge) v3: 3490 cm-1 (streck) Concentrations range of system: 250 – 5000 ppm Plenty of scope to optimise measurable water concentration if required. 100011001200130014001500160017001800 0 10 20 30 40 50 60 70 wavenumber (cm-1 ) Klüber Synth GEM4-320N - LVF spectra raw data transmission(%)
- 15. 15 Analysis of raw milk (Agriculture) • The analysis of the raw milk as close as possible to the cow is very important: • Milk quality provides instant information about health of cow • Milk quality can be used to optimise feeding of cows • Provides the farmer with information about the quality of the milk • Additional parameters that can be measured are fat content, protein content, milk contamination (urea, melamine) and many more Lactose concentration in raw milk Water concentration in raw milk
- 16. 16 Differentiate cancerous from non-cancerous samples • Infrared absorption spectra of all samples are shown on the right. • Offset shifts in y-direction are due to variability in sample preparation. • The Partial Least Square (PLS1) method was used to analyse the data using SphinxSuite • Analysis of mid-infrared absorption spectra allows to differentiate between cancerous and non-cancerous samples • R2 = 0.9 with limit sample numbers • 5 principle components Cancerous Non -Cancerous
- 17. 17 Spectrolytic‘s products can address all required measurement needs Spectrolytic current products address many of the relevant measurement problems related to oil condition monitoring Infrared absorption measurements of samples are a recognised and well established technology Spectrolytic products moved this technology out of the laboratory into the field / processing plants Next step is to bring this powerful technique to more mainstream application by maintaining the accuracy of the measurements but bringing down the costs. We believe the automotive & industrial market are very interesting market segments and we currently identifying suitable partners with market insight and sales channels
- 18. 18 More stringent regulations by governments drive require the cost per measurement to decrease low Number of measurements Costpermeasurement high lowhigh FTIR Industrial fixed Spectrometer Handheld Spectrometer Application Specific Solutions Spectrolytic existing business Product Road Map Industry 4.0 demand lower cost per measurement for the IoT of things Government & regulators impose ever stricter environmental controls requiring novel engine / software solution. Non complying becomes increasingly difficult after VW scandal Spectrolytic & partner(s) provide route for a cost effective sensor solution to solve many challenging measurement problems
- 19. 19 Spectrolytic‘s cost effective sensor solution Many applications use the same oil and therefore the absorption spectra from engine to engine are very similar Spectrolytic has developed a software that identifies key wavelength bands for each relevant oil parameter for a specific oil type. These parameters can then be translated into an application specific oil sensor being able to measure any number of oil parameters. These oil sensors can be very robust, accurate and cost effective The same concept described above maps onto any other application
- 20. 20 Discrete filter solution performance matches FTIR performance Addinol GL 80 W (Glysantineintrag) Addinol GL 80 W (Wassereintrag) Addinol GMO MG 40 Extra Plus (gealtert) Tectrol MethaFlexx ZS Plus (gealtert) Texaco Meropa 320 (gealtert) Wasser 1.00 1.00 0.98 0.97 0.18 Ruß 1.00 0.97 0.99 Oxidation 0.99 0.99 0.90 Nitration 0.82 0.82 Sulfation 1.00 1.00 0.99 ZDDP 0.93 0.92 0.94 Glycol 1.00 8 10 12 14 16 18 20 22 24 8 10 12 14 16 18 20 22 24 26 Zielgröße (ASTM E2412) Zielgröße(Bandpassfilter) Addinol GMO MG 40 Extra PLUS - Oxidation Target Regression Fit Data Simulation results based on infrared spectra of used engine oils claculating the parameter OXIDATION. Bandpass filters were selected appropriately and R² was calculated. Results are referenced agains the ASTM E2412 standard Table showing different oil parameters calculated from used engine oil samples measured with a FTIR and simulated Bandpassfilters. R² was calculated against ASTM E2412.
- 21. 21 Spectrolytic‘s cost effective sensor platform for industrial and automotive applications Optical window or Lense Coms: USB / UART 3x PZTSensor 1 2 3 Stack system + Optical frontend Reference design services for industrial and consumer applications based on modular system design and application know-how.
- 22. 22 Summary Spectrolytic has an exciting technology that addresses many problems that are currently relevant in the automotive and industrial market segments Applications we are already working on are oil condition monitoring, gas detection, medical (cancer & COPD) and milk analysis The technology is scalable, proven and can meet the cost targets required for automotive and other high volume applications Spectrolytic is currently evaluating additional partners with relevant market knowledge and sales channels to enter high volume industrial & automotive makets.
- 23. Spectrolytic GmbH Thank you for your interest www.spectrolytic.com info@spectrolytic.com