SlideShare uma empresa Scribd logo
1 de 1
Baixar para ler offline
© 2014 BearingPoint GmbH
Sources
BearingPoint Research
CIA Factbook
Cisco Visual Networking Index: Global Mobile
Data Traffic Forecast Update, 2012-2013
Ericsson Mobility Report – on the Pulse of
the Network Society – Nov. 2013
Fotolia
OECD Broadband Statistics
Provider Information
United Nations
World Bank Data
Latest information available
(Research completed in Feb. 2014) www.bearingpoint.com
Contacts
Austria | Gerhard Greiner, Partner | +43 664 37 69 488
Belgium | Mark Bartels, Partner | +31 6 11 95 5959
Netherlands | Mary Ann Quinn, Partner | +31 6 22 52 5901
France | Henri Tcheng, Partner | +33 6 09 24 2460
Germany | Markus Laqua, Partner | +49 173 6690 964
Ireland | Peter Minogue, Partner | +353 86 857 94 56
Nordics | Mika Niemela, Partner | +358 407 52 00 27
Russia | Konstantin Popov, Partner | +79 85 97 04 392
Switzerland | Vahan Guermann, Partner | +41 79 404 64 39
United Kingdom | James Rodger, Partner | +44 77 4865 4960OTT – content and services delivered via a telecommunication network
without an operator being involved in the control or distribution
OTT driven changes in customer relationship
Before 2007 Now
Contract
(subscription)
Pay-as-
you-go
Contract
(subscription)
Pay-as-
you-go
Contract
(subscription)
Pay-as-
you-go
M(V)NO M(V)NO OTT
Prior to 2007 M(V)NO had an 1:1 relationship (on subscription or pay-as-you-go base) with subscriber.
Now mobile smartphone user has in addition relationship with OTT (one or more).
Payment models for OTT services
Consumer does not pay any direct charge for the
service delivered:
• Basic services for free as "appetizer"
• Advertisement integrated into service
• OTT sells consumers' data (e. g. consumption
habits to 3rd parties)
Consumer has got either a prepaid account or pays
per event (pay-as-you-go) e. g. per credit card
Consumer pays occurring charges –
e. g. monthly fee
Any combination of above – e. g. monthly fee for
basic service and pay-as-you-go for premium services
Free or
financed by
advertisement
Pay per use
Subscription
Hybrid
Hybrid
Pay per
use
Free/
adverti-
sement
Subscription
Strategic options
for telcos
Measures to be taken
• To exclude OTT services from network in order to
reduce the necessary invest for infrastructure
• To set up environment necessary to offer private
services and contents, to introduce new services,
which can compete with OTT providers
• To prepare joint USP with OTT providers ensuring
high quality of service (and guaranteed outstanding
customer experience), joint customer access and
revenue split
• To act as an independent "bitpipe" offering different
tariff models (e. g. reduction of bandwidth, once a
subscriber has reached the data volume limit) and
associated QoS
Exclusion
Introduction of
own services
Cooperation
New tariff models
Abbreviations & definitions
BB Broadband
ISP Internet Service Provider
MNO Mobile Network Operator
Petabyte 1015
bytes = 1,024 Terabytes
QoS Quality of Service
SaaS Software as a Service
MVNO Mobile Network Virtual Operator (Not operating the network themselves)
OTT Over-the-top
CDN Content Delivery Network
Exabyte 1018
bytes = 1,024 Petabytes
FTTx FTTH – fiber to the home, FTTB – fiber to the building, FTTC – fiber to the cabinet
Deep network caching Ability to cache content deep in CDN in order to improve customer experience and reduce transmission costs
Global mobile data traffic in exabytes per month – between 2012 and 2017
0
2
4
6
8
10
12
2012 20142013 2015 2016 2017
Source: Cisco visual networking index:
Global mobile data traffic forecast update,
2012-2017, Ericsson Mobility Report – on the
puls of the network society – Nov. 2013,
BearingPoint research
Significant portion of this additional traffic will result from OTT services – potentially without additional
revenue increase for MNOs
>= 170%
140 – 169%
110 – 139%
80 – 109%
50 – 79%
0 – 49%
Colour schema for countries –
mobile market penetration
Cost cutting through technology investments
within existing access method
• GSM/EDGE
High costs per MB
Low costs per MB
• UMTS
• LTE
• LTE Advanced
• ADSL
• ADSL+
• VDSL
• Vectoring
Cost cutting through technology substitution
High costs per MB
Low costs per MB
• LTE
• Hotspots
• WiFi to go
(WLAN sharing)
• xDSL
• FTTx/coax
• Messaging consumer-
to-consumer
• Voice consumer-to-
consumer
• Video consumer-to-
consumer
• WhatsApp
• iMessage
• Skype
• Chaton
• OTT services substitute
Telco service portfolio
• Increase
Sample OTT services
Communication
• Linear content (live
stream)
• Non-linear content
(content on demand)
• YouTube
• Netflix
• Maxdome
• Watchever
• Lovefilm
• Spotify
• Napster
• Consumer has got
either a prepaid
account or pays per
event (pay-as-you-go)
e. g. per credit card,
PayPal etc.
Content
• Store in the cloud
• Software as a Service
• Dropbox
• Microsoft
Office 365
• Google Drive
• Blizzard
• Zynga
• Bigpoint
• OTT services substitute
telco service portfolio
in some areas
• Generate additional
demand for broadband
(low-latency) access
Cloud
• Online gaming
(peer to peer)
• Generate additional
demand for broadband
(low-latency) access
Gaming
Area Services
Provider
(selection)
Impact on telco
revenue
Impact on
data traffic
• Increase
• Increase
• Increase
Global mobile data traffic by content type – split for 2017
File sharing
M2M
Web/data
Video
Source: Cisco visual networking index:
Global mobile data traffic forecast update, 2012-2017
3%
5%
25%
67%
Market footprint OTTs and MNOs
Facebook 1.100
YouTube 1.000
Skype 330
WhatsApp 300
Twitter 300
China Mobile 750
Singtel 484
Vodafone 454
América Móvil 252
Telefónica 250
SelectedOTTs
(inmusers)
Top5MNOs
(inmsubscribers)
= 200 m
Socio-demographics
Population: 317.2 m
GDP per cap.: 37,733 €
Density: 33 Pop./km²
Internet: 77%
Mobile: 98%
Smartphone: 56%
Fixed: 44%
Market penetration
Top 3 operating systems
Top 3 browsers Top 3 websites
1. Google
2. Facebook
3. YouTube
Mobile PC
Others
iOS
40% 52%
3%5%
Android
Black-
Berry Others
Win 7
OS X
Win XP
14%
13%
26%
47%
IEOthers
Chrome
35%
30%
17%
18%
Firefox
USA
Socio-demographics
Population: 63.4 m
GDP per cap.: 27,336 €
Density: 259 Pop./km²
Internet: 83%
Mobile: 130%
Smartphone: 62%
Fixed: 52%
Market penetration
Top 3 operating systems
Top 3 browsers Top 3 websites
1. Google
2. Facebook
3. YouTube
Mobile PC
Others
iOS
47%
32%
15%
6%
Android
Black-
Berry
Others
Win 7
OS X
Win XP11%
12%30%
47%
IEOthers
Chrome
39%
27%
16%
18%
Firefox
UK
Socio-demographics
Population: 5.5 m
GDP per cap.: 30,718 €
Density: 100 Pop./km²
Internet: 107%
Mobile: 252%
Smartphone: 74%
Fixed: 36%
Market penetration
Top 3 operating systems
Top 3 browsers Top 3 websites
1. Google
2. Facebook
3. YouTube
Mobile PC
Others iOS
14%
36% 33%
17%
Android
Symbian
OS
Others
Win 7
Win 8
Win XP
10%
14%
19%
57%
IEOthers
Chrome
51%
24%
12%
13%
Firefox
UAE
Socio-demographics
Population: 77.1 m
GDP per cap.: 13,394 €
Density: 94 Pop./km²
Internet: 43%
Mobile: 84%
Smartphone: 30%
Fixed: 17%
Market penetration
Top 3 operating systems
Top 3 browsers Top 3 websites
1. Google
2. Facebook
3. YouTube
Mobile PC
Others iOS
18%
10%
59%
13%
Android
Series
40
Others
Win 7
Win 8
Win XP
8%
27%
6%
59%
IE
Others
Chrome
58%
26%9%
7%Firefox
Turkey
Socio-demographics
Population: 8.0 m
GDP per cap.: 38,958 €
Density: 195 Pop./km²
Internet: 80%
Mobile: 131%
Smartphone: 54%
Fixed: 55%
Market penetration
Top 3 operating systems
Top 3 browsers Top 3 websites
1. Google
2. Facebook
3. YouTube
Mobile PC
Others
iOS
63%
34%
2% 1%
Android
Win Others
Win 7
OS X
Win 8
21%
8%
24%
47%
IEOthers
Chrome
23%
29%
25%
23%
Firefox
Switzerland
Socio-demographics
Population: 9.2 m
GDP per cap.: 31,521 €
Density: 21 Pop./km²
Internet: 93%
Mobile: 128%
Smartphone: 63%
Fixed: 47%
Market penetration
Top 3 operating systems
Top 3 browsers Top 3 websites
1. Google
2. Facebook
3. YouTube
Mobile PC
Others
iOS
35%
62%
1% 2%
Android
Win Others
Win 7
OS X
Win 8
8%
13%
27%
52%
IEOthers
Chrome
40%
25%
19%
16%
Firefox
Sweden
Socio-demographics
Population: 46.7 m
GDP per cap.: 23,419 €
Density: 94 Pop./km²
Internet: 67%
Mobile: 107%
Smartphone: 55%
Fixed: 41%
Market penetration
Top 3 operating systems
Top 3 browsers Top 3 websites
1. Google
2. Facebook
3. YouTube
Mobile PC
Others
iOS
26%
69%
2%3%
Android
Win Others
Win 7
Win Vista
Win XP
22%
21%
8%
49%
IE
Others
Chrome
45%
21%
23%
11%
Firefox
Spain
Socio-demographics
Population: 50.0 m
GDP per cap.: 22,484 €
Density: 489 Pop./km²
Internet: 82%
Mobile: 110%
Smartphone: 73%
Fixed: 61%
Market penetration
Top 3 operating systems
Top 3 browsers Top 3 websites
1. Google
2. Facebook
3. YouTube
Mobile PC
Others
iOS
8%
90%
1%1%
Android
Linux Others
Win 7
Win 8
Win XP
25%
5% 4%
66%
IE
Others
Chrome
73%
21%
3%3%Firefox
South Korea
Socio-demographics
Population: 51.8 m
GDP per cap.: 8,351 €
Density: 41 Pop./km²
Internet: 17%
Mobile: 141%
Smartphone: 40%
Fixed: 8%
Market penetration
Top 3 operating systems
Top 3 browsers Top 3 websites
1. Google
2. Facebook
3. YouTube
Mobile PC
Others
Black-
Berry
15%
40%
21%
24%
Android
Series
40
Others
Win 7
Win 8
Win XP
15%
7%
21%
57%
IEOthers
Chrome
29%
40%
17%
14%
Firefox
South Africa
Socio-demographics
Population: 2.0 m
GDP per cap.: 20,070 €
Density: 100 Pop./km²
Internet: 72%
Mobile: 113%
Smartphone: 38%
Fixed: 41%
Market penetration
Top 3 operating systems
Top 3 browsers Top 3 websites
1. Google
2. Facebook
3. YouTube
Mobile PC
Others
iOS
19%
70%
3%
8%
Android
Win
Others
Win 7
Win 8
Win XP
6%
21%
14%
59%
IEOthers
Chrome
38%
18%
37%
7%
Firefox
Slovenia
Socio-demographics
Population: 5.5 m
GDP per cap.: 18,486 €
Density: 111 Pop./km²
Internet: 79%
Mobile: 111%
Smartphone: 46%
Fixed: 18%
Market penetration
Top 3 operating systems
Top 3 browsers Top 3 websites
1. Google
2. Facebook
3. YouTube
Mobile PC
Others
iOS
16%
68%
5% 11%
Android
Symbian
OS
Others
Win 7
Win 8
Win XP
7%
23%
13%
57%
IEOthers
Chrome
45%
13%
32%
10%
Firefox
Slovak Republic
Socio-demographics
Population: 28.4 m
GDP per cap.: 23,162 €
Density: 12 Pop./km²
Internet: 48%
Mobile: 197%
Smartphone: 73%
Fixed: 18%
Market penetration
Top 3 operating systems
Top 3 browsers Top 3 websites
1. Google
2. Facebook
3. YouTube
Mobile PC
Others
iOS
46%
18%
21%15%
Android
Symbian
OS
Others
Win 7
Win 8
Win XP
12%
9%
21%
58%
IEOthers
Chrome
49%
20%
14%
17%
Firefox
Saudi Arabia
Socio-demographics
Population: 143.3 m
GDP per cap.: 17,244 €
Density: 8 Pop./km²
Internet: 43%
Mobile: 156%
Smartphone: 36%
Fixed: 30%
Market penetration
Top 3 operating systems
Top 3 browsers Top 3 websites
1. Yandex
2. Vk
3. Google
Mobile PC
Others iOS
47%
28%
6%
19%
Android
Symbian
OS
Others
Win 7
Win 8
Win XP
25%
13%
5%
57%
IEOthers
Chrome
39%
16%
21%
24%
Firefox
Russia
Socio-demographics
Population: 10.6 m
GDP per cap.: 18,451 €
Density: 115 Pop./km²
Internet: 56%
Mobile: 117%
Smartphone: 32%
Fixed: 43%
Market penetration
Top 3 operating systems
Top 3 browsers Top 3 websites
1. Google
2. Facebook
3. YouTube
Mobile PC
Others
iOS
50%
36%
11%3%
Android
Symbian
OS
Others
Win 7
Win Vista
Win XP
12%
10%20%
58%
IE
Others
Chrome
51%
24%
16%
9%
Firefox
Portugal
Socio-demographics
Population: 38.4 m
GDP per cap.: 16,182 €
Density: 124 Pop./km²
Internet: 65%
Mobile: 132%
Smartphone: 35%
Fixed: 16%
Market penetration
Top 3 operating systems
Top 3 browsers Top 3 websites
1. Google
2. Facebook
3. YouTube
Mobile PCSymbian
OS
11%
67%
17%
5%
Android
Others
Series
40
Others
Win 7
Win Vista
Win XP
30%
8%11%
51%
IEOthers
Chrome
36%
11%
44%
9%
Firefox
Poland
Socio-demographics
Population: 5.0 m
GDP per cap.: 47,916 €
Density: 13 Pop./km²
Internet: 97%
Mobile: 121%
Smartphone: 68%
Fixed: 31%
Market penetration
Top 3 operating systems
Top 3 browsers Top 3 websites
1. Google
2. Facebook
3. YouTube
Mobile PC
Others
iOS
42% 55%
2% 1%
Android
Win Others
Win 7
OS X
Win 8
8%
14%
25%
53%
IEOthers
Chrome
36%
27%
18%
19%
Safari
Norway
Socio-demographics
Population: 4.4 m
GDP per cap.: 24,016 €
Density: 16 Pop./km²
Internet: 83%
Mobile: 113%
Smartphone: 54%
Fixed: 43%
Market penetration
Top 3 operating systems
Top 3 browsers Top 3 websites
1. Google
2. Facebook
3. YouTube
Mobile PC
Others
iOS
42% 53%
3% 2%
Android
Win Others
Win 7
OS X
Win XP
11%
14%
27%
48%
IEOthers
Chrome
40%
25%
17%
18%
Firefox
New Zealand
Socio-demographics
Population: 16.8 m
GDP per cap.: 31,497 €
Density: 402 Pop./km²
Internet: 93%
Mobile: 117%
Smartphone: 52%
Fixed: 42%
Market penetration
Top 3 operating systems
Top 3 browsers Top 3 websites
1. Google
2. Facebook
3. YouTube
Mobile PC
Others
iOS
51%
46%
2% 1%
Android
Win Others
Win 7
OS X
Win XP
11%
10%
31%
48%
IEOthers
Chrome
34%
32%
16%
18%
Safari
Netherlands
Socio-demographics
Population: 32.6 m
GDP per cap.: 3,790 €
Density: 72 Pop./km²
Internet: 50%
Mobile: 120%
Smartphone: 16%
Fixed: 10%
Market penetration
Top 3 operating systems
Top 3 browsers Top 3 websites
1. Google
2. Facebook
3. YouTube
Mobile PC
Others iOS
44%
20%
14%
22%
Android
Series
40
Others
Win 7
Win 8
Win XP
43%
8%
4%
45%
IE
Others
Chrome
56%
8%
30%
6%
Firefox
Morocco
Socio-demographics
Population: 112.3 m
GDP per cap.: 13,374 €
Density: 57 Pop./km²
Internet: 36%
Mobile: 87%
Smartphone: 37%
Fixed: 17%
Market penetration
Top 3 operating systems
Top 3 browsers Top 3 websites
1. Google
2. Facebook
3. YouTube
Mobile PC
Others iOS
55%
20%
8%
17%
Android
Series
40
Others
Win 7
Win 8
Win XP
8%
19%
16%
57%
IE
Others
Chrome
51%
27%
13%
9%
Firefox
Mexico
Win XPWin XP
Socio-demographics
Population: 0.5 m
GDP per cap.: 64,441 €
Density: 207 Pop./km²
Internet: 90%
Mobile: 148%
Smartphone: 29 %
Fixed: 52%
Market penetration
Top 3 operating systems
Top 3 browsers Top 3 websites
1. Google
2. Facebook
3. YouTube
Mobile PC
Others
iOS
61%
35%
2% 2%
Android
Win Others
Win 7
OS X
18%
12%
23%
47%
IEOthers
Chrome
27%
27%
27%
19%
Firefox
Luxembourg
Socio-demographics
Population: 3.0 m
GDP per cap.: 17,083 €
Density: 46 Pop./km²
Internet: 65%
Mobile: 142%
Smartphone: 31%
Fixed: 19%
Market penetration
Top 3 operating systems
Top 3 browsers Top 3 websites
1. Facebook
2. Google
3. YouTube
Mobile PC
Others iOS
14%
57%
12%
17%
Android
Series
40
Others
Win 7
Win 8
Win XP
5%
23%
9%
63%
IEOthers
Chrome
40%
15%
34%
11%
Firefox
Lithuania
Socio-demographics
Population: 2.0 m
GDP per cap.: 15,307 €
Density: 35 Pop./km²
Internet: 72%
Mobile: 106%
Smartphone: 39%
Fixed: 23%
Market penetration
Top 3 operating systems
Top 3 browsers Top 3 websites
1. Google
2. YouTube
3. Draugiem
Mobile PC
Others
iOS
22%
55%
7%
16%
Android
Symbian
OS
Others
Win 7
Win 8
Win XP
5%
24%
13%
58%
IEOthers
Chrome
45%
13%
32%
10%
Firefox
Latvia
Socio-demographics
Population: 126.7 m
GDP per cap.: 25,701 €
Density: 337 Pop./km²
Internet: 80%
Mobile: 109%
Smartphone: 25%
Fixed: 51%
Market penetration
Top 3 operating systems
Top 3 browsers Top 3 websites
1. Yahoo
2. Google
3. YouTube
Mobile PC
Others
iOS
56%43%
1%
Android
Others
Win 7
Win Vista
Win XP
14%
22%
10%
54%
Firefox
IE
Others
Chrome
23%
51%
13%
13%
Japan
Socio-demographics
Population: 59.9 m
GDP per cap.: 24,175 €
Density: 199 Pop./km²
Internet: 58%
Mobile: 158%
Smartphone: 41%
Fixed: 35%
Market penetration Top 3 browsers Top 3 websites
1. Google
2. Facebook
3. YouTube
Mobile PC
Others
iOS
37%
52%
5%
6%
Android
Others
Win 7
Win MacOS X
Win XP
20%
23%
8%
49%
Firefox
IE
Others
Chrome
44%
24%
12%
20%
Italy
Top 3 operating systems
Socio-demographics
Population: 8.1 m
GDP per cap.: 21,776 €
Density: 382 Pop./km²
Internet: 69%
Mobile: 120%
Smartphone: 57%
Fixed: 47%
Market penetration
Top 3 operating systems
Top 3 browsers Top 3 websites
1. Google
2. Facebook
3. YouTube
Mobile PC
Others
iOS
51%46%
3%
Android
Others
Win 7
Win 8
23%
8%
6%
63%
Firefox
IE
Others
Chrome
48%
38%
4%
10%
Israel
Win XP
Socio-demographics
Population: 4.8 m
GDP per cap.: 31,813 €
Density: 65 Pop./km²
Internet: 76%
Mobile: 103%
Smartphone: 57%
Fixed: 42%
Market penetration
Top 3 operating systems
Top 3 browsers Top 3 websites
1. Google
2. Facebook
3. YouTube
Mobile PC
Others
iOS
39%52%
4%
5%
Android
Win
Others
Win 7
Win Vista
Win XP
11%
9%
31%
49%
Firefox
IEOthers
Chrome
46%
21%
17%
16%
Ireland
Socio-demographics
Population: 1,220.8 m
GDP per cap.: 2,830 €
Density: 368 Pop./km²
Internet: 11%
Mobile: 73%
Smartphone: 13%
Fixed: 74%
Market penetration
Top 3 operating systems
Top 3 browsers Top 3 websites
1. Google
2. Facebook
3. YouTube
Mobile PC
Others Tizen
15%
33%
24%
28%
AndroidSeries
40
Others
Win 7
Win 8
Win XP
33%
7%8%
52%
Firefox
IE
Others
Chrome
53%
13%
29%
5%
India
Socio-demographics
Population: 9.9 m
GDP per cap.: 16,068 €
Density: 108 Pop./km²
Internet: 66%
Mobile: 117%
Smartphone: 34%
Fixed: 30%
Market penetration
Top 3 operating systems
Top 3 browsers Top 3 websites
1. Google
2. Facebook
3. YouTube
Mobile PC
Others
iOS
17%
66%
12%5%
Android
Win
Others
Win 7
Win 8
Win XP
38%
7%
3%
52%
Firefox
IEOthers
Chrome
41%
8%
41%
10%
Hungary
Socio-demographics
Population: 10.8 m
GDP per cap.: 18,476 €
Density: 82 Pop./km²
Internet: 53%
Mobile: 124%
Smartphone: 33%
Fixed: 51%
Market penetration
Top 3 operating systems
Top 3 browsers Top 3 websites
1. Google
2. Facebook
3. YouTube
Mobile PC
Others
iOS
29%
56%
10%5%
Android
Series
40
Others
Win 7
Win Vista
Win XP8%
27%
12%
53%
Firefox
IEOthers
Chrome
43%
18%
33%
6%
Greece
Socio-demographics
Population: 80.6 m
GDP per cap.: 30,099 €
Density: 226 Pop./km²
Internet: 83%
Mobile: 133%
Smartphone: 40%
Fixed: 62%
Market penetration
Top 3 operating systems
Top 3 browsers Top 3 websites
1. Google
2. Facebook
3. YouTube
Mobile PC
Others
iOS
33%
62%
3%2%
Android
Win
Others
Win 7
Win Vista
Win XP8%
15%23%
54%
Firefox
IEOthers
Chrome
24%
19%
45%
12%
Germany
Socio-demographics
Population: 66.0 m
GDP per cap.: 26,462 €
Density: 97 Pop./km²
Internet: 79%
Mobile: 94%
Smartphone: 42%
Fixed: 60%
Market penetration
Top 3 operating systems
Top 3 browsers Top 3 websites
1. Google
2. Facebook
3. YouTube
Mobile PC
Others
iOS
48%
43%
6%3%
Android
Win
Others
Win 7
Win Vista
Win XP10%
14%27%
49%
Firefox
IEOthers
Chrome
37%
22%
28%
13%
France
Socio-demographics
Population: 5.4 m
GDP per cap.: 27,946 €
Density: 16 Pop./km²
Internet: 89%
Mobile: 177%
Smartphone: 46%
Fixed: 17%
Market penetration
Top 3 operating systems
Top 3 browsers Top 3 websites
1. Google
2. Facebook
3. YouTube
Mobile PC
Others
iOS
35%
37%
23%
5%
Android
Win
Others
Win 7
OS X
Win XP10%
10%25%
55%
Firefox
IEOthers
Chrome
37%
16%
33%
14%
Finland
Socio-demographics
Population: 1.3 m
GDP per cap.: 17,246 €
Density: 30 Pop./km²
Internet: 78%
Mobile: 163%
Smartphone: 40%
Fixed: 35%
Market penetration
Top 3 operating systems
Top 3 browsers Top 3 websites
1. Google
2. Facebook
3. YouTube
Mobile PC
Others
iOS
23%
64%
7%
6%
Android
Win Others
Win 7
Win 8
Win XP
8%
18%
16%
58%
IE
Others
Chrome
43%
17%
30%
10%
Firefox
Estonia
Socio-demographics
Population: 85.3 m
GDP per cap.: 4,909 €
Density: 85 Pop./km²
Internet: 35%
Mobile: 113%
Smartphone: 26%
Fixed: 10%
Market penetration
Top 3 operating systems
Top 3 browsers Top 3 websites
1. Facebook
2. Google
3. YouTube
Mobile PC
Others Series
40
34%
35%
13%
18%
Android
Symbian
OS
Others
Win 7
Win 8
Win XP
42%
5% 5%
48%
IEOthers
Chrome
44%
11%
40%
5%
Firefox
Egypt
Socio-demographics
Population: 5.6 m
GDP per cap.: 30,788 €
Density: 130 Pop./km²
Internet: 90%
Mobile: 119%
Smartphone: 59%
Fixed: 44%
Market penetration
Top 3 operating systems
Top 3 browsers Top 3 websites
1. Google
2. Facebook
3. YouTube
Mobile PC
Others
iOS
67%
30%
1%2%
Android
Win Others
Win 7
OS X
Win 8
15%
9%
24%
52%
IE
Others
Chrome
37%
29%
19%
15%
Safari
Denmark
Socio-demographics
Population: 10.5 m
GDP per cap.: 19,495 €
Density: 133 Pop./km²
Internet: 73%
Mobile: 128%
Smartphone: 42%
Fixed: 21%
Market penetration
Top 3 operating systems
Top 3 browsers Top 3 websites
1. Google
2. Seznam
3. Facebook
Mobile PC
Others
iOS
19%
61%
14%
6%
Android
Symbian
OS
Others
Win 7
Win 8
Win XP
24%
14% 7%
55%
IE
Others
Chrome
38%
22%
10%
30%
Firefox
Czech Republic
Socio-demographics
Population: 1,349.6 m
GDP per cap.: 6,740 €
Density: 140 Pop./km²
Internet: 40%
Mobile: 82%
Smartphone: 47%
Fixed: 21%
Market penetration
Top 3 operating systems
Top 3 browsers Top 3 websites
1. Baidu
2. qq
3. Taobao
Mobile PC
Others
iOS
14%
77%
6%
3%
Android
Linux
Others
Win 7
Win 8
Win XP
55%
6% 2%
37%
IE
Others
Chrome
31%
47%
18%
4%
Firefox
China
Socio-demographics
Population: 16.6 m
GDP per cap.: 16,364 €
Density: 22 Pop./km²
Internet: 58%
Mobile: 140%
Smartphone: 30%
Fixed: 19%
Market penetration
Top 3 operating systems
Top 3 browsers Top 3 websites
1. Google
2. Facebook
3. YouTube
Mobile PC
Others
iOS
24%
66%
6%
4%
Android
Win Others
Win 7
Win 8
Win XP
10%
19%
10%
61%
IE
Others
Chrome
67%
15%12%
6%
Firefox
Chile
Socio-demographics
Population: 35.1 m
GDP per cap.: 30,262 €
Density: 3 Pop./km²
Internet: 82%
Mobile: 76%
Smartphone: 56%
Fixed: 52%
Market penetration
Top 3 operating systems
Top 3 browsers Top 3 websites
1. Google
2. Facebook
3. YouTube
Mobile PC
Others
iOS
63%
27%
2%
8%
Android
BlackBerry
Others
Win 7
OS X
Win XP
15%
12%
25%
48%
IEOthers
Chrome
35%
29%
19%
17%
Firefox
Canada
Socio-demographics
Population: 201.0 m
GDP per cap.: 8,694 €
Density: 23 Pop./km²
Internet: 41%
Mobile: 124%
Smartphone: 26%
Fixed: 22%
Market penetration
Top 3 operating systems
Top 3 browsers Top 3 websites
1. Facebook
2. Google
3. YouTube
Mobile PC
Others iOS
53%
16%
14%
17%
Android
Series
40
Others
Win 7
Win 8
Win XP
18%
10%
6%
66%
IEOthers
Chrome
65%
17%14%
4%
Firefox
Brazil
Socio-demographics
Population: 11.0 m
GDP per cap.: 29,250 €
Density: 362 Pop./km²
Internet: 81%
Mobile: 123%
Smartphone: 34%
Fixed: 44%
Market penetration
Top 3 operating systems
Top 3 browsers Top 3 websites
1. Google
2. Facebook
3. YouTube
Mobile PC
Others
iOS
51%39%
5%5%
Android
Win Others
Win 7
OS X
Win XP
11%
10%
26%
53%
IEOthers
Chrome
35%
31%
18%
16%
Belgium
Firefox
Socio-demographics
Population: 8.4 m
GDP per cap.: 32,009 €
Density: 101 Pop./km²
Internet: 75%
Mobile: 163%
Smartphone: 48%
Fixed: 25%
Market penetration
Top 3 operating systems
Top 3 browsers Top 3 websites
Mobile PC
Firefox
1. Google
2. Facebook
3. YouTube
IE
Others
Chrome
iOS
60%
27%
24%
36%
35%
Android
Austria
13%
Others
3%2%
Win Others
Win 7
OS X
Win XP
11%
11%
22%
56%
Socio-demographics
Population: 23.1 m
GDP per cap.: 32,535 €
Density: 3 Pop./km²
Internet: 56%
Mobile: 110%
Smartphone: 65%
Fixed: 47%
Market penetration
Top 3 operating systems
Top 3 browsers Top 3 websites
1. Google
2. Facebook
3. YouTube
Australia
Mobile PC
Others
iOS
66%31%
2%1%
Android
Win Others
Win 7
OS X
Win XP
17%
10%
25%
48%
Safari
IEOthers
Chrome
34%
27%
20%
19%
Socio-demographics
Population: 40.5 m
GDP per cap.: 8,785 €
Density: 14 Pop./km²
Internet: 32%
Mobile: 138%
Smartphone: 31%
Fixed: 24%
Market penetration
Top 3 operating systems
Top 3 browsers Top 3 websites
Mobile PC
Firefox
1. Google
2. Facebook
3. YouTube
IE
Others
Chrome
Series
40
Others
iOS
63%
63%
18%
16%
11%
19%
7%
Android
Others
Win 7
Win 8
Win XP
Argentina
32%
57%
4%
3%
7%
TELECOMMUNICATIONS OUTLOOK 2014
The OTT Challenge

Mais conteúdo relacionado

Mais procurados

5G Network Managament for Inteligent Transport Systems
5G Network Managament for Inteligent Transport Systems5G Network Managament for Inteligent Transport Systems
5G Network Managament for Inteligent Transport Systems
lebarka
 

Mais procurados (20)

Drivers for 5G
Drivers for 5GDrivers for 5G
Drivers for 5G
 
Learnings of how to simplifying io t solutions and securing business value
Learnings of how to simplifying io t solutions and securing business valueLearnings of how to simplifying io t solutions and securing business value
Learnings of how to simplifying io t solutions and securing business value
 
MNO, MVNO, MVNA, MVNE: Different types of mobile operators
MNO, MVNO, MVNA, MVNE: Different types of mobile operatorsMNO, MVNO, MVNA, MVNE: Different types of mobile operators
MNO, MVNO, MVNA, MVNE: Different types of mobile operators
 
5G-Technology Impact
5G-Technology Impact5G-Technology Impact
5G-Technology Impact
 
Telenity CANVAS API MANAGER Product Presentation 2015
Telenity CANVAS API MANAGER Product Presentation 2015Telenity CANVAS API MANAGER Product Presentation 2015
Telenity CANVAS API MANAGER Product Presentation 2015
 
new emerging technologies - 5g technology
new emerging technologies - 5g technologynew emerging technologies - 5g technology
new emerging technologies - 5g technology
 
Analysys Mason - the opportunity for LPWA solutions
Analysys Mason  - the opportunity for LPWA solutionsAnalysys Mason  - the opportunity for LPWA solutions
Analysys Mason - the opportunity for LPWA solutions
 
Nokia: Recent Deployment Stories
Nokia: Recent Deployment StoriesNokia: Recent Deployment Stories
Nokia: Recent Deployment Stories
 
Beginners: Different Types of Service Providers (SPs)
Beginners: Different Types of Service Providers (SPs)Beginners: Different Types of Service Providers (SPs)
Beginners: Different Types of Service Providers (SPs)
 
wimax
 wimax wimax
wimax
 
Huawei - Making the World Smaller with Small Cell
Huawei  - Making the World Smaller with Small CellHuawei  - Making the World Smaller with Small Cell
Huawei - Making the World Smaller with Small Cell
 
5G Wireless Technology
5G Wireless Technology5G Wireless Technology
5G Wireless Technology
 
5G Network Managament for Inteligent Transport Systems
5G Network Managament for Inteligent Transport Systems5G Network Managament for Inteligent Transport Systems
5G Network Managament for Inteligent Transport Systems
 
DWSPR19 Sessions plenieres 17042019 - 5G - Thierry BOISNON - Nokia
DWSPR19 Sessions plenieres 17042019 - 5G - Thierry BOISNON - Nokia DWSPR19 Sessions plenieres 17042019 - 5G - Thierry BOISNON - Nokia
DWSPR19 Sessions plenieres 17042019 - 5G - Thierry BOISNON - Nokia
 
5G Network and Telecom Costs | What's Next for Canada
5G Network and Telecom Costs | What's Next for Canada5G Network and Telecom Costs | What's Next for Canada
5G Network and Telecom Costs | What's Next for Canada
 
SmallCell Analyst Forecast Shootout
SmallCell Analyst Forecast ShootoutSmallCell Analyst Forecast Shootout
SmallCell Analyst Forecast Shootout
 
5G Networks - What's next for Broadband
5G Networks - What's next for Broadband5G Networks - What's next for Broadband
5G Networks - What's next for Broadband
 
Small cell 2020
Small cell 2020Small cell 2020
Small cell 2020
 
Unlicensed Spectrum Strategy
Unlicensed Spectrum StrategyUnlicensed Spectrum Strategy
Unlicensed Spectrum Strategy
 
 Connected Living - Embedded SIM & M2M
 Connected Living - Embedded SIM & M2M Connected Living - Embedded SIM & M2M
 Connected Living - Embedded SIM & M2M
 

Semelhante a The OTT Challenge - Telecommunications Outlook 2014

Telecom id v2_jaime
Telecom id v2_jaimeTelecom id v2_jaime
Telecom id v2_jaime
TELECOM I+D
 
Keynote - OSGi Service Enabler - Peter Möckel, Managing Director T-Labs, Deu...
Keynote - OSGi Service Enabler - Peter Möckel, Managing Director T-Labs, Deu...Keynote - OSGi Service Enabler - Peter Möckel, Managing Director T-Labs, Deu...
Keynote - OSGi Service Enabler - Peter Möckel, Managing Director T-Labs, Deu...
mfrancis
 
TOT and MBB Spectrum Requirements
TOT and MBB Spectrum Requirements TOT and MBB Spectrum Requirements
TOT and MBB Spectrum Requirements
TelecomJournal
 
NetIX - Moving Traffic to the Expressway Jan 2016
NetIX - Moving Traffic to the Expressway Jan 2016NetIX - Moving Traffic to the Expressway Jan 2016
NetIX - Moving Traffic to the Expressway Jan 2016
Ken Lefkowitz
 
Overview of Telecommunications 2007 -- WIPO 3rd Sept. 2007
Overview of Telecommunications 2007 -- WIPO 3rd Sept. 2007Overview of Telecommunications 2007 -- WIPO 3rd Sept. 2007
Overview of Telecommunications 2007 -- WIPO 3rd Sept. 2007
David L. Kreider, Esq. (???)
 

Semelhante a The OTT Challenge - Telecommunications Outlook 2014 (20)

To the 5th Generation? The Future of Mobile Communications
To the 5th Generation? The Future of Mobile CommunicationsTo the 5th Generation? The Future of Mobile Communications
To the 5th Generation? The Future of Mobile Communications
 
Impacts of 5G on Broadcasters and CSPs
Impacts of 5G on Broadcasters and CSPsImpacts of 5G on Broadcasters and CSPs
Impacts of 5G on Broadcasters and CSPs
 
Competition and regulation challenges in the Internet Value chain
Competition and regulation challenges in the Internet Value chainCompetition and regulation challenges in the Internet Value chain
Competition and regulation challenges in the Internet Value chain
 
Key IT and Digital Investment Areas Shaping the Industry.pdf
Key IT and Digital Investment Areas Shaping the Industry.pdfKey IT and Digital Investment Areas Shaping the Industry.pdf
Key IT and Digital Investment Areas Shaping the Industry.pdf
 
Delivering on the broadband promise: technology trends and institutional land...
Delivering on the broadband promise: technology trends and institutional land...Delivering on the broadband promise: technology trends and institutional land...
Delivering on the broadband promise: technology trends and institutional land...
 
Telecom id v2_jaime
Telecom id v2_jaimeTelecom id v2_jaime
Telecom id v2_jaime
 
IE essay application presentation
IE essay application presentationIE essay application presentation
IE essay application presentation
 
5G
5G5G
5G
 
Keynote - OSGi Service Enabler - Peter Möckel, Managing Director T-Labs, Deu...
Keynote - OSGi Service Enabler - Peter Möckel, Managing Director T-Labs, Deu...Keynote - OSGi Service Enabler - Peter Möckel, Managing Director T-Labs, Deu...
Keynote - OSGi Service Enabler - Peter Möckel, Managing Director T-Labs, Deu...
 
Verso IoT experience – What have we learned from implementations all over the...
Verso IoT experience – What have we learned from implementations all over the...Verso IoT experience – What have we learned from implementations all over the...
Verso IoT experience – What have we learned from implementations all over the...
 
UK Cloud Computing 2011
UK Cloud Computing 2011UK Cloud Computing 2011
UK Cloud Computing 2011
 
Focused technology choices - Analyst & Journalist Briefing 2014
Focused technology choices - Analyst & Journalist Briefing 2014Focused technology choices - Analyst & Journalist Briefing 2014
Focused technology choices - Analyst & Journalist Briefing 2014
 
Colt’s Carrier SDN & NFV: Experience, Learnings & Future Plans
Colt’s Carrier SDN & NFV: Experience, Learnings & Future PlansColt’s Carrier SDN & NFV: Experience, Learnings & Future Plans
Colt’s Carrier SDN & NFV: Experience, Learnings & Future Plans
 
TOT and MBB Spectrum Requirements
TOT and MBB Spectrum Requirements TOT and MBB Spectrum Requirements
TOT and MBB Spectrum Requirements
 
Discussing the digital transformation of every part of the network with nfv s...
Discussing the digital transformation of every part of the network with nfv s...Discussing the digital transformation of every part of the network with nfv s...
Discussing the digital transformation of every part of the network with nfv s...
 
WIMAX vs. LTE: Opportunities for Greenfield Operators
WIMAX vs. LTE: Opportunities for Greenfield OperatorsWIMAX vs. LTE: Opportunities for Greenfield Operators
WIMAX vs. LTE: Opportunities for Greenfield Operators
 
NetIX Moving Traffic to the Expressway 2016
NetIX Moving Traffic to the Expressway 2016NetIX Moving Traffic to the Expressway 2016
NetIX Moving Traffic to the Expressway 2016
 
NetIX - Moving Traffic to the Expressway Jan 2016
NetIX - Moving Traffic to the Expressway Jan 2016NetIX - Moving Traffic to the Expressway Jan 2016
NetIX - Moving Traffic to the Expressway Jan 2016
 
Overview of Telecommunications 2007 -- WIPO 3rd Sept. 2007
Overview of Telecommunications 2007 -- WIPO 3rd Sept. 2007Overview of Telecommunications 2007 -- WIPO 3rd Sept. 2007
Overview of Telecommunications 2007 -- WIPO 3rd Sept. 2007
 
5 g latin america april 2019 network densification requirements v1.0
5 g latin america april 2019   network densification requirements v1.05 g latin america april 2019   network densification requirements v1.0
5 g latin america april 2019 network densification requirements v1.0
 

Mais de BearingPoint

Mais de BearingPoint (12)

e-Sim Sharing (extract)
e-Sim Sharing (extract)e-Sim Sharing (extract)
e-Sim Sharing (extract)
 
Feb 2016 cem sharing extract_img
Feb 2016 cem sharing extract_imgFeb 2016 cem sharing extract_img
Feb 2016 cem sharing extract_img
 
Cme sharing io t extract blog img
Cme sharing  io t extract blog imgCme sharing  io t extract blog img
Cme sharing io t extract blog img
 
Smart city jd t article img
Smart city jd t article imgSmart city jd t article img
Smart city jd t article img
 
Dem jdn img
Dem jdn imgDem jdn img
Dem jdn img
 
Les services financiers sur mobile au service de l'inclusion financière l'exp...
Les services financiers sur mobile au service de l'inclusion financière l'exp...Les services financiers sur mobile au service de l'inclusion financière l'exp...
Les services financiers sur mobile au service de l'inclusion financière l'exp...
 
B1 mpaiement img
B1 mpaiement imgB1 mpaiement img
B1 mpaiement img
 
Monétisation de la data en afrique vjdt img
Monétisation de la data en afrique   vjdt imgMonétisation de la data en afrique   vjdt img
Monétisation de la data en afrique vjdt img
 
Wholesale 4 g img
Wholesale 4 g imgWholesale 4 g img
Wholesale 4 g img
 
Nfc2 img
Nfc2 imgNfc2 img
Nfc2 img
 
LTE Advanced - Rise of the Real 4G
LTE Advanced - Rise of the Real 4GLTE Advanced - Rise of the Real 4G
LTE Advanced - Rise of the Real 4G
 
Le téléphone mobile contre Ebola
Le téléphone mobile contre EbolaLe téléphone mobile contre Ebola
Le téléphone mobile contre Ebola
 

Último

Histor y of HAM Radio presentation slide
Histor y of HAM Radio presentation slideHistor y of HAM Radio presentation slide
Histor y of HAM Radio presentation slide
vu2urc
 

Último (20)

Apidays Singapore 2024 - Building Digital Trust in a Digital Economy by Veron...
Apidays Singapore 2024 - Building Digital Trust in a Digital Economy by Veron...Apidays Singapore 2024 - Building Digital Trust in a Digital Economy by Veron...
Apidays Singapore 2024 - Building Digital Trust in a Digital Economy by Veron...
 
Advantages of Hiring UIUX Design Service Providers for Your Business
Advantages of Hiring UIUX Design Service Providers for Your BusinessAdvantages of Hiring UIUX Design Service Providers for Your Business
Advantages of Hiring UIUX Design Service Providers for Your Business
 
Strategies for Landing an Oracle DBA Job as a Fresher
Strategies for Landing an Oracle DBA Job as a FresherStrategies for Landing an Oracle DBA Job as a Fresher
Strategies for Landing an Oracle DBA Job as a Fresher
 
Finology Group – Insurtech Innovation Award 2024
Finology Group – Insurtech Innovation Award 2024Finology Group – Insurtech Innovation Award 2024
Finology Group – Insurtech Innovation Award 2024
 
Driving Behavioral Change for Information Management through Data-Driven Gree...
Driving Behavioral Change for Information Management through Data-Driven Gree...Driving Behavioral Change for Information Management through Data-Driven Gree...
Driving Behavioral Change for Information Management through Data-Driven Gree...
 
Understanding Discord NSFW Servers A Guide for Responsible Users.pdf
Understanding Discord NSFW Servers A Guide for Responsible Users.pdfUnderstanding Discord NSFW Servers A Guide for Responsible Users.pdf
Understanding Discord NSFW Servers A Guide for Responsible Users.pdf
 
GenCyber Cyber Security Day Presentation
GenCyber Cyber Security Day PresentationGenCyber Cyber Security Day Presentation
GenCyber Cyber Security Day Presentation
 
Boost PC performance: How more available memory can improve productivity
Boost PC performance: How more available memory can improve productivityBoost PC performance: How more available memory can improve productivity
Boost PC performance: How more available memory can improve productivity
 
Real Time Object Detection Using Open CV
Real Time Object Detection Using Open CVReal Time Object Detection Using Open CV
Real Time Object Detection Using Open CV
 
AWS Community Day CPH - Three problems of Terraform
AWS Community Day CPH - Three problems of TerraformAWS Community Day CPH - Three problems of Terraform
AWS Community Day CPH - Three problems of Terraform
 
HTML Injection Attacks: Impact and Mitigation Strategies
HTML Injection Attacks: Impact and Mitigation StrategiesHTML Injection Attacks: Impact and Mitigation Strategies
HTML Injection Attacks: Impact and Mitigation Strategies
 
Handwritten Text Recognition for manuscripts and early printed texts
Handwritten Text Recognition for manuscripts and early printed textsHandwritten Text Recognition for manuscripts and early printed texts
Handwritten Text Recognition for manuscripts and early printed texts
 
[2024]Digital Global Overview Report 2024 Meltwater.pdf
[2024]Digital Global Overview Report 2024 Meltwater.pdf[2024]Digital Global Overview Report 2024 Meltwater.pdf
[2024]Digital Global Overview Report 2024 Meltwater.pdf
 
Bajaj Allianz Life Insurance Company - Insurer Innovation Award 2024
Bajaj Allianz Life Insurance Company - Insurer Innovation Award 2024Bajaj Allianz Life Insurance Company - Insurer Innovation Award 2024
Bajaj Allianz Life Insurance Company - Insurer Innovation Award 2024
 
What Are The Drone Anti-jamming Systems Technology?
What Are The Drone Anti-jamming Systems Technology?What Are The Drone Anti-jamming Systems Technology?
What Are The Drone Anti-jamming Systems Technology?
 
presentation ICT roal in 21st century education
presentation ICT roal in 21st century educationpresentation ICT roal in 21st century education
presentation ICT roal in 21st century education
 
Histor y of HAM Radio presentation slide
Histor y of HAM Radio presentation slideHistor y of HAM Radio presentation slide
Histor y of HAM Radio presentation slide
 
Mastering MySQL Database Architecture: Deep Dive into MySQL Shell and MySQL R...
Mastering MySQL Database Architecture: Deep Dive into MySQL Shell and MySQL R...Mastering MySQL Database Architecture: Deep Dive into MySQL Shell and MySQL R...
Mastering MySQL Database Architecture: Deep Dive into MySQL Shell and MySQL R...
 
Automating Google Workspace (GWS) & more with Apps Script
Automating Google Workspace (GWS) & more with Apps ScriptAutomating Google Workspace (GWS) & more with Apps Script
Automating Google Workspace (GWS) & more with Apps Script
 
From Event to Action: Accelerate Your Decision Making with Real-Time Automation
From Event to Action: Accelerate Your Decision Making with Real-Time AutomationFrom Event to Action: Accelerate Your Decision Making with Real-Time Automation
From Event to Action: Accelerate Your Decision Making with Real-Time Automation
 

The OTT Challenge - Telecommunications Outlook 2014

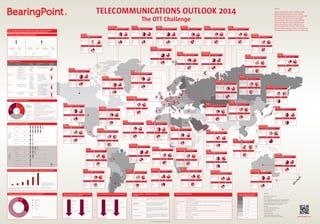
  • 1. © 2014 BearingPoint GmbH Sources BearingPoint Research CIA Factbook Cisco Visual Networking Index: Global Mobile Data Traffic Forecast Update, 2012-2013 Ericsson Mobility Report – on the Pulse of the Network Society – Nov. 2013 Fotolia OECD Broadband Statistics Provider Information United Nations World Bank Data Latest information available (Research completed in Feb. 2014) www.bearingpoint.com Contacts Austria | Gerhard Greiner, Partner | +43 664 37 69 488 Belgium | Mark Bartels, Partner | +31 6 11 95 5959 Netherlands | Mary Ann Quinn, Partner | +31 6 22 52 5901 France | Henri Tcheng, Partner | +33 6 09 24 2460 Germany | Markus Laqua, Partner | +49 173 6690 964 Ireland | Peter Minogue, Partner | +353 86 857 94 56 Nordics | Mika Niemela, Partner | +358 407 52 00 27 Russia | Konstantin Popov, Partner | +79 85 97 04 392 Switzerland | Vahan Guermann, Partner | +41 79 404 64 39 United Kingdom | James Rodger, Partner | +44 77 4865 4960OTT – content and services delivered via a telecommunication network without an operator being involved in the control or distribution OTT driven changes in customer relationship Before 2007 Now Contract (subscription) Pay-as- you-go Contract (subscription) Pay-as- you-go Contract (subscription) Pay-as- you-go M(V)NO M(V)NO OTT Prior to 2007 M(V)NO had an 1:1 relationship (on subscription or pay-as-you-go base) with subscriber. Now mobile smartphone user has in addition relationship with OTT (one or more). Payment models for OTT services Consumer does not pay any direct charge for the service delivered: • Basic services for free as "appetizer" • Advertisement integrated into service • OTT sells consumers' data (e. g. consumption habits to 3rd parties) Consumer has got either a prepaid account or pays per event (pay-as-you-go) e. g. per credit card Consumer pays occurring charges – e. g. monthly fee Any combination of above – e. g. monthly fee for basic service and pay-as-you-go for premium services Free or financed by advertisement Pay per use Subscription Hybrid Hybrid Pay per use Free/ adverti- sement Subscription Strategic options for telcos Measures to be taken • To exclude OTT services from network in order to reduce the necessary invest for infrastructure • To set up environment necessary to offer private services and contents, to introduce new services, which can compete with OTT providers • To prepare joint USP with OTT providers ensuring high quality of service (and guaranteed outstanding customer experience), joint customer access and revenue split • To act as an independent "bitpipe" offering different tariff models (e. g. reduction of bandwidth, once a subscriber has reached the data volume limit) and associated QoS Exclusion Introduction of own services Cooperation New tariff models Abbreviations & definitions BB Broadband ISP Internet Service Provider MNO Mobile Network Operator Petabyte 1015 bytes = 1,024 Terabytes QoS Quality of Service SaaS Software as a Service MVNO Mobile Network Virtual Operator (Not operating the network themselves) OTT Over-the-top CDN Content Delivery Network Exabyte 1018 bytes = 1,024 Petabytes FTTx FTTH – fiber to the home, FTTB – fiber to the building, FTTC – fiber to the cabinet Deep network caching Ability to cache content deep in CDN in order to improve customer experience and reduce transmission costs Global mobile data traffic in exabytes per month – between 2012 and 2017 0 2 4 6 8 10 12 2012 20142013 2015 2016 2017 Source: Cisco visual networking index: Global mobile data traffic forecast update, 2012-2017, Ericsson Mobility Report – on the puls of the network society – Nov. 2013, BearingPoint research Significant portion of this additional traffic will result from OTT services – potentially without additional revenue increase for MNOs >= 170% 140 – 169% 110 – 139% 80 – 109% 50 – 79% 0 – 49% Colour schema for countries – mobile market penetration Cost cutting through technology investments within existing access method • GSM/EDGE High costs per MB Low costs per MB • UMTS • LTE • LTE Advanced • ADSL • ADSL+ • VDSL • Vectoring Cost cutting through technology substitution High costs per MB Low costs per MB • LTE • Hotspots • WiFi to go (WLAN sharing) • xDSL • FTTx/coax • Messaging consumer- to-consumer • Voice consumer-to- consumer • Video consumer-to- consumer • WhatsApp • iMessage • Skype • Chaton • OTT services substitute Telco service portfolio • Increase Sample OTT services Communication • Linear content (live stream) • Non-linear content (content on demand) • YouTube • Netflix • Maxdome • Watchever • Lovefilm • Spotify • Napster • Consumer has got either a prepaid account or pays per event (pay-as-you-go) e. g. per credit card, PayPal etc. Content • Store in the cloud • Software as a Service • Dropbox • Microsoft Office 365 • Google Drive • Blizzard • Zynga • Bigpoint • OTT services substitute telco service portfolio in some areas • Generate additional demand for broadband (low-latency) access Cloud • Online gaming (peer to peer) • Generate additional demand for broadband (low-latency) access Gaming Area Services Provider (selection) Impact on telco revenue Impact on data traffic • Increase • Increase • Increase Global mobile data traffic by content type – split for 2017 File sharing M2M Web/data Video Source: Cisco visual networking index: Global mobile data traffic forecast update, 2012-2017 3% 5% 25% 67% Market footprint OTTs and MNOs Facebook 1.100 YouTube 1.000 Skype 330 WhatsApp 300 Twitter 300 China Mobile 750 Singtel 484 Vodafone 454 América Móvil 252 Telefónica 250 SelectedOTTs (inmusers) Top5MNOs (inmsubscribers) = 200 m Socio-demographics Population: 317.2 m GDP per cap.: 37,733 € Density: 33 Pop./km² Internet: 77% Mobile: 98% Smartphone: 56% Fixed: 44% Market penetration Top 3 operating systems Top 3 browsers Top 3 websites 1. Google 2. Facebook 3. YouTube Mobile PC Others iOS 40% 52% 3%5% Android Black- Berry Others Win 7 OS X Win XP 14% 13% 26% 47% IEOthers Chrome 35% 30% 17% 18% Firefox USA Socio-demographics Population: 63.4 m GDP per cap.: 27,336 € Density: 259 Pop./km² Internet: 83% Mobile: 130% Smartphone: 62% Fixed: 52% Market penetration Top 3 operating systems Top 3 browsers Top 3 websites 1. Google 2. Facebook 3. YouTube Mobile PC Others iOS 47% 32% 15% 6% Android Black- Berry Others Win 7 OS X Win XP11% 12%30% 47% IEOthers Chrome 39% 27% 16% 18% Firefox UK Socio-demographics Population: 5.5 m GDP per cap.: 30,718 € Density: 100 Pop./km² Internet: 107% Mobile: 252% Smartphone: 74% Fixed: 36% Market penetration Top 3 operating systems Top 3 browsers Top 3 websites 1. Google 2. Facebook 3. YouTube Mobile PC Others iOS 14% 36% 33% 17% Android Symbian OS Others Win 7 Win 8 Win XP 10% 14% 19% 57% IEOthers Chrome 51% 24% 12% 13% Firefox UAE Socio-demographics Population: 77.1 m GDP per cap.: 13,394 € Density: 94 Pop./km² Internet: 43% Mobile: 84% Smartphone: 30% Fixed: 17% Market penetration Top 3 operating systems Top 3 browsers Top 3 websites 1. Google 2. Facebook 3. YouTube Mobile PC Others iOS 18% 10% 59% 13% Android Series 40 Others Win 7 Win 8 Win XP 8% 27% 6% 59% IE Others Chrome 58% 26%9% 7%Firefox Turkey Socio-demographics Population: 8.0 m GDP per cap.: 38,958 € Density: 195 Pop./km² Internet: 80% Mobile: 131% Smartphone: 54% Fixed: 55% Market penetration Top 3 operating systems Top 3 browsers Top 3 websites 1. Google 2. Facebook 3. YouTube Mobile PC Others iOS 63% 34% 2% 1% Android Win Others Win 7 OS X Win 8 21% 8% 24% 47% IEOthers Chrome 23% 29% 25% 23% Firefox Switzerland Socio-demographics Population: 9.2 m GDP per cap.: 31,521 € Density: 21 Pop./km² Internet: 93% Mobile: 128% Smartphone: 63% Fixed: 47% Market penetration Top 3 operating systems Top 3 browsers Top 3 websites 1. Google 2. Facebook 3. YouTube Mobile PC Others iOS 35% 62% 1% 2% Android Win Others Win 7 OS X Win 8 8% 13% 27% 52% IEOthers Chrome 40% 25% 19% 16% Firefox Sweden Socio-demographics Population: 46.7 m GDP per cap.: 23,419 € Density: 94 Pop./km² Internet: 67% Mobile: 107% Smartphone: 55% Fixed: 41% Market penetration Top 3 operating systems Top 3 browsers Top 3 websites 1. Google 2. Facebook 3. YouTube Mobile PC Others iOS 26% 69% 2%3% Android Win Others Win 7 Win Vista Win XP 22% 21% 8% 49% IE Others Chrome 45% 21% 23% 11% Firefox Spain Socio-demographics Population: 50.0 m GDP per cap.: 22,484 € Density: 489 Pop./km² Internet: 82% Mobile: 110% Smartphone: 73% Fixed: 61% Market penetration Top 3 operating systems Top 3 browsers Top 3 websites 1. Google 2. Facebook 3. YouTube Mobile PC Others iOS 8% 90% 1%1% Android Linux Others Win 7 Win 8 Win XP 25% 5% 4% 66% IE Others Chrome 73% 21% 3%3%Firefox South Korea Socio-demographics Population: 51.8 m GDP per cap.: 8,351 € Density: 41 Pop./km² Internet: 17% Mobile: 141% Smartphone: 40% Fixed: 8% Market penetration Top 3 operating systems Top 3 browsers Top 3 websites 1. Google 2. Facebook 3. YouTube Mobile PC Others Black- Berry 15% 40% 21% 24% Android Series 40 Others Win 7 Win 8 Win XP 15% 7% 21% 57% IEOthers Chrome 29% 40% 17% 14% Firefox South Africa Socio-demographics Population: 2.0 m GDP per cap.: 20,070 € Density: 100 Pop./km² Internet: 72% Mobile: 113% Smartphone: 38% Fixed: 41% Market penetration Top 3 operating systems Top 3 browsers Top 3 websites 1. Google 2. Facebook 3. YouTube Mobile PC Others iOS 19% 70% 3% 8% Android Win Others Win 7 Win 8 Win XP 6% 21% 14% 59% IEOthers Chrome 38% 18% 37% 7% Firefox Slovenia Socio-demographics Population: 5.5 m GDP per cap.: 18,486 € Density: 111 Pop./km² Internet: 79% Mobile: 111% Smartphone: 46% Fixed: 18% Market penetration Top 3 operating systems Top 3 browsers Top 3 websites 1. Google 2. Facebook 3. YouTube Mobile PC Others iOS 16% 68% 5% 11% Android Symbian OS Others Win 7 Win 8 Win XP 7% 23% 13% 57% IEOthers Chrome 45% 13% 32% 10% Firefox Slovak Republic Socio-demographics Population: 28.4 m GDP per cap.: 23,162 € Density: 12 Pop./km² Internet: 48% Mobile: 197% Smartphone: 73% Fixed: 18% Market penetration Top 3 operating systems Top 3 browsers Top 3 websites 1. Google 2. Facebook 3. YouTube Mobile PC Others iOS 46% 18% 21%15% Android Symbian OS Others Win 7 Win 8 Win XP 12% 9% 21% 58% IEOthers Chrome 49% 20% 14% 17% Firefox Saudi Arabia Socio-demographics Population: 143.3 m GDP per cap.: 17,244 € Density: 8 Pop./km² Internet: 43% Mobile: 156% Smartphone: 36% Fixed: 30% Market penetration Top 3 operating systems Top 3 browsers Top 3 websites 1. Yandex 2. Vk 3. Google Mobile PC Others iOS 47% 28% 6% 19% Android Symbian OS Others Win 7 Win 8 Win XP 25% 13% 5% 57% IEOthers Chrome 39% 16% 21% 24% Firefox Russia Socio-demographics Population: 10.6 m GDP per cap.: 18,451 € Density: 115 Pop./km² Internet: 56% Mobile: 117% Smartphone: 32% Fixed: 43% Market penetration Top 3 operating systems Top 3 browsers Top 3 websites 1. Google 2. Facebook 3. YouTube Mobile PC Others iOS 50% 36% 11%3% Android Symbian OS Others Win 7 Win Vista Win XP 12% 10%20% 58% IE Others Chrome 51% 24% 16% 9% Firefox Portugal Socio-demographics Population: 38.4 m GDP per cap.: 16,182 € Density: 124 Pop./km² Internet: 65% Mobile: 132% Smartphone: 35% Fixed: 16% Market penetration Top 3 operating systems Top 3 browsers Top 3 websites 1. Google 2. Facebook 3. YouTube Mobile PCSymbian OS 11% 67% 17% 5% Android Others Series 40 Others Win 7 Win Vista Win XP 30% 8%11% 51% IEOthers Chrome 36% 11% 44% 9% Firefox Poland Socio-demographics Population: 5.0 m GDP per cap.: 47,916 € Density: 13 Pop./km² Internet: 97% Mobile: 121% Smartphone: 68% Fixed: 31% Market penetration Top 3 operating systems Top 3 browsers Top 3 websites 1. Google 2. Facebook 3. YouTube Mobile PC Others iOS 42% 55% 2% 1% Android Win Others Win 7 OS X Win 8 8% 14% 25% 53% IEOthers Chrome 36% 27% 18% 19% Safari Norway Socio-demographics Population: 4.4 m GDP per cap.: 24,016 € Density: 16 Pop./km² Internet: 83% Mobile: 113% Smartphone: 54% Fixed: 43% Market penetration Top 3 operating systems Top 3 browsers Top 3 websites 1. Google 2. Facebook 3. YouTube Mobile PC Others iOS 42% 53% 3% 2% Android Win Others Win 7 OS X Win XP 11% 14% 27% 48% IEOthers Chrome 40% 25% 17% 18% Firefox New Zealand Socio-demographics Population: 16.8 m GDP per cap.: 31,497 € Density: 402 Pop./km² Internet: 93% Mobile: 117% Smartphone: 52% Fixed: 42% Market penetration Top 3 operating systems Top 3 browsers Top 3 websites 1. Google 2. Facebook 3. YouTube Mobile PC Others iOS 51% 46% 2% 1% Android Win Others Win 7 OS X Win XP 11% 10% 31% 48% IEOthers Chrome 34% 32% 16% 18% Safari Netherlands Socio-demographics Population: 32.6 m GDP per cap.: 3,790 € Density: 72 Pop./km² Internet: 50% Mobile: 120% Smartphone: 16% Fixed: 10% Market penetration Top 3 operating systems Top 3 browsers Top 3 websites 1. Google 2. Facebook 3. YouTube Mobile PC Others iOS 44% 20% 14% 22% Android Series 40 Others Win 7 Win 8 Win XP 43% 8% 4% 45% IE Others Chrome 56% 8% 30% 6% Firefox Morocco Socio-demographics Population: 112.3 m GDP per cap.: 13,374 € Density: 57 Pop./km² Internet: 36% Mobile: 87% Smartphone: 37% Fixed: 17% Market penetration Top 3 operating systems Top 3 browsers Top 3 websites 1. Google 2. Facebook 3. YouTube Mobile PC Others iOS 55% 20% 8% 17% Android Series 40 Others Win 7 Win 8 Win XP 8% 19% 16% 57% IE Others Chrome 51% 27% 13% 9% Firefox Mexico Win XPWin XP Socio-demographics Population: 0.5 m GDP per cap.: 64,441 € Density: 207 Pop./km² Internet: 90% Mobile: 148% Smartphone: 29 % Fixed: 52% Market penetration Top 3 operating systems Top 3 browsers Top 3 websites 1. Google 2. Facebook 3. YouTube Mobile PC Others iOS 61% 35% 2% 2% Android Win Others Win 7 OS X 18% 12% 23% 47% IEOthers Chrome 27% 27% 27% 19% Firefox Luxembourg Socio-demographics Population: 3.0 m GDP per cap.: 17,083 € Density: 46 Pop./km² Internet: 65% Mobile: 142% Smartphone: 31% Fixed: 19% Market penetration Top 3 operating systems Top 3 browsers Top 3 websites 1. Facebook 2. Google 3. YouTube Mobile PC Others iOS 14% 57% 12% 17% Android Series 40 Others Win 7 Win 8 Win XP 5% 23% 9% 63% IEOthers Chrome 40% 15% 34% 11% Firefox Lithuania Socio-demographics Population: 2.0 m GDP per cap.: 15,307 € Density: 35 Pop./km² Internet: 72% Mobile: 106% Smartphone: 39% Fixed: 23% Market penetration Top 3 operating systems Top 3 browsers Top 3 websites 1. Google 2. YouTube 3. Draugiem Mobile PC Others iOS 22% 55% 7% 16% Android Symbian OS Others Win 7 Win 8 Win XP 5% 24% 13% 58% IEOthers Chrome 45% 13% 32% 10% Firefox Latvia Socio-demographics Population: 126.7 m GDP per cap.: 25,701 € Density: 337 Pop./km² Internet: 80% Mobile: 109% Smartphone: 25% Fixed: 51% Market penetration Top 3 operating systems Top 3 browsers Top 3 websites 1. Yahoo 2. Google 3. YouTube Mobile PC Others iOS 56%43% 1% Android Others Win 7 Win Vista Win XP 14% 22% 10% 54% Firefox IE Others Chrome 23% 51% 13% 13% Japan Socio-demographics Population: 59.9 m GDP per cap.: 24,175 € Density: 199 Pop./km² Internet: 58% Mobile: 158% Smartphone: 41% Fixed: 35% Market penetration Top 3 browsers Top 3 websites 1. Google 2. Facebook 3. YouTube Mobile PC Others iOS 37% 52% 5% 6% Android Others Win 7 Win MacOS X Win XP 20% 23% 8% 49% Firefox IE Others Chrome 44% 24% 12% 20% Italy Top 3 operating systems Socio-demographics Population: 8.1 m GDP per cap.: 21,776 € Density: 382 Pop./km² Internet: 69% Mobile: 120% Smartphone: 57% Fixed: 47% Market penetration Top 3 operating systems Top 3 browsers Top 3 websites 1. Google 2. Facebook 3. YouTube Mobile PC Others iOS 51%46% 3% Android Others Win 7 Win 8 23% 8% 6% 63% Firefox IE Others Chrome 48% 38% 4% 10% Israel Win XP Socio-demographics Population: 4.8 m GDP per cap.: 31,813 € Density: 65 Pop./km² Internet: 76% Mobile: 103% Smartphone: 57% Fixed: 42% Market penetration Top 3 operating systems Top 3 browsers Top 3 websites 1. Google 2. Facebook 3. YouTube Mobile PC Others iOS 39%52% 4% 5% Android Win Others Win 7 Win Vista Win XP 11% 9% 31% 49% Firefox IEOthers Chrome 46% 21% 17% 16% Ireland Socio-demographics Population: 1,220.8 m GDP per cap.: 2,830 € Density: 368 Pop./km² Internet: 11% Mobile: 73% Smartphone: 13% Fixed: 74% Market penetration Top 3 operating systems Top 3 browsers Top 3 websites 1. Google 2. Facebook 3. YouTube Mobile PC Others Tizen 15% 33% 24% 28% AndroidSeries 40 Others Win 7 Win 8 Win XP 33% 7%8% 52% Firefox IE Others Chrome 53% 13% 29% 5% India Socio-demographics Population: 9.9 m GDP per cap.: 16,068 € Density: 108 Pop./km² Internet: 66% Mobile: 117% Smartphone: 34% Fixed: 30% Market penetration Top 3 operating systems Top 3 browsers Top 3 websites 1. Google 2. Facebook 3. YouTube Mobile PC Others iOS 17% 66% 12%5% Android Win Others Win 7 Win 8 Win XP 38% 7% 3% 52% Firefox IEOthers Chrome 41% 8% 41% 10% Hungary Socio-demographics Population: 10.8 m GDP per cap.: 18,476 € Density: 82 Pop./km² Internet: 53% Mobile: 124% Smartphone: 33% Fixed: 51% Market penetration Top 3 operating systems Top 3 browsers Top 3 websites 1. Google 2. Facebook 3. YouTube Mobile PC Others iOS 29% 56% 10%5% Android Series 40 Others Win 7 Win Vista Win XP8% 27% 12% 53% Firefox IEOthers Chrome 43% 18% 33% 6% Greece Socio-demographics Population: 80.6 m GDP per cap.: 30,099 € Density: 226 Pop./km² Internet: 83% Mobile: 133% Smartphone: 40% Fixed: 62% Market penetration Top 3 operating systems Top 3 browsers Top 3 websites 1. Google 2. Facebook 3. YouTube Mobile PC Others iOS 33% 62% 3%2% Android Win Others Win 7 Win Vista Win XP8% 15%23% 54% Firefox IEOthers Chrome 24% 19% 45% 12% Germany Socio-demographics Population: 66.0 m GDP per cap.: 26,462 € Density: 97 Pop./km² Internet: 79% Mobile: 94% Smartphone: 42% Fixed: 60% Market penetration Top 3 operating systems Top 3 browsers Top 3 websites 1. Google 2. Facebook 3. YouTube Mobile PC Others iOS 48% 43% 6%3% Android Win Others Win 7 Win Vista Win XP10% 14%27% 49% Firefox IEOthers Chrome 37% 22% 28% 13% France Socio-demographics Population: 5.4 m GDP per cap.: 27,946 € Density: 16 Pop./km² Internet: 89% Mobile: 177% Smartphone: 46% Fixed: 17% Market penetration Top 3 operating systems Top 3 browsers Top 3 websites 1. Google 2. Facebook 3. YouTube Mobile PC Others iOS 35% 37% 23% 5% Android Win Others Win 7 OS X Win XP10% 10%25% 55% Firefox IEOthers Chrome 37% 16% 33% 14% Finland Socio-demographics Population: 1.3 m GDP per cap.: 17,246 € Density: 30 Pop./km² Internet: 78% Mobile: 163% Smartphone: 40% Fixed: 35% Market penetration Top 3 operating systems Top 3 browsers Top 3 websites 1. Google 2. Facebook 3. YouTube Mobile PC Others iOS 23% 64% 7% 6% Android Win Others Win 7 Win 8 Win XP 8% 18% 16% 58% IE Others Chrome 43% 17% 30% 10% Firefox Estonia Socio-demographics Population: 85.3 m GDP per cap.: 4,909 € Density: 85 Pop./km² Internet: 35% Mobile: 113% Smartphone: 26% Fixed: 10% Market penetration Top 3 operating systems Top 3 browsers Top 3 websites 1. Facebook 2. Google 3. YouTube Mobile PC Others Series 40 34% 35% 13% 18% Android Symbian OS Others Win 7 Win 8 Win XP 42% 5% 5% 48% IEOthers Chrome 44% 11% 40% 5% Firefox Egypt Socio-demographics Population: 5.6 m GDP per cap.: 30,788 € Density: 130 Pop./km² Internet: 90% Mobile: 119% Smartphone: 59% Fixed: 44% Market penetration Top 3 operating systems Top 3 browsers Top 3 websites 1. Google 2. Facebook 3. YouTube Mobile PC Others iOS 67% 30% 1%2% Android Win Others Win 7 OS X Win 8 15% 9% 24% 52% IE Others Chrome 37% 29% 19% 15% Safari Denmark Socio-demographics Population: 10.5 m GDP per cap.: 19,495 € Density: 133 Pop./km² Internet: 73% Mobile: 128% Smartphone: 42% Fixed: 21% Market penetration Top 3 operating systems Top 3 browsers Top 3 websites 1. Google 2. Seznam 3. Facebook Mobile PC Others iOS 19% 61% 14% 6% Android Symbian OS Others Win 7 Win 8 Win XP 24% 14% 7% 55% IE Others Chrome 38% 22% 10% 30% Firefox Czech Republic Socio-demographics Population: 1,349.6 m GDP per cap.: 6,740 € Density: 140 Pop./km² Internet: 40% Mobile: 82% Smartphone: 47% Fixed: 21% Market penetration Top 3 operating systems Top 3 browsers Top 3 websites 1. Baidu 2. qq 3. Taobao Mobile PC Others iOS 14% 77% 6% 3% Android Linux Others Win 7 Win 8 Win XP 55% 6% 2% 37% IE Others Chrome 31% 47% 18% 4% Firefox China Socio-demographics Population: 16.6 m GDP per cap.: 16,364 € Density: 22 Pop./km² Internet: 58% Mobile: 140% Smartphone: 30% Fixed: 19% Market penetration Top 3 operating systems Top 3 browsers Top 3 websites 1. Google 2. Facebook 3. YouTube Mobile PC Others iOS 24% 66% 6% 4% Android Win Others Win 7 Win 8 Win XP 10% 19% 10% 61% IE Others Chrome 67% 15%12% 6% Firefox Chile Socio-demographics Population: 35.1 m GDP per cap.: 30,262 € Density: 3 Pop./km² Internet: 82% Mobile: 76% Smartphone: 56% Fixed: 52% Market penetration Top 3 operating systems Top 3 browsers Top 3 websites 1. Google 2. Facebook 3. YouTube Mobile PC Others iOS 63% 27% 2% 8% Android BlackBerry Others Win 7 OS X Win XP 15% 12% 25% 48% IEOthers Chrome 35% 29% 19% 17% Firefox Canada Socio-demographics Population: 201.0 m GDP per cap.: 8,694 € Density: 23 Pop./km² Internet: 41% Mobile: 124% Smartphone: 26% Fixed: 22% Market penetration Top 3 operating systems Top 3 browsers Top 3 websites 1. Facebook 2. Google 3. YouTube Mobile PC Others iOS 53% 16% 14% 17% Android Series 40 Others Win 7 Win 8 Win XP 18% 10% 6% 66% IEOthers Chrome 65% 17%14% 4% Firefox Brazil Socio-demographics Population: 11.0 m GDP per cap.: 29,250 € Density: 362 Pop./km² Internet: 81% Mobile: 123% Smartphone: 34% Fixed: 44% Market penetration Top 3 operating systems Top 3 browsers Top 3 websites 1. Google 2. Facebook 3. YouTube Mobile PC Others iOS 51%39% 5%5% Android Win Others Win 7 OS X Win XP 11% 10% 26% 53% IEOthers Chrome 35% 31% 18% 16% Belgium Firefox Socio-demographics Population: 8.4 m GDP per cap.: 32,009 € Density: 101 Pop./km² Internet: 75% Mobile: 163% Smartphone: 48% Fixed: 25% Market penetration Top 3 operating systems Top 3 browsers Top 3 websites Mobile PC Firefox 1. Google 2. Facebook 3. YouTube IE Others Chrome iOS 60% 27% 24% 36% 35% Android Austria 13% Others 3%2% Win Others Win 7 OS X Win XP 11% 11% 22% 56% Socio-demographics Population: 23.1 m GDP per cap.: 32,535 € Density: 3 Pop./km² Internet: 56% Mobile: 110% Smartphone: 65% Fixed: 47% Market penetration Top 3 operating systems Top 3 browsers Top 3 websites 1. Google 2. Facebook 3. YouTube Australia Mobile PC Others iOS 66%31% 2%1% Android Win Others Win 7 OS X Win XP 17% 10% 25% 48% Safari IEOthers Chrome 34% 27% 20% 19% Socio-demographics Population: 40.5 m GDP per cap.: 8,785 € Density: 14 Pop./km² Internet: 32% Mobile: 138% Smartphone: 31% Fixed: 24% Market penetration Top 3 operating systems Top 3 browsers Top 3 websites Mobile PC Firefox 1. Google 2. Facebook 3. YouTube IE Others Chrome Series 40 Others iOS 63% 63% 18% 16% 11% 19% 7% Android Others Win 7 Win 8 Win XP Argentina 32% 57% 4% 3% 7% TELECOMMUNICATIONS OUTLOOK 2014 The OTT Challenge