Bay Area Economic Profile Chapter 3
•
0 gostou•3,560 visualizações

These exhibits from the third chapter of the 10th Bay Area Economic Profile, published in 2018, detail some of the challenges facing our regional economy in areas from housing to transportation to human well-being.

Recomendados
Recomendados
Mais conteúdo relacionado
Semelhante a Bay Area Economic Profile Chapter 3
Semelhante a Bay Area Economic Profile Chapter 3 (20)
Último
Último (20)
Bay Area Economic Profile Chapter 3
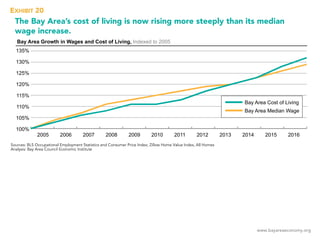
- 1. www.bayareaeconomy.org The Bay Area’s cost of living is now rising more steeply than its median wage increase. Bay Area Growth in Wages and Cost of Living, Indexed to 2005 100% 105% 110% 115% 120% 125% 130% 135% 201620152014201320122011201020092008200720062005 Bay Area Cost of Living Bay Area Median Wage EXHIBIT 20 Sources: BLS Occupational Employment Statistics and Consumer Price Index; Zillow Home Value Index, All Homes Analysis: Bay Area Council Economic Institute
- 2. www.bayareaeconomy.org Population growth is the only area where the Bay Area lags peer regions. The regional economy’s fast recent growth is based largely on industry mix, not an ability to attract new workers. Wages Population Household Income Employment Productivity Income Per Capita 2009–2014 Bay Area 8.5% 1.6% 4.5% 2.6% 2.8% 1.5% 6.2% Peer Average 4.6% 2014– 2017 Bay Area 6.1% 0.8% 4.3% 5.7% 2.9% 1.3% 5.1% Peer Average 3.2% 1.0% 2.5% 3.2% 2.2% 0.3% 2.7% GDP Compound Annual Growth Rates, CAGR % 4.6% 1.4% 3.1% 0.9% 2.1% 1.0% EXHIBIT 21 Note: Included peer regions are New York, Los Angeles, Austin, Dallas, Boston, Seattle, and San Diego. Source: Moody’s Analytics Analysis: Bay Area Economic Institute and McKinsey & Company
- 3. www.bayareaeconomy.org The Bay Area builds fewer homes per 1,000-person increase in population than other peer regions. Ratio of Housing Units Permitted Per 1,000-Person Increase in Population,2003–2017 0 50 100 150 200 250 300 350 400 450 Bay Area Denver Austin Houston Atlanta New York Seattle Boston Population Growth: 390,632 Population Growth: 741,213 Population Growth: 1,717,766 Population Growth: 1,355,480 Population Growth: 1,906,028 Population Growth: 766,536 Population Growth: 648,471 Population Growth: 794,015 Units Permitted: 173,989 Units Permitted: 302,606 Units Permitted: 694,056 Units Permitted: 533,266 Units Permitted: 741,172 Units Permitted: 272,545 Units Permitted: 224,794 Units Permitted: 247,813 445 408 404 393 389 356 347 312 EXHIBIT 22 Source: U.S. Census Bureau Building Permits Survey and U.S. Census Bureau Metropolitan and Micropolitan Data Analysis: Bay Area Council Economic Institute
- 4. www.bayareaeconomy.org The Bay Area’s percentages of housing-cost-burdened households are exceeded only by Los Angeles and the New York Metro. EXHIBIT 23 Source: U.S. Census Bureau American Community Survey Analysis: Bay Area Council Economic Institute
- 5. www.bayareaeconomy.org Shown in red on the map, 63,500 acres of the Bay Area’s open space are at high risk of development. EXHIBIT 24 Source: Adapted from Greenbelt Alliance, At Risk: The Bay Area Greenbelt, January 2017
- 6. www.bayareaeconomy.org California is off track in the race to meet its 2030 and 2050 climate goals. California Total Greenhouse Gas Emissions, MMtCO2e per year 1990 2000 2010 2020 2030 2040 2050 300 500 450 400 350 250 200 150 100 50 0 2020 Target 2030 Goal 2050 Goal Current Trajectory EXHIBIT 25 Note: MMtCO2e = million metric tons of carbon dioxide equivalents Source: California Air Resources Board Analysis: Bay Area Council Economic Institute
- 7. www.bayareaeconomy.org Median household incomes are substantially higher within the Bay Area’s inner core than they are across the broader Northern California Megaregion. EXHIBIT 26 Source: U.S. Census Bureau American Community Survey 2016 Analysis: Bay Area Council Economic Institute Santa Rosa San Rafael San Francisco Oakland Berkeley Concord Hayward Fremont San Jose Sunnyvale San Mateo Vallejo Fairfield Vacaville Napa Gilroy MedianHousehold Income intheBayArea, 2016 More than $82,000 $53,001 - $68,000 $68,001 - $82,000 $24,000 or less $24,001 - $39,000 $39,001 - $53,000 San Francisco Merced Los Banos Soledad Salinas Watsonville GilroySanta Cruz Fremont San JoseSunnyvale San Rafael San Mateo Concord Napa Santa Rosa Oakland Manteca Stockton Hayward Modesto Sacramento Galt Vacaville Fairfield Vallejo Berkeley King City South Lake Tahoe More than $82,000 $53,001 - $68,000 $68,001 - $82,000 $24,000 or less $24,001 - $39,000 $39,001 - $53,000 Median Household Income in the Northern California Megaregion, 2016
- 8. www.bayareaeconomy.org Substantial inequities in Bay Area median household incomes also correlate with ethnicity. Bay Area Median Household Incomes by Ethnicity, 2016 0 $30,000 $60,000 $90,000 $120,000 $150,000 African-American Hispanic Asian White $122,700 $132,900 $83,000 $69,400 EXHIBIT 27 Source: U.S. Census Bureau American Community Survey 2016 Analysis: Bay Area Council Economic Institute
- 9. www.bayareaeconomy.org Traffic is highly correlated with economic activity, and San Francisco congestion is third worst among cities in Bay Area peer regions and among U.S. cities overall. EXHIBIT 28 Note: Annual hours of traffic delay historical numbers are from 2013, except for Chicago and Atlanta which are from 2015. Source: INRIX Analysis: Bay Area Council Economic Institute and McKinsey & Company