SlideShare uma empresa Scribd logo
1 de 73
“DEMAND ESTIMATE OF MILK FOR INSTITUTIONAL SALES,
                  in Dharwar


              DETAILED TABLE OF CONTENTS
   SL.NO.          PARTICULARS

     1.     PART-I
            EXECUTIVE SUMMARY

      2.    PART-II
            INTRODUCTION TO THE COMPANY AND INDUSTRY

                  PROFILE OF COMPANY
                  INDIAN DAIRY INDUSTRY
                  THE MILK AND MILK PRODUCTS MARKET
                  THE ORGANISED MILK MARKET IN INDIA
                  THE SWOT ANALYSIS OF INDIAN DAIRY INDUSTRY

     3.     PART-III

            LITERATURE SURVEY

     4.     PART-IV
            DESIGN OF THE STUDY
                NEED FOR THE STUDY
                RESEARCH OF THE OBJECTIVES
                RESEARCH PROCESS
                SCOPE OF THE STUDY
                LIMITATIONS OF THE STUDY

     5.    PART-V
            ANALYSIS AND INTERPRETATION OF DATA

      6.   PART-VI

            FINDINGS

      7.   PART-VII

            SUGGESTIONS

      8.   PART-VIII

                  CONCLUSION
                  BIBLIOGRAPHY
                  APPENDIXES

Babasabpatilfreepptmba.com                                  Page 1
“DEMAND ESTIMATE OF MILK FOR INSTITUTIONAL SALES,
                  in Dharwar


                             PART-II


   INTRODUCTION TO THE COPMANY

                 INDUSTRY PROFILE


Babasabpatilfreepptmba.com                   Page 2
“DEMAND ESTIMATE OF MILK FOR INSTITUTIONAL SALES,
                  in Dharwar


COMPANY PROFILE:

Kalpataru dairy has been started in the year 1998 and in the year 2004 it has been

purchased by the young entrepreneur of Dharwar, Mr. Vijay Mane. Now kalpataru dairy

is running under the keen observations of Mr. Vijay Mane. It is located near

khalaghatagi city. It is operating in Dharwar and Dharwar regions. It is also one of

largest milk producers in the market. The company is very enthusiastic and more

ambitioned to cater and carve the new markets in the North Karnataka. The company has

good market share in the Dharwar and dharwar regions. They are achieving higher

market share in that region by practicing good marketing strategies.


Kalpataru dairy has a good number of satisfied customers in the market. The company is

using many new product development strategies to satisfy the customers. Its one among

the many dairies which are producing good quality standard toned milk. It has many

institutional and domestic customers for their milk. The company has widened its market

share about 5% this year. They are now looking for the Belguam market as an

institutional segment.


Babasabpatilfreepptmba.com                                                           Page 3
“DEMAND ESTIMATE OF MILK FOR INSTITUTIONAL SALES,
                  in Dharwar


INDIAN DAIRY INDUSTRY PROFILE
INTRODUCTION


India's high-value, high-volume market for traditional dairy products and delicacies is all

set to boom further under the technology of mass production. This market is the largest

in value after liquid milk and is estimated at US $3 billion in India.


More and more dairy plants in the public, cooperative and private sectors in India are

going in for the manufacture of traditional milk products. This trend will undoubtedly

give a further stimulus to the milk consumption in the country and ensure a better price

to primary milk producers. Simultaneously, it will also help to productively utilize

India's growing milk surplus.


Milk production in India increased from 17 million tons in 1950-51 to 89.6 million tons

in 2004-05. India has rapidly positioned itself as the world's largest producer of milk.

Producing milk in rural areas through smallholder producer cooperatives and moving

industrially-processed milk from these smallholder sources to urban demand centers

became the cornerstone of government dairy development policy. This policy initiative


Babasabpatilfreepptmba.com                                                         Page 4
“DEMAND ESTIMATE OF MILK FOR INSTITUTIONAL SALES,
                  in Dharwar

gave a boost to dairy development and initiated the process of establishing the much-

needed linkages between rural producers and urban consumers.


The performance of the Indian dairy sector during the past three decades has been truly

impressive. Milk production grew at an average annual rate of 4.6 percent during the

1970s, 5.7 percent during the 1980s, and 4.2 percent during the 1990s.


Despite its being the largest milk producer in the world, India's per capita availability of

milk is one of the lowest in the world, although it is high by developing country

standards. The per capita availability of milk expanded substantially during the 1980s

and 1990s and reached about 226 grams per day in 2003-04 the per capita consumption

of milk and milk products in India is among the highest in Asia, but it is still growing. It

is still below the world average of 285 grams per day, and also the minimum nutritional

requirement of 280 grams per day as recommended by the Indian Council of Medical

Research (ICMR).


Several factors have contributed to increased milk production. First, milk and dairy

products have cultural significance in the Indian diet. A large portion of the population is

lacto-vegetarian, so milk and dairy products are an important source of protein in the

diet. The demand for milk and dairy products is income-responsive, and growth in per

capita income is expected to increase demand for milk and milk products.


Despite the fact that dairy production in India is widespread throughout the country and

overwhelmingly carried out by small-scale producers, there are still large interregional

and interstate variations in milk production. Roughly two-thirds of national milk


Babasabpatilfreepptmba.com                                                          Page 5
“DEMAND ESTIMATE OF MILK FOR INSTITUTIONAL SALES,
                  in Dharwar

production comes from the states of Uttar Pradesh, Punjab, Rajasthan, Madhya Pradesh,

Maharashtra, Gujarat, Andhra Pradesh, and Haryana. However, there have been some

shifts in milk production shares of different states. In 2001-02, Uttar Pradesh was the

largest milk producer in the country, with about 16.5 million tons of milk, followed by

Punjab (8.4 million tons), Rajasthan (6.3 million tons), Madhya Pradesh (6.1 million

tons), Maharashtra (6 million tons), and Gujarat (5.6 million tons). The eastern region is

lagging behind in terms of dairy development, and imports milk from surplus areas in the

West and North.


INDIAN DAIRY INDUSTRY — A PROFILE


— The annual milk production is presently 92 million tonnes, contributing around Rs.

1000 billions to the GDP.


— Provides assured and remunerative employment round-the-year to 60 millions

families.


— The dairy animals make a substantial contribution to household food security by

providing income, quality food, energy, fertilizer and assets in over majority of the rural

households in India.


— The Animal Husbandry is the single largest contributor under the agriculture sector

which provides a remunerative employment round the year at a very small investment.

The dairy animals make a substantial contribution to household food security by


Babasabpatilfreepptmba.com                                                         Page 6
“DEMAND ESTIMATE OF MILK FOR INSTITUTIONAL SALES,
                  in Dharwar

providing income, quality food, energy, fertilizer and assets in over majority of the rural

households in India.


            These livestock keepers are constrained by poor animal health and veterinary

services, lack of feed and fodder, water, milk handling, chilling, etc. Besides, there has

been lack of infrastructure facilities such as good roads and access to markets, etc. The

livestock keepers also lack access to advanced technologies as well as proper

institutional support system. The result is that both the production and productivity

remain well below its potentials. Thus the losses and wastages continue to remain high.

Adapted breeds and local feed resources although available, but need proven technology

supports in its preservation and processing. Such support would substantially improve

production and productivity, which would result in higher income for the livestock

keepers.


           One of the problems faced by India is unemployment, despite the rapid growth

rate. The problem is more acute in rural educated and marginally educated youths, who

have no alternative but to migrate to urban areas. Due to automation in various core

sectors, the employment opportunities have dwindled considerably whereas the service

sector has its own limitations, especially the high investment cost per job created. In this

context, the dairy industry offers a plausible opportunity of creation of self-employment

with minimum investment. There is a scope for doubling the present milk production,

which can be achieved with marginal investment, such a step would not only enhance

milk production and productivity, but also would create millions of additional jobs.


Babasabpatilfreepptmba.com                                                          Page 7
“DEMAND ESTIMATE OF MILK FOR INSTITUTIONAL SALES,
                  in Dharwar

           Dairying is, in fact, a supplementary activity of the marginal farmers and the

landless laborers. It is therefore suggested that dairy and such other animal farming be

included within the legal framework of ‘agriculture and agriculture products’. This

would enable the marginal farmers and the landless agriculture laborers to benefit from

the various government incentives.


             Milk is no more a luxury, but essential nutritional requirements of human

being. The children largely depend on milk for nutrition. Higher milk production

therefore will also increase the health status of the farmers and people at large. Due to

several inherent reasons, the cost of milk production is high. One of the important

reasons is low animal productivity. Because of high cost, the milk and milk products are

not affordable to poor strata of the society. Milk is a perishable commodity. Hence, its

conversion to products, such as, milk powder, butter and cheese, etc. is necessary.

Considering these factors, it is reasonable that at par with agriculture produce, the milk

products be also exempted from any excise duty, sales tax and such other taxes. This

gesture of the government would go a long way in accelerating the growth of the Indian

dairy industry from present annual rate of around 4.5 % to more than 9%.


The conversion of excess milk to milk-products is a necessity. The basic principle here is

evaporation of water which changes its physical form only, whereas there is no change

whatsoever in its chemical composition. One of the reasons of higher cost of milk and

milk products is the cost of packaging. To safeguard the quality and safety for human

consumption, packaging of milk and milk product is necessary. The milk product

manufacturing therefore should be construed as ‘processing milk for preservation’ and it


Babasabpatilfreepptmba.com                                                        Page 8
“DEMAND ESTIMATE OF MILK FOR INSTITUTIONAL SALES,
                  in Dharwar

should be exempted from all the taxes and duties like excise, central sales tax and octroi

etc.


To enhance milk production during the next five years as well as to address the issues

referred in the foregoing sentences, there is an imperative need of policy support from

the government on the following core areas:


- Clean and quality milk production, processing and packaging


- Boost the exports of milk and milk products


- Enhance milk production and milch animal productivity


Indian Dairy: the organized sector is expanding Daily


India’s modern dairy sector has expanded rapidly. From an insignificant 200,000 liters

per day (lpd) of milk being processed in 1951, the organized sector is presently handling

some 20 million lpd in over 400 dairy plants. Already, one of the world’s largest liquid

milk plants is located in Delhi and handling over 800,000 liters of milk per day (Mother

Dairy, Delhi). India's first automated dairy ‘Mother Dairy ‘ has been established at


Babasabpatilfreepptmba.com                                                        Page 9
“DEMAND ESTIMATE OF MILK FOR INSTITUTIONAL SALES,
                  in Dharwar

Gandhi agar near Ahmedabad, Gujarat, in Western India and its capacity is capacity is 1

million lpd. It is owned by India’s biggest dairy cooperative group, in Anand, with an

annual turnover in excess of Rs 23 billion (US $500 million). Amul-III with its satellite

dairies, with total installed capacity of 1.5 million lpd has also been commissioned.

India's first vertical dairy (capacity: 400,000 lpd), owned by the Pradeshik Cooperative

Dairy Federation (PCDF) has been commissioned at Noida, outside Delhi


Dairy is a place where handling of milk and milk products is done and technology refers

to the application of scientific knowledge for practical purposes.


In India, dairying has been practiced as a rural cottage industry since the remote past.

Semi-commercial dairying started with the establishment of military dairy farms and co-

operative milk unions throughout the country towards the end of the nineteenth century.


The Indian Dairy Industry has made rapid progress since Independence. A large number

of modern milk plants and product factories have since been established. These

organized dairies have been successfully engaged in the routine commercial production

of pasteurized bottled milk and various Western and Indian dairy products. With modern

knowledge of the protection of milk during transportation, it became possible to locate

dairies where land was less expensive and crops could be grown more economically.


The Winning Edge


 Three aspects of India’s modern dairy sector are particularly noteworthy.


Babasabpatilfreepptmba.com                                                      Page 10
“DEMAND ESTIMATE OF MILK FOR INSTITUTIONAL SALES,
                  in Dharwar

  A vast market for dairy products is being built as disposable incomes increase. Its

focus is the increasingly affluent middle class, numbering some 300 million — almost

the population of the United States — which is confined to well-defined urban pockets

and is easily accessible. Milk occupies pride of place as the most coveted food in the

Indian diet, after wheat and rice. Milk-based sweets are a culinary delight in all homes

throughout the year.

   The milk production is pre-dominantly rooted in the cooperative system focus is on

the small rural farmer having one or two cow/buffaloes, yielding 2-3 liters of milk per

animal. This system is the basis of operation flood, the world’s largest dairy

development program.

   The preferred dairy animal is the buffalo. Some 65 per cent of the world buffalo milk

is produced in India. It has 30 per cent higher total solids compared to cow milk


Babasabpatilfreepptmba.com                                                          Page 11
“DEMAND ESTIMATE OF MILK FOR INSTITUTIONAL SALES,
                  in Dharwar

DAIRY INDUSTRY PROFILE


   •   Human population: 953 million (70 million dairy farmers)

   •   Milk production: 74.3 million tonnes (203.5 million lpd)

   •   Average annual growth rate (1995-2000): 5.6%

   •   Per capita milk availability: 214 g/day or 78 kg/year

   •   Milch animals: 57 million cows; 39 million buffaloes:

   •   Milk yield per breedable bovine in-milk: 1,250 kg

   •   Cattle feed production (organized sector): 1.5 million tonnes

   •   Turnover of veterinary pharmaceuticals: Rs. 550 crores

   •   Dairy plants throughput: 20 mlpd

   •   Throughput as percentage of total milk output: 10


The Dairy Movement in India


The dairy cooperative movement in India continues to be unparalleled in the world in

terms of its scope and scale. Launched in the Kaira district of Gujarat during India's

independence, farmers were encouraged to form a cooperative to counter exploitatively

low prices offered for their milk by the monopoly milk supplier, Polson Dairy. The Kaira

cooperative launched its operations in 1946 and operated at two levels. The primary

village dairy cooperative society of milk producers collaborated with others in the

district to form the milk producers union, which procured and processed the milk. The

union processed the milk that was procured from the village dairy cooperatives at its

processing plants. In addition to collecting surplus milk, the Kaira union assisted


Babasabpatilfreepptmba.com                                                     Page 12
“DEMAND ESTIMATE OF MILK FOR INSTITUTIONAL SALES,
                  in Dharwar

members in expanding production. The father of the Indian dairy movement was

Varghese Kurien. A mechanical engineer from the Michigan State University, US,

Kurien helped India to become the largest producer of milk in the world.


      As the number of district unions increased, the Kaira cooperative was transformed

into the Gujarat Milk Marketing Federation Ltd (GCMMF) under the chairmanship of

Kurien. GCMMF coordinated the operations of the union and marketed milk and milk

products. As the operations were based in Anand, Gujarat, this came to be known as the

Anand model. This model was replicated across India. In 1965, NDDB was formed

under the chairmanship of Kurien and was mandated with the task of building

cooperative dairies across the country. Operation Flood was launched in 1970, which

sought to establish dairy cooperatives across India, get rid of middlemen, remove

seasonal price variations and make it economically viable for farmers to undertake

production and distribution of milk. Operation Flood achieved phenomenal success:

trebling India's annual milk production from 21 million tonnes in 1968 to 89 million

tonnes in 2004. Nearly 9 million small producers in 74,000 villages began supplying

hygienic and fair priced milk to 300 million consumers and earning revenues of Rs 25

billion                 in                 the                  process.

          Of the Rs 2 billion invested by World Bank in the second phase of Operation

Flood, the net return to the rural economy has been in the region of Rs 240 billion. per

year over a period of ten years or a total of Rs 2.4 trillion in all. No other development

programme in the world has achieved such success. Several countries like Sri Lanka,

Bangladesh, Nepal, the Philippines, Malaysia and some African countries have decided

to implement similar projects. The third phase of Operation Flood, implemented during

Babasabpatilfreepptmba.com                                                       Page 13
“DEMAND ESTIMATE OF MILK FOR INSTITUTIONAL SALES,
                  in Dharwar

1985-96 aimed at consolidating the achievements of the first two phases. Infrastructure

was strengthened, production enhanced and animal healthcare and nutrition improved.


The Operation Flood III programme was funded by a World Bank credit of US $365

million and food aid worth Rs 2226 million. By May 1995, Rs 15.78 billion had been

invested in the three phases of Operation Flood. By the time the third phase came to an

end, milk processing capacity had grown to 17.2 million liters per day. Chilling capacity

of 6.9 million litres per day had been added and milk powder production capacity of 839

tonnes per day had been set up. By 1999, average milk procurement by the cooperatives

had grown to 10.2 million liters per day, of which 9.4 million liters was marketed as

liquid milk. The remainder was converted into milk powder, butter, cheese, ghee and

other traditional milk products.


DDB (National Dairy Development Board) has been focusing on intensive R&D

activities in animal husbandry through the late 1990s. It has set up an embryo transfer

lab at Sabarmati Ashram Gaushala in Ahmedabad. NDDB has also been working on

improving nutrition quality of the normal cattle feed. NDDB has made it possible to

transport milk over long distances by using over 140 insulated rail milk tankers, each

with a capacity of 40,000 liters. This has enabled the National Milk Grid to supply milk

to milk-deficient regions in the country.


In the year 2000, NDDB (National Dairy Development Board) announced a ten-year

plan called Perspective 2010. It is aimed at strengthening the dairy cooperative

movement.


Babasabpatilfreepptmba.com                                                      Page 14
“DEMAND ESTIMATE OF MILK FOR INSTITUTIONAL SALES,
                  in Dharwar


The major objectives include:


   •   increasing milk procurement by cooperatives from 5.75 mt in 2000 to 17.8 mt in

       2010;

   •   increasing the number of dairy cooperative societies from 84,289 in 2000 to

       129,480 in 2010;

   •   increasing the membership in dairy cooperatives from 10.62 million in 2000 to

       15.62 million in 2010; and

   •    Increasing the amount of milk to be marketed from 4.7 mt in 2000 to 14 mt in

       2010.


Specific features of dairy in relation to marketing in developing

countries


The dairy industry in the developing countries has a number of specific features which

distinguish it from the other sectors of agriculture and have particular implications for

marketing. First, milk consists of over 85% water, and produced daily. Consequently,

Babasabpatilfreepptmba.com                                                        Page 15
“DEMAND ESTIMATE OF MILK FOR INSTITUTIONAL SALES,
                  in Dharwar

high costs of transportation are incurred per unit of output marketed. Also, milk being

highly perishable, it needs to be used within a short period or processed and

transformed into a more stable, longer-storable form. The quality of milk depends on

farm management practices, and milk is potentially subject to adulteration, so strict and

comprehensive quality regulations may be necessary when marketing involves more

than direct delivery by producers to consumers.


          Second, the vast majority of the dairy farmers are small-scale producers, who

produce milk as a source of regular cash income. Dairy production is a labor-intensive

enterprise, and dairy marketing activities often provide substantial employment.

However, because of asset fixity (high percentage of fixed costs), dairy enterprises often

respond to market changes and incentives in a limited and gradual way.


           Third, milk can be used to make a wide range of high quality palatable and

nutritious products, which often imply substantial value added over the cost of the raw

material. When production and consumption points are far apart and demand increase

rapidly, processing of dairy products becomes very important.


               Fourth, as a consequence of the above features of milk and the market

vulnerability of its producers, cooperatives may assume a strong position in milk

processing. A survey by the International Dairy Federation in 1984 revealed that in 21

developed countries together accounting for 55% of the world's milk supply, producer

Babasabpatilfreepptmba.com                                                        Page 16
“DEMAND ESTIMATE OF MILK FOR INSTITUTIONAL SALES,
                  in Dharwar

cooperatives marketed 86% of total sales of milk from farm to the first handler. In some

of these countries, cooperatives also handled 80-90% of the total processing activity. It

may be noted that the history of development of dairy cooperatives in these countries are

not always similar. However, in most developing countries, dairy producer cooperatives

and cooperative processing are either non-existent or very weak. The need for

cooperatives in these countries is driven by the need to capture some economies of scale

in transportation and processing where numerous small producers are scattered far away

from the consumption centres. In many countries, this gap has been filled by

establishment of parastatal dairy enterprises for collection and processing of milk to

promote domestic dairy production. In most cases, these enterprises ended up processing

subsidized imported dairy products, neglecting the rural dairy sector. The monopolistic

character of these enterprises often led to inefficiency thus they failed to serve the

interests of domestic producers and consumers.


Weaknesses in physical and marketing links between rural producers and urban

processors and consumers are among the major constraints to dairy development in the

developing countries. It is important to be aware of and understand how such constraints

can be addressed in order to devise mechanisms that can transfer growing urban demand

into increased livestock production. Inadequate infrastructure and inefficient marketing

may lead to increased transactions costs and/or market failure. By better understanding

these costs and identifying the ways of reducing their impact, policy prescriptions can be

made to promote economic development by fostering production and trade.


CHARACTERIZING DAIRY MARKETING SYSTEMS

Babasabpatilfreepptmba.com                                                       Page 17
“DEMAND ESTIMATE OF MILK FOR INSTITUTIONAL SALES,
                  in Dharwar

A dairy marketing system is characterized by:


   •   The range of dairy products marketed;

   •   The size, structure and organization of the enterprises participating in the market

       for each product and in the entire marketing chain;


   •   The conduct and performance of the marketing system; and


   •   The existing marketing policies, institutions and organizations, and the physical

       environment within which marketing takes place.


Functional parameters: These are key descriptors of how the system operates.

Examples include dairy products marketed, marketing agents, marketing outlets, prices

at each marketing node, modes of transporting marketed products, etc. Functional

parameters combine characteristics related to market structure and conduct.


Performance indicators: These parameters permit assessment of the performance of the

system. Examples are the percentage of total dairy products marketed, the ratio of

standardized to non-standardized products marketed; the ratio of marketing to total costs;

the ratio of farm gate to retail price. The importance of identifying performance


Babasabpatilfreepptmba.com                                                       Page 18
“DEMAND ESTIMATE OF MILK FOR INSTITUTIONAL SALES,
                  in Dharwar

indicators is that they form the baseline against which any changes in the efficiency or

performance of the system can be measured.


Formal market includes firms and organizations whose daily operations are guided by

statutory rules and procedures, e.g. a parastatal dairy processing plant or a company

engaged in dairy marketing.


 Informal market includes firms whose daily operations are not guided by statutory

rules and procedures except for any trade license, e.g. dairy producers and itinerant

traders.


A marketing chain defines the flow of commodities from producers to consumers that

brings into place economic agents who perform complementary functions with the aim

of satisfying both producers and consumers.


A marketing node is defined as any point in the marketing chain where an exchange

and/or transformation of a dairy product take place. A marketing chain may link both

formal and informal market agents.


The Liquid Milk & Milk Products Market

            Out of a total production of 88 mt of milk, 46per cent is consumed as liquid

milk. Less than 30 per cent of milk production – i.e. 26.4 mt – is packaged. Currently

barely 778 out of 3,700 cities and towns are served by the milk distribution network,

dispensing hygienically packed wholesome, quality pasteurized milk. According to one

estimate, the packed milk segment would double in the next five years.


Babasabpatilfreepptmba.com                                                     Page 19
“DEMAND ESTIMATE OF MILK FOR INSTITUTIONAL SALES,
                  in Dharwar

         The effective milk market is largely confined to urban areas, inhabited by over

25 per cent of the country's population. In urban India, an estimated 50 per cent of the

total milk produced is consumed by a population of roughly about 350 million. The

expected rise in urban population would be a boon to Indian dairying.

 Of the three A's of marketing - availability, acceptability and affordability, the dairy

sector is at an advantage since Indians are a milk loving people. However what continues

to be a challenge is the affordability factor. Volume sales could dramatically increase if

small packs of 250 ml or less is made available. Sales of milk powders in mini-sachets,

for two cups of tea or coffee, could also help in increasing volumes.

Flavored Milk is increasingly becoming the toast of the milk market. The overall market

for flavored milk in India is estimated to have grown 27 per cent in value terms in 2004-

05. Milk-based drinks are the flavor of the season as consumers seek healthy lifestyles.

Nestlé’s Fruit and Milk and Amrit Foods’ Gagan are the two brands that have a

significant presence in this segment


    Ultra Heat Treatment (UHT) milk or long-shelf-life milk sales are estimated to be in

the region of 70 million liters and the segment is growing at a healthy pace of 20-25 per

cent per year.


Packaged curd and curd products – such as lassi, buttermilk, chhas, set dahi, mishti doi,

etc. – are new products and are witnessing a rapid pace of growth. In terms of volumes

this just comprises 5 per cent of dairy products, but they are growing at 10 per cent per


Babasabpatilfreepptmba.com                                                       Page 20
“DEMAND ESTIMATE OF MILK FOR INSTITUTIONAL SALES,
                  in Dharwar

annum. Flavored yoghurt, which is popular in the West, however, has not been

successful in India.


Traditional products, such as paneer, mithai, khoa and khoa-based sweets, which are

available in the unorganized market, is a huge segment. Apart from Amul which has

launched paneer and its Mithaee brand which offers traditional Indian sweets, the

organised sector has not tapped into the potential that this sub-category offers.


Some facts about organized Milk market in India:


Beginning in organized milk handling was made in India with the establishment of

Military Dairy Farms.


Babasabpatilfreepptmba.com                                                 Page 21
“DEMAND ESTIMATE OF MILK FOR INSTITUTIONAL SALES,
                  in Dharwar

   •   Handling of milk in Co-operative Milk Unions established all over the country on

       a small scale in the early stages.

   •   Long distance refrigerated rail-transport of milk from Anand to Bombay since

       1945

   •   Pasteurization and bottling of milk on a large scale for organized distribution was

       started at Aarey (1950), Calcutta (Haringhata, 1959), Delhi (1959), Worli (1961),

       Madras (1963) etc.

   •   Establishment of Milk Plants under the Five-Year Plans for Dairy Development

       all over India. These were taken up with the dual object of increasing the national

       level of milk consumption and ensuing better returns to the primary milk

       producer. Their main aim was to produce more, better and cheaper milk.


Milk Production data

1950 – 17 million tonnes

1996 – 70.8 million tonnes

1997 – 74.3 mT

(Projected) 2020 – 240 mT

Expected to reach- 220 to 250 mT – 2020

India contributes to world milk production rise from 12-15 % & it will increase up to 30-
35% (year 2020)


SWOT ANALYSIS OF INDIAN DAIRY INDUSTRY


Strengths:
Babasabpatilfreepptmba.com                                                       Page 22
“DEMAND ESTIMATE OF MILK FOR INSTITUTIONAL SALES,
                  in Dharwar

   •   Demand profile: Absolutely optimistic.

   •   Margins: Quite reasonable, both on packed and non packed liquid milk.

   •   Flexibility of product mix: tremendous opportunities are present. With balancing

       equipment, we can keep on adding to your product line.

   •   Availability of raw material: Abundant. Presently, more than 80 per cent of milk

       produced is flowing into the unorganized sector, which requires proper

       channelization.

   •   Technical manpower: Professionally-trained, technical human resource pool,

       built over last 30 years.


Weaknesses:


   •   Perishability: Pasteurization has overcome this weakness partially. Surely, many

       new processes will follow to improve milk quality and extend its shelf life.

   •   Lack of control over yield: Theoretically, there is little control over milk yield.

       However, increased awareness of developments like embryo transplant, artificial

       insemination and properly managed animal husbandry practices, coupled with

       higher income to rural milk producers should automatically lead to improvement

       in milk yields.


Babasabpatilfreepptmba.com                                                       Page 23
“DEMAND ESTIMATE OF MILK FOR INSTITUTIONAL SALES,
                  in Dharwar

   •   Logistics of procurement: Woes of bad roads and inadequate transportation

       facility make milk procurement problematic. But with the overall economic

       improvement in India, these problems would also get solved.

   •   Problematic distribution: Yes, all is not well with distribution. But then if ice

       creams can be sold virtually at every nook and corner, why can’t we sell other

       dairy products too? Moreover, it is only a matter of time before we see the

       emergence of a cold chain linking the producer to the refrigerator at the

       consumer’s home!

   •   Competition: With so many newcomers entering this industry, competition is

       becoming tougher day by day. But then competition has to be faced as a ground

       reality. The market is large enough for many to carve out their niche.


Opportunities:


"Failure is never final, and success never ending”. If dairy entrepreneurs are looking for

opportunities in India, the following areas must be tapped:


   •   Value addition: There is a phenomenal scope for innovations in product

       development, packaging and presentation. Given below are potential areas of

       value addition:

           o   Steps should be taken to introduce value-added products like shrikhand,

               ice creams, paneer, khoa, flavored milk, dairy sweets, etc. This will lead

               to a greater presence and flexibility in the market place along with

               opportunities in the field of brand building.


Babasabpatilfreepptmba.com                                                       Page 24
“DEMAND ESTIMATE OF MILK FOR INSTITUTIONAL SALES,
                  in Dharwar

           o   Addition of cultured products like yoghurt and cheese lend further

               strength - both in terms of utilization of resources and presence in the

               market place.

           o   A lateral view opens up opportunities in milk proteins through casein, and

               other dietary proteins, further opening up export management.

           o   Yet another aspect can be the addition of infant foods, geriatric foods and

               nutritional


   Export potential: Efforts to exploit export potential are already on. Amul is exporting

   to Bangladesh, Sri Lanka, Nigeria, and the Middle East. Following the new GATT

   treaty, opportunities will increase tremendously for the export of agri-products in

   general and dairy products in particular.


Threats:


Milk vendors, the un-organized sector: Today milk vendors are occupying the pride of

place in the industry. Organized dissemination of information about the harm that they

are doing to producers and consumers should see a steady decline in their importance.


The study of this SWOT analysis shows that the ‘strengths’ and ‘opportunities’ far

outweigh ‘weaknesses’ and ‘threats’. Strengths and opportunities are fundamental and

weaknesses and threats are transitory. Any investment idea can do well only when you

have three essential ingredients: entrepreneurship (the ability to take risks), innovation

approach (in product lines and marketing) and values (of quality/ethics).


Babasabpatilfreepptmba.com                                                       Page 25
“DEMAND ESTIMATE OF MILK FOR INSTITUTIONAL SALES,
                  in Dharwar

The Indian dairy industry has been attracting a large number of entrepreneurs. Their

success in dairying depends on factors such as an efficient yet economical procurement

network, hygienic and cost-effective processing facilities and innovativeness in the

market place. All that needs to be done is: to innovate, convert products into

commercially exploitable ideas. All the time keep reminding yourself: Benjamin

Franklin discovered electricity, but it was the man who invented the meter that really

made the money.


            PART III-LITERATURE SURVEY


Babasabpatilfreepptmba.com                                                   Page 26
“DEMAND ESTIMATE OF MILK FOR INSTITUTIONAL SALES,
                  in Dharwar


INSTITUTIONAL SALES

The institutional sales are defined as the process of selling the good and services to the

customers who will make purchases in bulk quantity. Now in India the rate of

consumerism is increasing predominantly these days. The customers are enjoying the

purchase experience in the retail outlets. The increased number of consumerism has the

strong supporting factors like the augmentation of the disposable income.


These increased transactions and higher disposable incomes in Indian markets bring

down the opportunities to expand the existing businesses and start a new venture. An

institutional sale supports the 80:20 rules of the marketing or sales. These 20%


Babasabpatilfreepptmba.com                                                       Page 27
“DEMAND ESTIMATE OF MILK FOR INSTITUTIONAL SALES,
                  in Dharwar

institutional customers purchases 80%of the sales and 80% of the customers’ purchases

20%of the total production.


Institutional sales provides very favorable margin to the companies in terms of cash sales

and the profit margin is also very high as compared to the daily merchandised factors.

Indian business scenario is changing every day. This change has many reasons in it, they

all are not happened suddenly, but, all these are the results of LPG policy of 1991. At

present every Indian per capital income has increased and the disposable income also

raisened these years. These all lead them to have the paramount experience of

purchasing process.


These all factors gives raise to the more business opportunities generally and

institutional sales particularly. Institutional sales more surely influenced by the market

structure and demand forecasting data of that industry. It has many determining factors

like economical, political, legal, and international factors play a vital role in the

institutional sales. For the Indian dairy industry these institutional sales are not fixed.

They vary according to the changing demands and other seasonal variations. India is one

of hot region in this world. In summers the milk consumption rate as the its end product

like cold milk, flavored milk, ice creams, curd, butter milk, etc is very high. So the


Babasabpatilfreepptmba.com                                                        Page 28
“DEMAND ESTIMATE OF MILK FOR INSTITUTIONAL SALES,
                  in Dharwar

summer season blossoms the high sales for this milk industry. Hence the milk industry

has very changing business for the institutional sales.


The dairy industry is growing in India and all the Indians are lacto-vegetarian in nature.

Indians want to consume more milk content food in their eating menu. 60% of the

produced milk in India is consumed by the urban people and this shows that the urban

India is growing fastly. The fast urbanization leads to get more opportunities for these

institutional purchasers of milk.


These institutional sales are done on the discount rates. The purchasers get a bit high

amount of discount in their total purchase. This leads them to get more profit in their

manufacturing of their final product and selling. The institutional sales are based on the

strong and good relationships with your customers. The customer relationship

management (CRM) plays a very vital role in the institutional sales. To boost these

institutional sales the manufacturers have to come up with many new marketing

strategies

in their product promotions and as well a with their product and pricing strategies. The

distribution channel also has to be made so lively. The distribution channel has to be o

strong and should follow the intensive distribution strategy

For this dairy industry the distribution channel are its local operating dealers and other

retailers of the market. The dealers are given more commission to achieve the high sales

during a period of time. These dealers are very business minded and always push the


Babasabpatilfreepptmba.com                                                       Page 29
“DEMAND ESTIMATE OF MILK FOR INSTITUTIONAL SALES,
                  in Dharwar

product into the market which is fetching more commission to them. So its very

important to see through this end channels of marketing.


Philip kotler suggests that these institutional markets are very volatile in nature. In this

market the buzz word “BRAND” plays a very important role. Many customers make the

purchase decision on the basis of their preferred and most trusted brand. To boost the

institutional sales the companies have to practice the strong brand building strategy in

the customer mind sets. They have to make intensive advertisement campaigns to place

their product in the customer mind. In institutional sales the quality is main element than

the price. The quality has to be maintained as per the prescribed details.


DEMAND ANALYSIS.

The sale of a product depends upon the demand of that product. but the demand of that

product depends upon a number of varied factors. These factors are such as price, buyers

income, price of substitute or competing products, advertising and sales promotion,


Babasabpatilfreepptmba.com                                                         Page 30
“DEMAND ESTIMATE OF MILK FOR INSTITUTIONAL SALES,
                  in Dharwar

population, availability of credit, changes in buyers tastes, needs and preferences,

geographical location, expected future trends in prices etc. there are certain fundamental

factors which determine the demand for a product. These factors are price of a product,

buyer’s income, prices of related goods and advertising and sales promotion.


These factors have high influence on the sales and hence they constitute the controlling

variables commonly used in the study of demand. The importance of each of these four

factors varies from product to product and for the same product from time to time.


What is demand?

In the ordinary language the word demand means desire. But mere desire does not

constitute demand in the economic sense. Because the person with low income may

desire to have a MERCEDEZ BENZ car but this doesn’t constitute a demand for a car

because that person doesn’t have adequate money to purchase the car. In other words he

does not have the ability to purchase the car.

In other words the demand is defined as the human want that are backed by his

purchasing power.


Demand implies three conditions;

           a) desire for a commodity or a service

Babasabpatilfreepptmba.com                                                       Page 31
“DEMAND ESTIMATE OF MILK FOR INSTITUTIONAL SALES,
                  in Dharwar

            b) willingness to pay the price for it, and

            c) ability to pay price for it.

Thus demand for any commodity as a desire for that commodity backed up by

willingness and ability to pay. Further demand has no meaning without reference to

price.


LAW OF DEMAND

This law states the relation between the price of commodity and its quantity demanded in

the market. the law is” other things remaining equal, the amount of a commodity

demanded increases every fall in its price and diminishes with every rise in its

price”

Thus the quantity of a commodity demanded varies inversely with its price.


INCOME EFFECT OF DEMAND

A fall in the price of a commodity results in an increase in the real income of the

consumer. Because with the same amount of money to be spent on commodity he can

now purchase more of it when its price falls. On the contrary a rise in the price of a

commodity results in decrease in the real income of the consumer. Because with the

same amount of money to be spent on the commodity, he will now purchase less

quantity of it when its prices rises.


Babasabpatilfreepptmba.com                                                     Page 32
“DEMAND ESTIMATE OF MILK FOR INSTITUTIONAL SALES,
                  in Dharwar


Substitution effect of a demand

A fall in the price of commodity leads to an increase in the demand for it, while the price

of its substitutions remains constant. On the contrary, a raise in the price of a commodity

will make it costlier and lead to a decrease in the demand for it, while prices of its

substitutes remain constant. This is the case of contraction of demand are attributed to

substitution effect. Normally the substitution effect is stronger than the income effect.

Because consumers always substitute the cheaper commodity for the costlier commodity.

Income effect has positive only in case of superior goods because if their prices fall the

consumers real income will increases and they will , there fore buy more of them.


But the income effect is negative in case of inferior goods because if their prices fall the

consumers real income increases and they purchase less of such inferior goods. But the

substitution effect on the other hand is always positive because consumers always

substitute relatively cheaper goods for relatively costlier goods. Thus in the case of

superior goods the income effect and substitution effect are both positive. But incase of

inferior goods the income effect is negative while the substitution effect is positive


FACTORS GOVERNING DEMAND

The law of demand states that demand changes whenever prices changes. But this

change in demand which is result of a change in price is known as extension or

contraction of demand. But demand may also changes due to changes in factors other


Babasabpatilfreepptmba.com                                                          Page 33
“DEMAND ESTIMATE OF MILK FOR INSTITUTIONAL SALES,
                  in Dharwar

than price. This change due to changes in factors other than the price. The factors which

bring about changes in demand price remaining the same.


Changes in population:

An increase in the size of population naturally leads to an increase in the demand for

various goods and services. Conversely, a decrease in size of the population leads to a

decrease in demand for goods and services.


Changes in climatic conditions:

Demand for certain goods are affected by changes in climatic conditions.


Changes in fashion:

Changes in fashion bring about changes in demand.


Changes in tastes, habits etc:

If tastes, habits and customs to which people are accustomed change, demand for goods

and services also changes.


Changes in quantity of money in circulation:

If the quantity of money in circulation increases, people will be having more purchasing

power and hence, demand for goods ad services increases. Conversely, if the quantity of


Babasabpatilfreepptmba.com                                                      Page 34
“DEMAND ESTIMATE OF MILK FOR INSTITUTIONAL SALES,
                  in Dharwar

money in circulation decreases, people will be having less purchase power and therefore

demand for goods and services also decreases.


Changes in the distribution of income and wealth:

If the income or wealth is distributed more evenly among the various sections of the

community, the purchasing power of majority of the people increases and therefore,

demands for goods and services increases.


Availability of substitutes:

If the substitutes are available adequate then demand for commodity falls when its

substitutes become cheap. If there are no substitutes for a commodity then demand for it

does not fall even though their price increases.


Advertisement and salesmanship:

Clever and persistent advertisement and efficient salesmanship create new demand and

increase the existing demand.


Complementary goods:


Babasabpatilfreepptmba.com                                                     Page 35
“DEMAND ESTIMATE OF MILK FOR INSTITUTIONAL SALES,
                  in Dharwar

These goods are the goods which are demanded together. A change in the demand for

one leads to a similar change in the demand for others.


Technical progress:

The introduction of new products in the market as a result of invention and discoveries

also affects the demand. Demand for old things will decrease while demand for new ones

increase.


COMPANY DEMAND


Company demand is the company’s share of market demand.


This can be expressed as a formula:


Company Demand = Market Demand v Company’s Market Share


A company’s share of market demand depends on how its products, services, prices,

brands and so on are perceived relative to the competitors. All other things being equal,

the company’s market share will depend on the size and effectiveness of its marketing

spending relative to competitors.


Sales Forecast


Babasabpatilfreepptmba.com                                                      Page 36
“DEMAND ESTIMATE OF MILK FOR INSTITUTIONAL SALES,
                  in Dharwar

The Sales Forecast is the expected level of company sales based on a chosen marketing

plan and an assumed marketing environment. Sales Forecast is not necessarily the same

as a “sales target” or a “sales budget”.


A sales target (or goal) is set for the sales force as a way of defining and encouraging

sales effort. Sales targets are often set some way higher than estimated sales to “stretch”

the efforts of the sales force.


A sales budget is a more conservative estimate of the expected volume of sales. It is

primarily used for making current purchasing, production and cash-flow decisions. Sales

budgets need to take into account the risks involved in sales forecasting. They are,

therefore, generally set lower than the sales forecast.


OBTAINING INFORMATION ON MARKET DEMAND


As a starting point for estimating market demand, a company needs to know the actual

industry sales taking place in the market. This involves identifying its competitors and

estimating their sales.


An industry trade association will often collect and publish (sometime only to members)

total industry sales, although rarely listing individual company sales separately. By using

this information, each company can evaluate its performance against the whole market.


Babasabpatilfreepptmba.com                                                        Page 37
“DEMAND ESTIMATE OF MILK FOR INSTITUTIONAL SALES,
                  in Dharwar

This is an important piece of analysis. However, it finds out that overall industry sales

are rising by 15% per year. This must mean that Company is losing market share – its

relative standing in the industry.


Another way to estimate sales is to buy reports from a marketing research firm. These

are usually good sources of information for consumer markets – where retail sales can be

tracked in great detail at the point of sale. Such sources are less useful in industrial

markets which usually rely on distributors.


Estimating Future Demand


Current Company Demand = Current Market Demand x Current Market Share


Very few products or services lend themselves to easy forecasting. These tend to involve

a product whose absolute level or trend of sales is fairly constant and where competition

is either non-existent (e.g. monopolies such as public utilities) or stable (pure

oligopolies). In most markets, total demand and company demand are not stable – which

makes good sales forecasting a critical success factor.
Babasabpatilfreepptmba.com                                                      Page 38
“DEMAND ESTIMATE OF MILK FOR INSTITUTIONAL SALES,
                  in Dharwar

A common method of preparing a sales forecast has three stages:


(1) Prepare a macroeconomic forecast – what will happen to overall economic activity

in the relevant economies in which a product is to be sold.


(2) Prepare an industry sales forecast – what will happen to overall sales in an

industry based on the issues that influence the macroeconomic forecast;


(3) Prepare a company sales forecast – based on what management expect to happen

to the company’s market share


Demand forecasts can be based on three types of information:


(1) What customers say about their intentions to buying new products?


(2) What customers are actually doing in the market?


(3) What customers have done in the past in the market?


Babasabpatilfreepptmba.com                                                  Page 39
“DEMAND ESTIMATE OF MILK FOR INSTITUTIONAL SALES,
                  in Dharwar

The value of a customer intention survey increases when there are a relatively small

number of customers, the cost of reaching them is small, and they have clear intentions.

An alternative way of measuring customer intentions is to sample the opinions of the

sales force or to consult industry experts


(1) The trend: are sales growing, “flat-lining” or in decline?


(2) Seasonal or cyclical factors. Sales are affected by swings in general economic

activity (e.g. increases in the disposable income of consumers may lead to increase in

sales for products in a particular industry). Seasonal and cyclical factors occur in a

regular pattern;


(3) Erratic events; these include strikes, fashion fads, war scares and other disturbances

to the market which need to be isolated from past sales data in order to be able to

identify the more normal pattern of sales


(4) Responses: the results of particular measures that have been taken to increase sales.


Babasabpatilfreepptmba.com                                                        Page 40
“DEMAND ESTIMATE OF MILK FOR INSTITUTIONAL SALES,
                  in Dharwar


                   PART-IV
              DESIGN OF THE STUDY


NEED OF THE STUDY


Babasabpatilfreepptmba.com                  Page 41
“DEMAND ESTIMATE OF MILK FOR INSTITUTIONAL SALES,
                  in Dharwar

        The need for demand analysis of institutional sales of milk arises to predict the

demand for the milk at present and in future days. Ensuring the demand estimation is

vital to our long-term business survival and profitability.

          Demand estimation Surveys are an important tool to help us collect the

information we need to understand and evaluate the market structure. This survey

answers tough questions. A well-designed survey can give answer to the most critical

question, Are our products have potential demand in the market?

       Demand estimation surveys give us the insight we need to define what is

extremely important to our customers. Once we came to know what is most important,

we use the surveys to compare our product and its each section’s performance on the

customers` wants. Surveys help us to identify which sections may need to improve so we

can provide customers to decide how and where to allocate our product in different

segments of the market.


         The need for the conducting this study was to estimate the potential demand of

institutional sales for the company and to know the factors influencing it.


Babasabpatilfreepptmba.com                                                      Page 42
“DEMAND ESTIMATE OF MILK FOR INSTITUTIONAL SALES,
                  in Dharwar


The Research objectives


        To find out the market potentiality.

        To identify the new market opportunities.

        To understand the new prospective of institutional sales of milk in Belguam

           city.

RESEARCH PROCESS


    The research was carried out as per steps of consumer research process. The figure

    below depicts a model of consumer research process.


    STEP1: DEFINE THE OBJECTIVE OF THE RESEARCH


    STEP2: COLLECTING AND EVALUATING SECONDARY DATA


    STEP3: DESIGNING A PRIMARY RESEARCH STUDY


    STEP4: COLLECTING PRIMARY DATA


    STEP5: PROCESSING AND ANALYSING THE DATA


Babasabpatilfreepptmba.com                                                   Page 43
“DEMAND ESTIMATE OF MILK FOR INSTITUTIONAL SALES,
                  in Dharwar


Step1: Define the Objectives of the Research


       The first step in the consumer research is to care fully define the objectives of the

study. The objectives of the study were explained earlier. The objectives of the study

were decided at the vary outset to ensure that research design is appropriate. The

statement of objectives helped to define the type and level of information needed.


Step2: collecting and evaluating secondary data


       A search for secondary data generally follows the statement of objectives.

Secondary information is any data originally generated for some other purpose other

then the present research objectives. It includes findings based on research done by

outside organizations, data generated in-house for earlier studies, details of other related

documents & even customer information collected by the firms sales departments like

sales call reports etc. Locating secondary data is called secondary research.

       In this secondary data was not available, as earlier studies were not carried out on

this topic at on stores level. To meet the objectives primary research was undertaken.


Babasabpatilfreepptmba.com                                                         Page 44
“DEMAND ESTIMATE OF MILK FOR INSTITUTIONAL SALES,
                  in Dharwar


Step3: Designing a primary research study


      The design of a research study is based on the purpose of the study. A quantitative

study was undertaken, as descriptive information was needed.

        Research design is the specification of procedures for collecting &analyzing the

data necessary to identify or react to a problem or opportunity, such that the difference

between the cost of obtaining various levels of accuracy & the expected value of the

information associated with each level accuracy is maximized.


RESEARCH DESIGN  METHODOLOGY


DATA COLLECTION

DATA COLLECTION APPROACH:                                Survey Research

DATA COLLECTION INSTRUMENTS:                             Questionnaires, Attitude scale

SAMPLING PLAN


SAMPLE UNIT:                                             Milk consumption institutions

SAMPLE SIZE:                                              100 Respondents

METHOD OF SAMPLE SIZE DETERMINATION:                       Unaided judgment

SAMPLING PROCEDURE:                                      Non probability sampling


Babasabpatilfreepptmba.com                                                       Page 45
“DEMAND ESTIMATE OF MILK FOR INSTITUTIONAL SALES,
                  in Dharwar

SAMPLING FRAME:                                            Institutional Customers

SAMPLING PLAN:                                       Selection of the customers based on

                                                        the quantity Purchases


STATISTICAL TOOLS


          Simple percentage method

          Measures of central tendency

          Graphical representation tools like charts, tables etc


SURVEY DETAILS


         LOCATION OF SURVEY:                Dharwar

    DURATION OF THE SURVEY:                  16 days.


Step4: Collecting primary Data


       The survey has conducted in all the areas of Dharwarcity during the business

hours. The respondents generally sought no assistance except for one or two questions.

Data collection began in the first week of February and was completed in second third

Babasabpatilfreepptmba.com                                                       Page 46
“DEMAND ESTIMATE OF MILK FOR INSTITUTIONAL SALES,
                  in Dharwar

week of March. On an average took 10 minutes for respondents to answer the

questionnaire. Respondents who were approached during morning hours were reluctant

in filling up the questionnaire because of the time involved in responding. But when the

customers were approached during afternoon and evening, it received encouraging

response. Some of the customers were very enthusiastic. They showed keen interest and

added their views regarding the survey topic.


STEP: 5 PROCESSING AND ANALYSING THE DATA


       Analysis of data is done to build a sort of intellectual Model where the

relationships involved are carefully brought out so that some meaningful inference can

be drawn. It involves the presentation of data through tables, graphs and diagrams.

Statistics was used to translate responses into meaningful information to get the most out

of the collected data. Inferences have been drawn of the analyzed Data with proper

supportive data.


SCOPE OF THE STUDY


       The scope of the study is broader than mere gauging the demand estimation of

institutional sales. It makes an effort to build and strengthen relationship with the


Babasabpatilfreepptmba.com                                                       Page 47
“DEMAND ESTIMATE OF MILK FOR INSTITUTIONAL SALES,
                  in Dharwar

customers. It makes Competition analysis as well as helps in knowing the expectations

of the customers along with the market structure and its consumption pattern.


The result obtained cannot be generalized to all the markets, as the methods for arriving

at the sample size and selecting the sample were unempirical. . The study will help the

company to identify the new segments and need to come up with the new marketing

strategies so to achieve the market leadership and earn the revenues start from the

entering stage. The study will also help the management to decide which strategies are

to be used to tap the potential market


LIMITATIONS OF THE STUDY


     Every study has its own limitations. The limitations of this study are:

          Small Sample size

          Study is restricted by the time

          Absence of direct interference of owners in the outlets.


Babasabpatilfreepptmba.com                                                       Page 48
“DEMAND ESTIMATE OF MILK FOR INSTITUTIONAL SALES,
                  in Dharwar


                             PART V


     DATA ANALYSIS AND INTERPRETATION


Babasabpatilfreepptmba.com                  Page 49
“DEMAND ESTIMATE OF MILK FOR INSTITUTIONAL SALES,
                  in Dharwar


TYPE OF RESPONDENTS
           TYPE OF      NO.OF
           INSTITUTIONS RESPONDENTS
           HOTELS            27
           HOSTELS           5
           HOSPITALS         0
           CANTEENS          15
           MOILE TEA
                             53
           SALES


Babasabpatilfreepptmba.com                  Page 50
“DEMAND ESTIMATE OF MILK FOR INSTITUTIONAL SALES,
                  in Dharwar


                       TYPE OF RESPONDENTS


                                                          27


           53
                                                                   5
                                                               0
                                                     15


    HOTELS      HOSTELS    HOSPITALS     CANTEENS      MOILE TEA SALES


INTERPRETATION:

       The above chart shows that there is more number of respondents is from mobile
tea sales as compared to the hotels, hospitalsand canteens. This is all because the
population of mobile tea sales is more in Dharwar because of their character of mobility.


END USE OF MILK IN HOTELS


Babasabpatilfreepptmba.com                                                       Page 51
“DEMAND ESTIMATE OF MILK FOR INSTITUTIONAL SALES,
                  in Dharwar

                 END               NO.OF
                 PRODUCT          RESPONDENTS
                 TEA/COFFEE       27
                 SWEETS           22
                 CURD             25
                 OTHERS           18


                    END USE OF MILK IN HOTELS


              20%
                                             29%
                                                             TEA/COFFEE
                                                             SWEETS
                                                             CURD
        27%                                                  OTHERS
                                       24%


INTERPRETATION:

   The above graph shows that in all visited hotels every one use milk for preparing tea
and coffee and few of them use for preparing curds as due to the demand because
demand for the curd is more due to the heat in Dharwar city. And in winter season the
demand for tea and coffee increases due to cold and also in rainy season. And from total
number of hotels visited i.e. 27 respondents maximum of them use milk for preparing
sweets as well as others.


Babasabpatilfreepptmba.com                                                      Page 52
“DEMAND ESTIMATE OF MILK FOR INSTITUTIONAL SALES,
                  in Dharwar


END USE OF MILK IN HOSTELS


           END            NO.OF
           PRODUCT        RESPONDENTS
           TEA/COFFEE     05
           SWEETS         0
           CURD           04
           OTHERS         0


              END USE OF MILK IN HOSTELS


                     0%
                                           TEA/COFFEE
     44%
                                           SWEETS
                                           CURD
                                   56%
                                           OTHERS
               0%


INTERPRETATION:


Babasabpatilfreepptmba.com                              Page 53
“DEMAND ESTIMATE OF MILK FOR INSTITUTIONAL SALES,
                  in Dharwar

    The above graph states that in all visited hostels all respondents use milk in preparing
tea and coffee and also maximum respondents use milk for preparing curd due heat in
the city. If hostels start supplying food to the students staying in hostel then this segment
will be of good potential for the NOVA milk.


END USE OF MILK IN CANTEENS


                END               NO.OF
                PRODUCT           RESPONDENTS
                TEA/COFFEE        15
                SWEETS            13
                CURD              15
                OTHERS            05


Babasabpatilfreepptmba.com                                                          Page 54
“DEMAND ESTIMATE OF MILK FOR INSTITUTIONAL SALES,
                  in Dharwar

                  END USE OF MILK IN CANTEENS


                   10%
                                               32%
                                                               TEA/COFFEE
                                                               SWEETS

      31%                                                      CURD
                                                               OTHERS
                                     27%


INTERPRETATION:

   The above figure states that from all the canteen respondents every one uses milk for
preparing tea, coffee and also curd. to increase there market share and also to retain the
existing customers they go In preparing of Varity of sweets and also like other dishes.
The people in Dharwar city are addicted to tea as the demand for coffee in this city is
very less. Even though there is high temperature the people go in for consuming tea.


END USE OF MILK IN MOBILE TEA SALES


Babasabpatilfreepptmba.com                                                        Page 55
“DEMAND ESTIMATE OF MILK FOR INSTITUTIONAL SALES,
                  in Dharwar

               END               NO.OF
               PRODUCT           RESPONDENTS
               TEA/COFFEE        53
               SWEETS            02
               CURD              04
               OTHERS            09


                 13%
          6%                                                  TEA/COFFEE
        3%
                                                              SWEETS
                                                              CURD
                                                              OTHERS
                                          78%


INTERPRETATION:

 The above graph clearly states that end use of milk in mobile tea sales is for preparing
tea and coffee. Due to excess demand for curd and also lassi even the mobile tea sales go
in for preparing another product called as lassi. These people also go in for preparing of
sweets and also others.


Babasabpatilfreepptmba.com                                                       Page 56
“DEMAND ESTIMATE OF MILK FOR INSTITUTIONAL SALES,
                  in Dharwar


TOTAL CONSUMPTION OF MILK BY THE INSTITUTIONS IN A DAY


           TYPE OF     CONSUUMPTION
           INSTITUTION OF MILK PER
                       DAY(LTRS)
           HOTELS            1861
           HOSTELS           18
           HOSPITALS         0
           CANTEENS          687
           MOBILE TEA
                             1300
           SALES


Babasabpatilfreepptmba.com                               Page 57
“DEMAND ESTIMATE OF MILK FOR INSTITUTIONAL SALES,
                  in Dharwar


             1300
                                                                 1861


                         687                18
                                           0


    HOTELS     HOSTELS     HOSPITALS    CANTEENS      MOBILE TEA SALES


INTERPRETATION:

     The above figure clearly sates that from all the visited institutions the total
consumption of milk is 3866 0f liters from all the visited institutions. The demand for
curd, lassi and others depends on the season but the demand for tea and coffee hardly
goes down which is very negligible. In other season the demand for others like badam
milk goes up but in summer there is no demand for others in Dharwar city. The highest
consumer of the milk from all visited institution hotels are ahead and next comes mobile
tea sales.


SOURCES OF MILK FOR HOTELS


Babasabpatilfreepptmba.com                                                      Page 58
“DEMAND ESTIMATE OF MILK FOR INSTITUTIONAL SALES,
                  in Dharwar

               SOURCES            NO. OF LITRES
               LOOSE              734
               NANDINI            437
               DUDH
                                  480
               PANDARI
               KRISHNA            107

               AROKYA             142


             TOTAL CONSUPTION OF MILK IN VISITED
                         HOTELS


                       6%      7%

                                                           39%


             25%


                                     23%


          LOOSE     NANDINI    DUDH PANDARI      KRISHNA     AROKYA


INTERPRETATION:
    The above figure clearly states that for the hotels the major supplier of milk is loose.
These are the people who owns there own buffalo’s and early in the morning they supply
milk to all the hotels. As Dharwar city is surrounded by villagers whose main business is
agriculture and


Babasabpatilfreepptmba.com                                                         Page 59
“DEMAND ESTIMATE OF MILK FOR INSTITUTIONAL SALES,
                  in Dharwar


SOURCES OF MILK FOR HOSTELS


           SOURCES       NO. OF LITRES
           LOOSE         8
           NANDINI       0
           DUDH
                         05
           PANDARI
           KRISHANA      00

           AROKYA        05


Babasabpatilfreepptmba.com                  Page 60
“DEMAND ESTIMATE OF MILK FOR INSTITUTIONAL SALES,
                  in Dharwar

            TOTAL CONSUMPTION OF MILK IN VISITED
                        HOSTELS


                   28%
                                                          44%


              0%

                         28%                  0%


         LOOSE     NANDINI     DUDH PANDARI    KRISHANA     AROKYA


INTERPRETATION:

    The above chart shows that the suppliers for the visited hostels are the milk man who
comes on motor bike these are the people who have almost captured the market in
Dharwar because of there time management, trust, the way they communicate to the
customers and most importantly the quality of the product is very high compared to the
other suppliers. next are the competitors like DUDH PANDARI AND NANDANI. in
this segment other competitors like the local manufacturer KRISHNA and AROKYA are
not that effective.


SOURCES OF MILK FOR CANTEENS


Babasabpatilfreepptmba.com                                                      Page 61
“DEMAND ESTIMATE OF MILK FOR INSTITUTIONAL SALES,
                  in Dharwar

               SOURCES           NO. OF LITRES
               LOOSE             180
               NANDINI           164
               DUDH
                                 180
               PANDARI
               KRISHANA          62

               AROKYA            72


         CONSUMPTION OF MILK IN VISITED CANTEENS


                          10%
               9%                                          31%


            26%
                                                  24%


         LOOSE      NANDINI   DUDH PANDARI      KRISHANA     AROKYA


INTERPRETATION:
     This above graph clearly shows that here in this segment other suppliers like
NANDANI,DUDH PANDARI have made it to capture the market by there promotional
activities and also with there sales force they are able to tap the market in this segment
milk man is slowly loosing there market share. and also other competitors like
KRISHNA AND AROKYA are slowly tapping the market.

Babasabpatilfreepptmba.com                                                        Page 62
“DEMAND ESTIMATE OF MILK FOR INSTITUTIONAL SALES,
                  in Dharwar


SOURCES OF MILK FOR MOBILE TEA STALLS


           SOURCES       NO. OF LITRES
           LOOSE         537
           NANDINI       302
           DUDH
                         267
           PANDARI
           KRISHANA      62

           AROKYA        132


Babasabpatilfreepptmba.com                  Page 63
“DEMAND ESTIMATE OF MILK FOR INSTITUTIONAL SALES,
                  in Dharwar

        CONSUMPTION OF MILK IN VISITED MOBILE TEA
                        SALES


                                                            LOOSE
                                                            NANDINI
                                                            DUDH PANDARI
                                                            KRISHANA
                                                            AROKYA


INTERPRETATION:

       The above chart clearly states that in this segment the milk man are the primary
suppliers to all the mobile tea stalls. Other competitors are also heading very closely to
the market leaders in tapping the market. The milk men are very comfortable with the
relation with the owners of the tea stalls and also there flexibility towards the mode of
payment. These are the reasons why the milk men or local dairy are the market leaders in
this segment.


TOTAL CONSUMPTION PATTERN OF MILK IN DHARWAR CITY BY THE
INSTITUTIONS


Babasabpatilfreepptmba.com                                                       Page 64
“DEMAND ESTIMATE OF MILK FOR INSTITUTIONAL SALES,
                  in Dharwar

                                     NO.OF
                                     RESPONDENTS
               END
                                     AND THE
               PRODUCT
                                     USAGE
                                     (OUT OF 100 )
               TEA/COFFEE            98
               SWEETS                38
               CURD                  56
               OTHERS                24


         CONSUMPTION PATTERN OF MILK IN BIJAPUR
                         CITY


                            24


              56                                          98


                                38


                   TEA/COFFEE        SWEETS   CURD   OTHERS


INTERPRETATION:

       The above chart clearly states that the end use of milk in Dharwar city is mainly
in preparing of Tea/Coffee. As also earlier stated that the people over in Dharwar are
very much addicted towards consumption of Tea/Coffee. Due to high temperature in this

Babasabpatilfreepptmba.com                                                      Page 65
“DEMAND ESTIMATE OF MILK FOR INSTITUTIONAL SALES,
                  in Dharwar

city much of the respondents use milk in preparing curd. And few other respondents use
milk in preparing verity of items..


SUPPLY SCHEDULE OF MILK IN DHARWAR CITY


                               SULLY CHEDULE
           SOURCES             OF MILK IN
                               DHARWAR
           NADINI              5-00 AM
           DUDH
                               5-00 AM
           PANDARI
           KRISHNA             4-45 AM

           AROKYA              5-00 AM

           LOCAL MILK          5-00 AM TO 7 AM


Babasabpatilfreepptmba.com                                                    Page 66
“DEMAND ESTIMATE OF MILK FOR INSTITUTIONAL SALES,
                  in Dharwar


MODE OF PAYMENT FOR SUPPLIERS


           MODE OF
                         RESPONDENTS
           PAMENT
           CASH          82
           CREDIT        18


Babasabpatilfreepptmba.com                  Page 67
“DEMAND ESTIMATE OF MILK FOR INSTITUTIONAL SALES,
                  in Dharwar


                          MODE OF PAYMENT


                    18%


                                                   82%


                               CASH    CREDIT


INTERPRETATION:

      The above chart shows that all the suppliers believe in cash and carry policy. Few
of brand go for giving in credit for the customers this is because the suppliers do not
want any clashes in their business .Few of milk men go in for giving credit to those
customers who are well known to them and even if credit is given the collection is done
within couple of days as it is daily business.


MAIN SOURCES OF MILK


Babasabpatilfreepptmba.com                                                       Page 68
“DEMAND ESTIMATE OF MILK FOR INSTITUTIONAL SALES,
                  in Dharwar

           SOURCES OF         CONSUUMPTION
           MILK               OF MILK PER
                              DAY(LTRS)
           NANDINI            249
           SAHYADRI           828
           MORANA             1118
           AROKYA             534
           LOOSE/LOCA
                              1177
           L


            MAIN SOURCES OF MILK IN BIJAPUR


                                      249
          1177
                                                      828


                534
                                            1118


      NANDINI     SAHYADRI   MORANA    AROKYA      LOOSE/LOCAL


INTERPRETATION:

Babasabpatilfreepptmba.com                                       Page 69
“DEMAND ESTIMATE OF MILK FOR INSTITUTIONAL SALES,
                  in Dharwar


      The above figure clearly mentions that the market leader in all segments are local
dairy and milk men this is all because of earlier stated the good relation, trust,
reliability, time management.


                                         PART-VI

                                   FINDINGS


Babasabpatilfreepptmba.com                                                       Page 70
“DEMAND ESTIMATE OF MILK FOR INSTITUTIONAL SALES,
                  in Dharwar


FINDINGS
During the survey it is found that Dharwar is very much potential market for “NOVA

MILK” of KALPATARU DAIRY, as there is always scope for such products which are

of good quality and the city has more disposable income, day by day it is increasing as

you find at least 2-3 people getting employed and minimum 2 to 3 people starting up

new business it might be kirana shop or dealers for any company, so the people in this

city are ready to spend the money for good product and for such products which are

good for health.

                   During the survey it was found that local dairy is the only person who

is satisfying the need of the customers. There fore it will be a good potential market for

NOVA MILK and also other player “DUDH PANDARI” have come very aggressive

into the market with good promotional activity and the people here say that the quality of

this product is “OK”. This product is produced in solapur (Maharashtra). As the border

of Karnataka and Maharashtra is very near to this city we find outside company doing

good business in Dharwar.


Babasabpatilfreepptmba.com                                                       Page 71
“DEMAND ESTIMATE OF MILK FOR INSTITUTIONAL SALES,
                  in Dharwar

                 Due to the brand name and efforts of aggressive promotional strategies

initially the “NANDANI” is also making a very good business in this city. It has already

captured 31% of total market. “AROKYA” is struggling to tap the market as market

leaders like LOCAL DAIRY,NANDANI,DUDH PANDARI have captured the almost

total market. But the people here complaint regarding the quality of the product.


         SUGGESTIONS


              The liquid milk should be offered in different range of packets.

              The packing should be very strong and should not give bad smell once

                 it is opened.

              Should maintain good relationship with the retailers as they are main

                 source who will help the company to create brand awareness.

              They can also offer storage devices like refrigerator to bulk buyers.

              Delivery timing should be maintained on time.

              Special care & attention should be given to rural areas as they are the

                un tapped & potential market.


Babasabpatilfreepptmba.com                                                          Page 72
“DEMAND ESTIMATE OF MILK FOR INSTITUTIONAL SALES,
                  in Dharwar

           As early as possible diversification in products range offering should be

             done. Like (curd, buttermilk & milk powder)


Babasabpatilfreepptmba.com                                                   Page 73

Mais conteúdo relacionado

Mais procurados

A Study on Employee Job Satisfaction at KMF
A Study on Employee Job Satisfaction at KMFA Study on Employee Job Satisfaction at KMF
A Study on Employee Job Satisfaction at KMFProjects Kart
 
An organisational study at kmf mother dairy yalahanka new
An organisational study at kmf mother dairy yalahanka newAn organisational study at kmf mother dairy yalahanka new
An organisational study at kmf mother dairy yalahanka newRahul G
 
Report on mother dairy
Report on mother dairyReport on mother dairy
Report on mother dairyANSHU SINGH
 
Dharwad Milk Union Ltd. KMF project
Dharwad Milk Union Ltd. KMF projectDharwad Milk Union Ltd. KMF project
Dharwad Milk Union Ltd. KMF projectyathish Gowda
 
A project report on financial appriasal in diversification project at the ug...
A project report on  financial appriasal in diversification project at the ug...A project report on  financial appriasal in diversification project at the ug...
A project report on financial appriasal in diversification project at the ug...Babasab Patil
 
Project report on Brand awareness n Perception of ACC ltd.
Project report on Brand awareness n Perception of ACC ltd.Project report on Brand awareness n Perception of ACC ltd.
Project report on Brand awareness n Perception of ACC ltd.swati verma
 
Orgniziation study of dharwad milk union MINI PROJECT PPT
Orgniziation study of dharwad milk union  MINI PROJECT PPTOrgniziation study of dharwad milk union  MINI PROJECT PPT
Orgniziation study of dharwad milk union MINI PROJECT PPTBabasab Patil
 
17219649 project-report-ashwani
17219649 project-report-ashwani17219649 project-report-ashwani
17219649 project-report-ashwaniramadevu
 
An organisational study at kmf mother dairy yalahanka new
An organisational study at kmf mother dairy yalahanka newAn organisational study at kmf mother dairy yalahanka new
An organisational study at kmf mother dairy yalahanka newRahul G
 
Internship Project report on Mother Dairy
Internship Project report on Mother DairyInternship Project report on Mother Dairy
Internship Project report on Mother DairyRohit Vikramaditya
 
Comparative study of the financial analysis of Tata steel and Jindal Steel
Comparative study of the financial analysis of Tata steel and Jindal SteelComparative study of the financial analysis of Tata steel and Jindal Steel
Comparative study of the financial analysis of Tata steel and Jindal Steelarchit aggarwal
 
Patna Dairy Project
Patna Dairy ProjectPatna Dairy Project
Patna Dairy ProjectNerminKhan
 

Mais procurados (20)

A Study on Employee Job Satisfaction at KMF
A Study on Employee Job Satisfaction at KMFA Study on Employee Job Satisfaction at KMF
A Study on Employee Job Satisfaction at KMF
 
An organisational study at kmf mother dairy yalahanka new
An organisational study at kmf mother dairy yalahanka newAn organisational study at kmf mother dairy yalahanka new
An organisational study at kmf mother dairy yalahanka new
 
Report on mother dairy
Report on mother dairyReport on mother dairy
Report on mother dairy
 
Anilkmf
AnilkmfAnilkmf
Anilkmf
 
Dharwad Milk Union Ltd. KMF project
Dharwad Milk Union Ltd. KMF projectDharwad Milk Union Ltd. KMF project
Dharwad Milk Union Ltd. KMF project
 
Full report
Full reportFull report
Full report
 
A project report on financial appriasal in diversification project at the ug...
A project report on  financial appriasal in diversification project at the ug...A project report on  financial appriasal in diversification project at the ug...
A project report on financial appriasal in diversification project at the ug...
 
Project report on Brand awareness n Perception of ACC ltd.
Project report on Brand awareness n Perception of ACC ltd.Project report on Brand awareness n Perception of ACC ltd.
Project report on Brand awareness n Perception of ACC ltd.
 
Orgniziation study of dharwad milk union MINI PROJECT PPT
Orgniziation study of dharwad milk union  MINI PROJECT PPTOrgniziation study of dharwad milk union  MINI PROJECT PPT
Orgniziation study of dharwad milk union MINI PROJECT PPT
 
17219649 project-report-ashwani
17219649 project-report-ashwani17219649 project-report-ashwani
17219649 project-report-ashwani
 
SIP REPORT OF AMUL.docx
SIP REPORT OF AMUL.docxSIP REPORT OF AMUL.docx
SIP REPORT OF AMUL.docx
 
saras dairy ajmer
saras dairy ajmersaras dairy ajmer
saras dairy ajmer
 
An organisational study at kmf mother dairy yalahanka new
An organisational study at kmf mother dairy yalahanka newAn organisational study at kmf mother dairy yalahanka new
An organisational study at kmf mother dairy yalahanka new
 
MBA -Project Study Report
MBA -Project Study Report MBA -Project Study Report
MBA -Project Study Report
 
Mother dairy final report
Mother dairy final reportMother dairy final report
Mother dairy final report
 
Internship Project report on Mother Dairy
Internship Project report on Mother DairyInternship Project report on Mother Dairy
Internship Project report on Mother Dairy
 
Bba project
Bba projectBba project
Bba project
 
Comparative study of the financial analysis of Tata steel and Jindal Steel
Comparative study of the financial analysis of Tata steel and Jindal SteelComparative study of the financial analysis of Tata steel and Jindal Steel
Comparative study of the financial analysis of Tata steel and Jindal Steel
 
Project Report on AMUL
Project Report on AMULProject Report on AMUL
Project Report on AMUL
 
Patna Dairy Project
Patna Dairy ProjectPatna Dairy Project
Patna Dairy Project
 

Destaque

Project Report on Amul
Project Report on AmulProject Report on Amul
Project Report on AmulRohan Naik
 
Demand forecasting
Demand forecastingDemand forecasting
Demand forecastingMegha Gupta
 
Demand forecasting of Cadbury
Demand forecasting of Cadbury Demand forecasting of Cadbury
Demand forecasting of Cadbury Rabia Naushad
 
A project report on consumer satisfaction level towards nadini shubham milk i...
A project report on consumer satisfaction level towards nadini shubham milk i...A project report on consumer satisfaction level towards nadini shubham milk i...
A project report on consumer satisfaction level towards nadini shubham milk i...Babasab Patil
 
A project report on consumer perception and preference towards nandini curd ...
A project report on  consumer perception and preference towards nandini curd ...A project report on  consumer perception and preference towards nandini curd ...
A project report on consumer perception and preference towards nandini curd ...Babasab Patil
 
consumer behavior & satisfaction towards Amul milk
consumer behavior & satisfaction towards Amul milkconsumer behavior & satisfaction towards Amul milk
consumer behavior & satisfaction towards Amul milkMorisha Roy
 
Collection of feedback on literature review analysis
Collection of feedback on literature review analysisCollection of feedback on literature review analysis
Collection of feedback on literature review analysisAiden Yeh
 
Demand forecasting
Demand forecastingDemand forecasting
Demand forecastingKeval Patel
 
Production function on parle comany
Production function on parle comanyProduction function on parle comany
Production function on parle comanyDave Sonavvane
 
Project report summer health & hygiene awarness programme hyd 18-may2014
Project report  summer health & hygiene awarness programme  hyd 18-may2014Project report  summer health & hygiene awarness programme  hyd 18-may2014
Project report summer health & hygiene awarness programme hyd 18-may2014Jyoti Social Foundation
 
Consumer Demand Analysis and Forecast for Dell
Consumer Demand Analysis and Forecast for DellConsumer Demand Analysis and Forecast for Dell
Consumer Demand Analysis and Forecast for DellRachit Jauhari
 
Demand estimating and forcasting
Demand estimating and forcastingDemand estimating and forcasting
Demand estimating and forcastingMuntaquir Hasnain
 
Class notes forecasting
Class notes forecastingClass notes forecasting
Class notes forecastingArun Kumar
 

Destaque (20)

Project Report on Amul
Project Report on AmulProject Report on Amul
Project Report on Amul
 
Demand forecasting
Demand forecastingDemand forecasting
Demand forecasting
 
Demand forecasting of Cadbury
Demand forecasting of Cadbury Demand forecasting of Cadbury
Demand forecasting of Cadbury
 
A project report on consumer satisfaction level towards nadini shubham milk i...
A project report on consumer satisfaction level towards nadini shubham milk i...A project report on consumer satisfaction level towards nadini shubham milk i...
A project report on consumer satisfaction level towards nadini shubham milk i...
 
A project report on consumer perception and preference towards nandini curd ...
A project report on  consumer perception and preference towards nandini curd ...A project report on  consumer perception and preference towards nandini curd ...
A project report on consumer perception and preference towards nandini curd ...
 
Amul final pdf
Amul final pdfAmul final pdf
Amul final pdf
 
Questionaire
QuestionaireQuestionaire
Questionaire
 
consumer behavior & satisfaction towards Amul milk
consumer behavior & satisfaction towards Amul milkconsumer behavior & satisfaction towards Amul milk
consumer behavior & satisfaction towards Amul milk
 
Mr milkman
Mr milkmanMr milkman
Mr milkman
 
Collection of feedback on literature review analysis
Collection of feedback on literature review analysisCollection of feedback on literature review analysis
Collection of feedback on literature review analysis
 
Demand forecasting
Demand forecastingDemand forecasting
Demand forecasting
 
Sanchi Group
Sanchi Group Sanchi Group
Sanchi Group
 
Production function on parle comany
Production function on parle comanyProduction function on parle comany
Production function on parle comany
 
Project report summer health & hygiene awarness programme hyd 18-may2014
Project report  summer health & hygiene awarness programme  hyd 18-may2014Project report  summer health & hygiene awarness programme  hyd 18-may2014
Project report summer health & hygiene awarness programme hyd 18-may2014
 
Consumer Demand Analysis and Forecast for Dell
Consumer Demand Analysis and Forecast for DellConsumer Demand Analysis and Forecast for Dell
Consumer Demand Analysis and Forecast for Dell
 
Demand estimating and forcasting
Demand estimating and forcastingDemand estimating and forcasting
Demand estimating and forcasting
 
Pom
PomPom
Pom
 
Sanchi Milk Industry
Sanchi Milk IndustrySanchi Milk Industry
Sanchi Milk Industry
 
Class notes forecasting
Class notes forecastingClass notes forecasting
Class notes forecasting
 
Parle G manufacturing
Parle G manufacturingParle G manufacturing
Parle G manufacturing
 

Semelhante a A project report on demand estimate of milk for institutional sales, in dharwar

Dairy industry in india
Dairy industry in indiaDairy industry in india
Dairy industry in indiaAayush Wadhwa
 
Project Report on Vijaykant Dairy and Food Products Pvt Ltd
Project Report on Vijaykant Dairy and Food Products Pvt LtdProject Report on Vijaykant Dairy and Food Products Pvt Ltd
Project Report on Vijaykant Dairy and Food Products Pvt LtdRakesh Rachayya
 
Emerging opportunities in Indian Dairy Industry : outlook for future
Emerging opportunities in Indian Dairy Industry : outlook for futureEmerging opportunities in Indian Dairy Industry : outlook for future
Emerging opportunities in Indian Dairy Industry : outlook for futureVipin Kumar
 
Blackbook Vijay mirgule
Blackbook Vijay mirguleBlackbook Vijay mirgule
Blackbook Vijay mirguleVijay Mirgule
 
FMCG- DAIRY PRODUCTS
FMCG- DAIRY PRODUCTSFMCG- DAIRY PRODUCTS
FMCG- DAIRY PRODUCTSRiya Aseef
 
toaz.info-vita-dairy-pr_661af707846d7331d16cd20c98d881e4.pdf
toaz.info-vita-dairy-pr_661af707846d7331d16cd20c98d881e4.pdftoaz.info-vita-dairy-pr_661af707846d7331d16cd20c98d881e4.pdf
toaz.info-vita-dairy-pr_661af707846d7331d16cd20c98d881e4.pdfMeenakshiSharma206583
 
DAIRY INDUSTRY.pptx
DAIRY INDUSTRY.pptxDAIRY INDUSTRY.pptx
DAIRY INDUSTRY.pptxMANAK KUMAR
 
Feasibility Study on Dairy Farm in Kheda District of Gujarat
Feasibility Study on Dairy Farm in Kheda District of Gujarat Feasibility Study on Dairy Farm in Kheda District of Gujarat
Feasibility Study on Dairy Farm in Kheda District of Gujarat Harsh Patel
 
Samridhi agri products private limited
Samridhi agri products private limitedSamridhi agri products private limited
Samridhi agri products private limitedprabhat_rbl
 
Indian Dairy Industry - driven by value-added products.pdf
Indian Dairy Industry - driven by value-added products.pdfIndian Dairy Industry - driven by value-added products.pdf
Indian Dairy Industry - driven by value-added products.pdf(AUI) Vadamalai Muthu
 
Market Growth Dynamics of Cheese
Market Growth Dynamics of CheeseMarket Growth Dynamics of Cheese
Market Growth Dynamics of CheeseChandrakant Pawar
 
Dairy Industry in India: Represent the Growth of Value Added Products
Dairy Industry in India: Represent the Growth of Value Added ProductsDairy Industry in India: Represent the Growth of Value Added Products
Dairy Industry in India: Represent the Growth of Value Added ProductsIMARC Group
 
Operational performance of the pondicherry co operative
Operational performance of the pondicherry co operativeOperational performance of the pondicherry co operative
Operational performance of the pondicherry co operativeIAEME Publication
 
ppt on indian Dairy industry
ppt on indian Dairy industryppt on indian Dairy industry
ppt on indian Dairy industryPandit Dixit
 
International Journal of Business and Management Invention (IJBMI)
International Journal of Business and Management Invention (IJBMI)International Journal of Business and Management Invention (IJBMI)
International Journal of Business and Management Invention (IJBMI)inventionjournals
 
After Contents
After ContentsAfter Contents
After ContentsAvik Mitra
 

Semelhante a A project report on demand estimate of milk for institutional sales, in dharwar (20)

Dairy industry in india
Dairy industry in indiaDairy industry in india
Dairy industry in india
 
Project Report on Vijaykant Dairy and Food Products Pvt Ltd
Project Report on Vijaykant Dairy and Food Products Pvt LtdProject Report on Vijaykant Dairy and Food Products Pvt Ltd
Project Report on Vijaykant Dairy and Food Products Pvt Ltd
 
Emerging opportunities in Indian Dairy Industry : outlook for future
Emerging opportunities in Indian Dairy Industry : outlook for futureEmerging opportunities in Indian Dairy Industry : outlook for future
Emerging opportunities in Indian Dairy Industry : outlook for future
 
Project mpr
Project mprProject mpr
Project mpr
 
Blackbook Vijay mirgule
Blackbook Vijay mirguleBlackbook Vijay mirgule
Blackbook Vijay mirgule
 
FMCG- DAIRY PRODUCTS
FMCG- DAIRY PRODUCTSFMCG- DAIRY PRODUCTS
FMCG- DAIRY PRODUCTS
 
toaz.info-vita-dairy-pr_661af707846d7331d16cd20c98d881e4.pdf
toaz.info-vita-dairy-pr_661af707846d7331d16cd20c98d881e4.pdftoaz.info-vita-dairy-pr_661af707846d7331d16cd20c98d881e4.pdf
toaz.info-vita-dairy-pr_661af707846d7331d16cd20c98d881e4.pdf
 
DAIRY INDUSTRY.pptx
DAIRY INDUSTRY.pptxDAIRY INDUSTRY.pptx
DAIRY INDUSTRY.pptx
 
Feasibility Study on Dairy Farm in Kheda District of Gujarat
Feasibility Study on Dairy Farm in Kheda District of Gujarat Feasibility Study on Dairy Farm in Kheda District of Gujarat
Feasibility Study on Dairy Farm in Kheda District of Gujarat
 
Samridhi agri products private limited
Samridhi agri products private limitedSamridhi agri products private limited
Samridhi agri products private limited
 
Indian Dairy Industry - driven by value-added products.pdf
Indian Dairy Industry - driven by value-added products.pdfIndian Dairy Industry - driven by value-added products.pdf
Indian Dairy Industry - driven by value-added products.pdf
 
Market Growth Dynamics of Cheese
Market Growth Dynamics of CheeseMarket Growth Dynamics of Cheese
Market Growth Dynamics of Cheese
 
Dairy Industry in India: Represent the Growth of Value Added Products
Dairy Industry in India: Represent the Growth of Value Added ProductsDairy Industry in India: Represent the Growth of Value Added Products
Dairy Industry in India: Represent the Growth of Value Added Products
 
Operational performance of the pondicherry co operative
Operational performance of the pondicherry co operativeOperational performance of the pondicherry co operative
Operational performance of the pondicherry co operative
 
ppt on indian Dairy industry
ppt on indian Dairy industryppt on indian Dairy industry
ppt on indian Dairy industry
 
Indian Dairy industry- A Brief Study
Indian Dairy industry- A Brief StudyIndian Dairy industry- A Brief Study
Indian Dairy industry- A Brief Study
 
indian dairy sector
indian dairy sectorindian dairy sector
indian dairy sector
 
International Journal of Business and Management Invention (IJBMI)
International Journal of Business and Management Invention (IJBMI)International Journal of Business and Management Invention (IJBMI)
International Journal of Business and Management Invention (IJBMI)
 
After Contents
After ContentsAfter Contents
After Contents
 
Stm anhaar
Stm anhaarStm anhaar
Stm anhaar
 

Mais de Babasab Patil

Segmentation module 4 mba 1st sem by babasab patil (karrisatte)
Segmentation module 4  mba 1st sem by babasab patil (karrisatte)Segmentation module 4  mba 1st sem by babasab patil (karrisatte)
Segmentation module 4 mba 1st sem by babasab patil (karrisatte)Babasab Patil
 
Marketing management module 1 core concepts of marketing mba 1st sem by baba...
Marketing management module 1 core concepts of marketing  mba 1st sem by baba...Marketing management module 1 core concepts of marketing  mba 1st sem by baba...
Marketing management module 1 core concepts of marketing mba 1st sem by baba...Babasab Patil
 
Marketing management module 2 marketing environment mba 1st sem by babasab pa...
Marketing management module 2 marketing environment mba 1st sem by babasab pa...Marketing management module 2 marketing environment mba 1st sem by babasab pa...
Marketing management module 2 marketing environment mba 1st sem by babasab pa...Babasab Patil
 
Marketing management module 4 measuring andforecasting demand mba 1st sem by...
Marketing management module 4  measuring andforecasting demand mba 1st sem by...Marketing management module 4  measuring andforecasting demand mba 1st sem by...
Marketing management module 4 measuring andforecasting demand mba 1st sem by...Babasab Patil
 
Measuring and forecasting demand module 4 mba 1st sem by babasab patil (karri...
Measuring and forecasting demand module 4 mba 1st sem by babasab patil (karri...Measuring and forecasting demand module 4 mba 1st sem by babasab patil (karri...
Measuring and forecasting demand module 4 mba 1st sem by babasab patil (karri...Babasab Patil
 
Notes managerial communication 3 business correspondence and report writing ...
Notes managerial communication  3 business correspondence and report writing ...Notes managerial communication  3 business correspondence and report writing ...
Notes managerial communication 3 business correspondence and report writing ...Babasab Patil
 
Notes managerial communication mod 2 basic communication skills mba 1st sem ...
Notes managerial communication mod 2  basic communication skills mba 1st sem ...Notes managerial communication mod 2  basic communication skills mba 1st sem ...
Notes managerial communication mod 2 basic communication skills mba 1st sem ...Babasab Patil
 
Notes managerial communication mod 4 the job application process mba 1st sem ...
Notes managerial communication mod 4 the job application process mba 1st sem ...Notes managerial communication mod 4 the job application process mba 1st sem ...
Notes managerial communication mod 4 the job application process mba 1st sem ...Babasab Patil
 
Notes managerial communication mod 5 interviews mba 1st sem by babasab patil...
Notes managerial communication mod 5 interviews  mba 1st sem by babasab patil...Notes managerial communication mod 5 interviews  mba 1st sem by babasab patil...
Notes managerial communication mod 5 interviews mba 1st sem by babasab patil...Babasab Patil
 
Notes managerial communication part 1 mba 1st sem by babasab patil (karrisatte)
Notes managerial communication part 1  mba 1st sem by babasab patil (karrisatte)Notes managerial communication part 1  mba 1st sem by babasab patil (karrisatte)
Notes managerial communication part 1 mba 1st sem by babasab patil (karrisatte)Babasab Patil
 
Principles of marketing mba 1st sem by babasab patil (karrisatte)
Principles of marketing mba 1st sem by babasab patil (karrisatte)Principles of marketing mba 1st sem by babasab patil (karrisatte)
Principles of marketing mba 1st sem by babasab patil (karrisatte)Babasab Patil
 
Segmentation module 4 mba 1st sem by babasab patil (karrisatte)
Segmentation module 4  mba 1st sem by babasab patil (karrisatte)Segmentation module 4  mba 1st sem by babasab patil (karrisatte)
Segmentation module 4 mba 1st sem by babasab patil (karrisatte)Babasab Patil
 
Marketing management module 1 important questions of marketing mba 1st sem...
Marketing management module 1  important questions of marketing   mba 1st sem...Marketing management module 1  important questions of marketing   mba 1st sem...
Marketing management module 1 important questions of marketing mba 1st sem...Babasab Patil
 
Discovery shuttle processing NASA before launching the rocket by babasab ...
Discovery shuttle processing  NASA   before  launching the rocket by babasab ...Discovery shuttle processing  NASA   before  launching the rocket by babasab ...
Discovery shuttle processing NASA before launching the rocket by babasab ...Babasab Patil
 
Corporate lessons from__iim__calcutta by babasab patil
Corporate lessons from__iim__calcutta by babasab patil Corporate lessons from__iim__calcutta by babasab patil
Corporate lessons from__iim__calcutta by babasab patil Babasab Patil
 
Communication problems between men and women by babasab patil
Communication problems between men and women by babasab patil Communication problems between men and women by babasab patil
Communication problems between men and women by babasab patil Babasab Patil
 
Brasil waterfall byy babasab patil
Brasil waterfall  byy babasab patil Brasil waterfall  byy babasab patil
Brasil waterfall byy babasab patil Babasab Patil
 
Best aviation photography_ever__bar_none by babasab patil
Best aviation photography_ever__bar_none by babasab patil Best aviation photography_ever__bar_none by babasab patil
Best aviation photography_ever__bar_none by babasab patil Babasab Patil
 
Attitude stone cutter
Attitude stone cutterAttitude stone cutter
Attitude stone cutterBabasab Patil
 
Attitude stone cutter
Attitude stone cutterAttitude stone cutter
Attitude stone cutterBabasab Patil
 

Mais de Babasab Patil (20)

Segmentation module 4 mba 1st sem by babasab patil (karrisatte)
Segmentation module 4  mba 1st sem by babasab patil (karrisatte)Segmentation module 4  mba 1st sem by babasab patil (karrisatte)
Segmentation module 4 mba 1st sem by babasab patil (karrisatte)
 
Marketing management module 1 core concepts of marketing mba 1st sem by baba...
Marketing management module 1 core concepts of marketing  mba 1st sem by baba...Marketing management module 1 core concepts of marketing  mba 1st sem by baba...
Marketing management module 1 core concepts of marketing mba 1st sem by baba...
 
Marketing management module 2 marketing environment mba 1st sem by babasab pa...
Marketing management module 2 marketing environment mba 1st sem by babasab pa...Marketing management module 2 marketing environment mba 1st sem by babasab pa...
Marketing management module 2 marketing environment mba 1st sem by babasab pa...
 
Marketing management module 4 measuring andforecasting demand mba 1st sem by...
Marketing management module 4  measuring andforecasting demand mba 1st sem by...Marketing management module 4  measuring andforecasting demand mba 1st sem by...
Marketing management module 4 measuring andforecasting demand mba 1st sem by...
 
Measuring and forecasting demand module 4 mba 1st sem by babasab patil (karri...
Measuring and forecasting demand module 4 mba 1st sem by babasab patil (karri...Measuring and forecasting demand module 4 mba 1st sem by babasab patil (karri...
Measuring and forecasting demand module 4 mba 1st sem by babasab patil (karri...
 
Notes managerial communication 3 business correspondence and report writing ...
Notes managerial communication  3 business correspondence and report writing ...Notes managerial communication  3 business correspondence and report writing ...
Notes managerial communication 3 business correspondence and report writing ...
 
Notes managerial communication mod 2 basic communication skills mba 1st sem ...
Notes managerial communication mod 2  basic communication skills mba 1st sem ...Notes managerial communication mod 2  basic communication skills mba 1st sem ...
Notes managerial communication mod 2 basic communication skills mba 1st sem ...
 
Notes managerial communication mod 4 the job application process mba 1st sem ...
Notes managerial communication mod 4 the job application process mba 1st sem ...Notes managerial communication mod 4 the job application process mba 1st sem ...
Notes managerial communication mod 4 the job application process mba 1st sem ...
 
Notes managerial communication mod 5 interviews mba 1st sem by babasab patil...
Notes managerial communication mod 5 interviews  mba 1st sem by babasab patil...Notes managerial communication mod 5 interviews  mba 1st sem by babasab patil...
Notes managerial communication mod 5 interviews mba 1st sem by babasab patil...
 
Notes managerial communication part 1 mba 1st sem by babasab patil (karrisatte)
Notes managerial communication part 1  mba 1st sem by babasab patil (karrisatte)Notes managerial communication part 1  mba 1st sem by babasab patil (karrisatte)
Notes managerial communication part 1 mba 1st sem by babasab patil (karrisatte)
 
Principles of marketing mba 1st sem by babasab patil (karrisatte)
Principles of marketing mba 1st sem by babasab patil (karrisatte)Principles of marketing mba 1st sem by babasab patil (karrisatte)
Principles of marketing mba 1st sem by babasab patil (karrisatte)
 
Segmentation module 4 mba 1st sem by babasab patil (karrisatte)
Segmentation module 4  mba 1st sem by babasab patil (karrisatte)Segmentation module 4  mba 1st sem by babasab patil (karrisatte)
Segmentation module 4 mba 1st sem by babasab patil (karrisatte)
 
Marketing management module 1 important questions of marketing mba 1st sem...
Marketing management module 1  important questions of marketing   mba 1st sem...Marketing management module 1  important questions of marketing   mba 1st sem...
Marketing management module 1 important questions of marketing mba 1st sem...
 
Discovery shuttle processing NASA before launching the rocket by babasab ...
Discovery shuttle processing  NASA   before  launching the rocket by babasab ...Discovery shuttle processing  NASA   before  launching the rocket by babasab ...
Discovery shuttle processing NASA before launching the rocket by babasab ...
 
Corporate lessons from__iim__calcutta by babasab patil
Corporate lessons from__iim__calcutta by babasab patil Corporate lessons from__iim__calcutta by babasab patil
Corporate lessons from__iim__calcutta by babasab patil
 
Communication problems between men and women by babasab patil
Communication problems between men and women by babasab patil Communication problems between men and women by babasab patil
Communication problems between men and women by babasab patil
 
Brasil waterfall byy babasab patil
Brasil waterfall  byy babasab patil Brasil waterfall  byy babasab patil
Brasil waterfall byy babasab patil
 
Best aviation photography_ever__bar_none by babasab patil
Best aviation photography_ever__bar_none by babasab patil Best aviation photography_ever__bar_none by babasab patil
Best aviation photography_ever__bar_none by babasab patil
 
Attitude stone cutter
Attitude stone cutterAttitude stone cutter
Attitude stone cutter
 
Attitude stone cutter
Attitude stone cutterAttitude stone cutter
Attitude stone cutter
 

A project report on demand estimate of milk for institutional sales, in dharwar

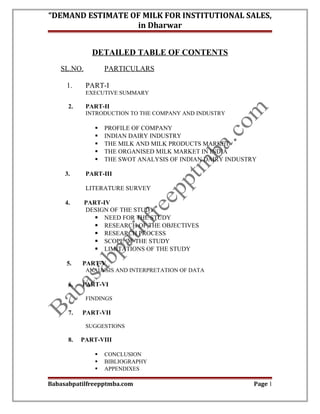
  • 1. “DEMAND ESTIMATE OF MILK FOR INSTITUTIONAL SALES, in Dharwar DETAILED TABLE OF CONTENTS SL.NO. PARTICULARS 1. PART-I EXECUTIVE SUMMARY 2. PART-II INTRODUCTION TO THE COMPANY AND INDUSTRY  PROFILE OF COMPANY  INDIAN DAIRY INDUSTRY  THE MILK AND MILK PRODUCTS MARKET  THE ORGANISED MILK MARKET IN INDIA  THE SWOT ANALYSIS OF INDIAN DAIRY INDUSTRY 3. PART-III LITERATURE SURVEY 4. PART-IV DESIGN OF THE STUDY  NEED FOR THE STUDY  RESEARCH OF THE OBJECTIVES  RESEARCH PROCESS  SCOPE OF THE STUDY  LIMITATIONS OF THE STUDY 5. PART-V ANALYSIS AND INTERPRETATION OF DATA 6. PART-VI FINDINGS 7. PART-VII SUGGESTIONS 8. PART-VIII  CONCLUSION  BIBLIOGRAPHY  APPENDIXES Babasabpatilfreepptmba.com Page 1
  • 2. “DEMAND ESTIMATE OF MILK FOR INSTITUTIONAL SALES, in Dharwar PART-II INTRODUCTION TO THE COPMANY INDUSTRY PROFILE Babasabpatilfreepptmba.com Page 2
  • 3. “DEMAND ESTIMATE OF MILK FOR INSTITUTIONAL SALES, in Dharwar COMPANY PROFILE: Kalpataru dairy has been started in the year 1998 and in the year 2004 it has been purchased by the young entrepreneur of Dharwar, Mr. Vijay Mane. Now kalpataru dairy is running under the keen observations of Mr. Vijay Mane. It is located near khalaghatagi city. It is operating in Dharwar and Dharwar regions. It is also one of largest milk producers in the market. The company is very enthusiastic and more ambitioned to cater and carve the new markets in the North Karnataka. The company has good market share in the Dharwar and dharwar regions. They are achieving higher market share in that region by practicing good marketing strategies. Kalpataru dairy has a good number of satisfied customers in the market. The company is using many new product development strategies to satisfy the customers. Its one among the many dairies which are producing good quality standard toned milk. It has many institutional and domestic customers for their milk. The company has widened its market share about 5% this year. They are now looking for the Belguam market as an institutional segment. Babasabpatilfreepptmba.com Page 3
  • 4. “DEMAND ESTIMATE OF MILK FOR INSTITUTIONAL SALES, in Dharwar INDIAN DAIRY INDUSTRY PROFILE INTRODUCTION India's high-value, high-volume market for traditional dairy products and delicacies is all set to boom further under the technology of mass production. This market is the largest in value after liquid milk and is estimated at US $3 billion in India. More and more dairy plants in the public, cooperative and private sectors in India are going in for the manufacture of traditional milk products. This trend will undoubtedly give a further stimulus to the milk consumption in the country and ensure a better price to primary milk producers. Simultaneously, it will also help to productively utilize India's growing milk surplus. Milk production in India increased from 17 million tons in 1950-51 to 89.6 million tons in 2004-05. India has rapidly positioned itself as the world's largest producer of milk. Producing milk in rural areas through smallholder producer cooperatives and moving industrially-processed milk from these smallholder sources to urban demand centers became the cornerstone of government dairy development policy. This policy initiative Babasabpatilfreepptmba.com Page 4
  • 5. “DEMAND ESTIMATE OF MILK FOR INSTITUTIONAL SALES, in Dharwar gave a boost to dairy development and initiated the process of establishing the much- needed linkages between rural producers and urban consumers. The performance of the Indian dairy sector during the past three decades has been truly impressive. Milk production grew at an average annual rate of 4.6 percent during the 1970s, 5.7 percent during the 1980s, and 4.2 percent during the 1990s. Despite its being the largest milk producer in the world, India's per capita availability of milk is one of the lowest in the world, although it is high by developing country standards. The per capita availability of milk expanded substantially during the 1980s and 1990s and reached about 226 grams per day in 2003-04 the per capita consumption of milk and milk products in India is among the highest in Asia, but it is still growing. It is still below the world average of 285 grams per day, and also the minimum nutritional requirement of 280 grams per day as recommended by the Indian Council of Medical Research (ICMR). Several factors have contributed to increased milk production. First, milk and dairy products have cultural significance in the Indian diet. A large portion of the population is lacto-vegetarian, so milk and dairy products are an important source of protein in the diet. The demand for milk and dairy products is income-responsive, and growth in per capita income is expected to increase demand for milk and milk products. Despite the fact that dairy production in India is widespread throughout the country and overwhelmingly carried out by small-scale producers, there are still large interregional and interstate variations in milk production. Roughly two-thirds of national milk Babasabpatilfreepptmba.com Page 5
  • 6. “DEMAND ESTIMATE OF MILK FOR INSTITUTIONAL SALES, in Dharwar production comes from the states of Uttar Pradesh, Punjab, Rajasthan, Madhya Pradesh, Maharashtra, Gujarat, Andhra Pradesh, and Haryana. However, there have been some shifts in milk production shares of different states. In 2001-02, Uttar Pradesh was the largest milk producer in the country, with about 16.5 million tons of milk, followed by Punjab (8.4 million tons), Rajasthan (6.3 million tons), Madhya Pradesh (6.1 million tons), Maharashtra (6 million tons), and Gujarat (5.6 million tons). The eastern region is lagging behind in terms of dairy development, and imports milk from surplus areas in the West and North. INDIAN DAIRY INDUSTRY — A PROFILE — The annual milk production is presently 92 million tonnes, contributing around Rs. 1000 billions to the GDP. — Provides assured and remunerative employment round-the-year to 60 millions families. — The dairy animals make a substantial contribution to household food security by providing income, quality food, energy, fertilizer and assets in over majority of the rural households in India. — The Animal Husbandry is the single largest contributor under the agriculture sector which provides a remunerative employment round the year at a very small investment. The dairy animals make a substantial contribution to household food security by Babasabpatilfreepptmba.com Page 6
  • 7. “DEMAND ESTIMATE OF MILK FOR INSTITUTIONAL SALES, in Dharwar providing income, quality food, energy, fertilizer and assets in over majority of the rural households in India. These livestock keepers are constrained by poor animal health and veterinary services, lack of feed and fodder, water, milk handling, chilling, etc. Besides, there has been lack of infrastructure facilities such as good roads and access to markets, etc. The livestock keepers also lack access to advanced technologies as well as proper institutional support system. The result is that both the production and productivity remain well below its potentials. Thus the losses and wastages continue to remain high. Adapted breeds and local feed resources although available, but need proven technology supports in its preservation and processing. Such support would substantially improve production and productivity, which would result in higher income for the livestock keepers. One of the problems faced by India is unemployment, despite the rapid growth rate. The problem is more acute in rural educated and marginally educated youths, who have no alternative but to migrate to urban areas. Due to automation in various core sectors, the employment opportunities have dwindled considerably whereas the service sector has its own limitations, especially the high investment cost per job created. In this context, the dairy industry offers a plausible opportunity of creation of self-employment with minimum investment. There is a scope for doubling the present milk production, which can be achieved with marginal investment, such a step would not only enhance milk production and productivity, but also would create millions of additional jobs. Babasabpatilfreepptmba.com Page 7
  • 8. “DEMAND ESTIMATE OF MILK FOR INSTITUTIONAL SALES, in Dharwar Dairying is, in fact, a supplementary activity of the marginal farmers and the landless laborers. It is therefore suggested that dairy and such other animal farming be included within the legal framework of ‘agriculture and agriculture products’. This would enable the marginal farmers and the landless agriculture laborers to benefit from the various government incentives. Milk is no more a luxury, but essential nutritional requirements of human being. The children largely depend on milk for nutrition. Higher milk production therefore will also increase the health status of the farmers and people at large. Due to several inherent reasons, the cost of milk production is high. One of the important reasons is low animal productivity. Because of high cost, the milk and milk products are not affordable to poor strata of the society. Milk is a perishable commodity. Hence, its conversion to products, such as, milk powder, butter and cheese, etc. is necessary. Considering these factors, it is reasonable that at par with agriculture produce, the milk products be also exempted from any excise duty, sales tax and such other taxes. This gesture of the government would go a long way in accelerating the growth of the Indian dairy industry from present annual rate of around 4.5 % to more than 9%. The conversion of excess milk to milk-products is a necessity. The basic principle here is evaporation of water which changes its physical form only, whereas there is no change whatsoever in its chemical composition. One of the reasons of higher cost of milk and milk products is the cost of packaging. To safeguard the quality and safety for human consumption, packaging of milk and milk product is necessary. The milk product manufacturing therefore should be construed as ‘processing milk for preservation’ and it Babasabpatilfreepptmba.com Page 8
  • 9. “DEMAND ESTIMATE OF MILK FOR INSTITUTIONAL SALES, in Dharwar should be exempted from all the taxes and duties like excise, central sales tax and octroi etc. To enhance milk production during the next five years as well as to address the issues referred in the foregoing sentences, there is an imperative need of policy support from the government on the following core areas: - Clean and quality milk production, processing and packaging - Boost the exports of milk and milk products - Enhance milk production and milch animal productivity Indian Dairy: the organized sector is expanding Daily India’s modern dairy sector has expanded rapidly. From an insignificant 200,000 liters per day (lpd) of milk being processed in 1951, the organized sector is presently handling some 20 million lpd in over 400 dairy plants. Already, one of the world’s largest liquid milk plants is located in Delhi and handling over 800,000 liters of milk per day (Mother Dairy, Delhi). India's first automated dairy ‘Mother Dairy ‘ has been established at Babasabpatilfreepptmba.com Page 9
  • 10. “DEMAND ESTIMATE OF MILK FOR INSTITUTIONAL SALES, in Dharwar Gandhi agar near Ahmedabad, Gujarat, in Western India and its capacity is capacity is 1 million lpd. It is owned by India’s biggest dairy cooperative group, in Anand, with an annual turnover in excess of Rs 23 billion (US $500 million). Amul-III with its satellite dairies, with total installed capacity of 1.5 million lpd has also been commissioned. India's first vertical dairy (capacity: 400,000 lpd), owned by the Pradeshik Cooperative Dairy Federation (PCDF) has been commissioned at Noida, outside Delhi Dairy is a place where handling of milk and milk products is done and technology refers to the application of scientific knowledge for practical purposes. In India, dairying has been practiced as a rural cottage industry since the remote past. Semi-commercial dairying started with the establishment of military dairy farms and co- operative milk unions throughout the country towards the end of the nineteenth century. The Indian Dairy Industry has made rapid progress since Independence. A large number of modern milk plants and product factories have since been established. These organized dairies have been successfully engaged in the routine commercial production of pasteurized bottled milk and various Western and Indian dairy products. With modern knowledge of the protection of milk during transportation, it became possible to locate dairies where land was less expensive and crops could be grown more economically. The Winning Edge Three aspects of India’s modern dairy sector are particularly noteworthy. Babasabpatilfreepptmba.com Page 10
  • 11. “DEMAND ESTIMATE OF MILK FOR INSTITUTIONAL SALES, in Dharwar A vast market for dairy products is being built as disposable incomes increase. Its focus is the increasingly affluent middle class, numbering some 300 million — almost the population of the United States — which is confined to well-defined urban pockets and is easily accessible. Milk occupies pride of place as the most coveted food in the Indian diet, after wheat and rice. Milk-based sweets are a culinary delight in all homes throughout the year. The milk production is pre-dominantly rooted in the cooperative system focus is on the small rural farmer having one or two cow/buffaloes, yielding 2-3 liters of milk per animal. This system is the basis of operation flood, the world’s largest dairy development program. The preferred dairy animal is the buffalo. Some 65 per cent of the world buffalo milk is produced in India. It has 30 per cent higher total solids compared to cow milk Babasabpatilfreepptmba.com Page 11
  • 12. “DEMAND ESTIMATE OF MILK FOR INSTITUTIONAL SALES, in Dharwar DAIRY INDUSTRY PROFILE • Human population: 953 million (70 million dairy farmers) • Milk production: 74.3 million tonnes (203.5 million lpd) • Average annual growth rate (1995-2000): 5.6% • Per capita milk availability: 214 g/day or 78 kg/year • Milch animals: 57 million cows; 39 million buffaloes: • Milk yield per breedable bovine in-milk: 1,250 kg • Cattle feed production (organized sector): 1.5 million tonnes • Turnover of veterinary pharmaceuticals: Rs. 550 crores • Dairy plants throughput: 20 mlpd • Throughput as percentage of total milk output: 10 The Dairy Movement in India The dairy cooperative movement in India continues to be unparalleled in the world in terms of its scope and scale. Launched in the Kaira district of Gujarat during India's independence, farmers were encouraged to form a cooperative to counter exploitatively low prices offered for their milk by the monopoly milk supplier, Polson Dairy. The Kaira cooperative launched its operations in 1946 and operated at two levels. The primary village dairy cooperative society of milk producers collaborated with others in the district to form the milk producers union, which procured and processed the milk. The union processed the milk that was procured from the village dairy cooperatives at its processing plants. In addition to collecting surplus milk, the Kaira union assisted Babasabpatilfreepptmba.com Page 12
  • 13. “DEMAND ESTIMATE OF MILK FOR INSTITUTIONAL SALES, in Dharwar members in expanding production. The father of the Indian dairy movement was Varghese Kurien. A mechanical engineer from the Michigan State University, US, Kurien helped India to become the largest producer of milk in the world. As the number of district unions increased, the Kaira cooperative was transformed into the Gujarat Milk Marketing Federation Ltd (GCMMF) under the chairmanship of Kurien. GCMMF coordinated the operations of the union and marketed milk and milk products. As the operations were based in Anand, Gujarat, this came to be known as the Anand model. This model was replicated across India. In 1965, NDDB was formed under the chairmanship of Kurien and was mandated with the task of building cooperative dairies across the country. Operation Flood was launched in 1970, which sought to establish dairy cooperatives across India, get rid of middlemen, remove seasonal price variations and make it economically viable for farmers to undertake production and distribution of milk. Operation Flood achieved phenomenal success: trebling India's annual milk production from 21 million tonnes in 1968 to 89 million tonnes in 2004. Nearly 9 million small producers in 74,000 villages began supplying hygienic and fair priced milk to 300 million consumers and earning revenues of Rs 25 billion in the process. Of the Rs 2 billion invested by World Bank in the second phase of Operation Flood, the net return to the rural economy has been in the region of Rs 240 billion. per year over a period of ten years or a total of Rs 2.4 trillion in all. No other development programme in the world has achieved such success. Several countries like Sri Lanka, Bangladesh, Nepal, the Philippines, Malaysia and some African countries have decided to implement similar projects. The third phase of Operation Flood, implemented during Babasabpatilfreepptmba.com Page 13
  • 14. “DEMAND ESTIMATE OF MILK FOR INSTITUTIONAL SALES, in Dharwar 1985-96 aimed at consolidating the achievements of the first two phases. Infrastructure was strengthened, production enhanced and animal healthcare and nutrition improved. The Operation Flood III programme was funded by a World Bank credit of US $365 million and food aid worth Rs 2226 million. By May 1995, Rs 15.78 billion had been invested in the three phases of Operation Flood. By the time the third phase came to an end, milk processing capacity had grown to 17.2 million liters per day. Chilling capacity of 6.9 million litres per day had been added and milk powder production capacity of 839 tonnes per day had been set up. By 1999, average milk procurement by the cooperatives had grown to 10.2 million liters per day, of which 9.4 million liters was marketed as liquid milk. The remainder was converted into milk powder, butter, cheese, ghee and other traditional milk products. DDB (National Dairy Development Board) has been focusing on intensive R&D activities in animal husbandry through the late 1990s. It has set up an embryo transfer lab at Sabarmati Ashram Gaushala in Ahmedabad. NDDB has also been working on improving nutrition quality of the normal cattle feed. NDDB has made it possible to transport milk over long distances by using over 140 insulated rail milk tankers, each with a capacity of 40,000 liters. This has enabled the National Milk Grid to supply milk to milk-deficient regions in the country. In the year 2000, NDDB (National Dairy Development Board) announced a ten-year plan called Perspective 2010. It is aimed at strengthening the dairy cooperative movement. Babasabpatilfreepptmba.com Page 14
  • 15. “DEMAND ESTIMATE OF MILK FOR INSTITUTIONAL SALES, in Dharwar The major objectives include: • increasing milk procurement by cooperatives from 5.75 mt in 2000 to 17.8 mt in 2010; • increasing the number of dairy cooperative societies from 84,289 in 2000 to 129,480 in 2010; • increasing the membership in dairy cooperatives from 10.62 million in 2000 to 15.62 million in 2010; and • Increasing the amount of milk to be marketed from 4.7 mt in 2000 to 14 mt in 2010. Specific features of dairy in relation to marketing in developing countries The dairy industry in the developing countries has a number of specific features which distinguish it from the other sectors of agriculture and have particular implications for marketing. First, milk consists of over 85% water, and produced daily. Consequently, Babasabpatilfreepptmba.com Page 15
  • 16. “DEMAND ESTIMATE OF MILK FOR INSTITUTIONAL SALES, in Dharwar high costs of transportation are incurred per unit of output marketed. Also, milk being highly perishable, it needs to be used within a short period or processed and transformed into a more stable, longer-storable form. The quality of milk depends on farm management practices, and milk is potentially subject to adulteration, so strict and comprehensive quality regulations may be necessary when marketing involves more than direct delivery by producers to consumers. Second, the vast majority of the dairy farmers are small-scale producers, who produce milk as a source of regular cash income. Dairy production is a labor-intensive enterprise, and dairy marketing activities often provide substantial employment. However, because of asset fixity (high percentage of fixed costs), dairy enterprises often respond to market changes and incentives in a limited and gradual way. Third, milk can be used to make a wide range of high quality palatable and nutritious products, which often imply substantial value added over the cost of the raw material. When production and consumption points are far apart and demand increase rapidly, processing of dairy products becomes very important. Fourth, as a consequence of the above features of milk and the market vulnerability of its producers, cooperatives may assume a strong position in milk processing. A survey by the International Dairy Federation in 1984 revealed that in 21 developed countries together accounting for 55% of the world's milk supply, producer Babasabpatilfreepptmba.com Page 16
  • 17. “DEMAND ESTIMATE OF MILK FOR INSTITUTIONAL SALES, in Dharwar cooperatives marketed 86% of total sales of milk from farm to the first handler. In some of these countries, cooperatives also handled 80-90% of the total processing activity. It may be noted that the history of development of dairy cooperatives in these countries are not always similar. However, in most developing countries, dairy producer cooperatives and cooperative processing are either non-existent or very weak. The need for cooperatives in these countries is driven by the need to capture some economies of scale in transportation and processing where numerous small producers are scattered far away from the consumption centres. In many countries, this gap has been filled by establishment of parastatal dairy enterprises for collection and processing of milk to promote domestic dairy production. In most cases, these enterprises ended up processing subsidized imported dairy products, neglecting the rural dairy sector. The monopolistic character of these enterprises often led to inefficiency thus they failed to serve the interests of domestic producers and consumers. Weaknesses in physical and marketing links between rural producers and urban processors and consumers are among the major constraints to dairy development in the developing countries. It is important to be aware of and understand how such constraints can be addressed in order to devise mechanisms that can transfer growing urban demand into increased livestock production. Inadequate infrastructure and inefficient marketing may lead to increased transactions costs and/or market failure. By better understanding these costs and identifying the ways of reducing their impact, policy prescriptions can be made to promote economic development by fostering production and trade. CHARACTERIZING DAIRY MARKETING SYSTEMS Babasabpatilfreepptmba.com Page 17
  • 18. “DEMAND ESTIMATE OF MILK FOR INSTITUTIONAL SALES, in Dharwar A dairy marketing system is characterized by: • The range of dairy products marketed; • The size, structure and organization of the enterprises participating in the market for each product and in the entire marketing chain; • The conduct and performance of the marketing system; and • The existing marketing policies, institutions and organizations, and the physical environment within which marketing takes place. Functional parameters: These are key descriptors of how the system operates. Examples include dairy products marketed, marketing agents, marketing outlets, prices at each marketing node, modes of transporting marketed products, etc. Functional parameters combine characteristics related to market structure and conduct. Performance indicators: These parameters permit assessment of the performance of the system. Examples are the percentage of total dairy products marketed, the ratio of standardized to non-standardized products marketed; the ratio of marketing to total costs; the ratio of farm gate to retail price. The importance of identifying performance Babasabpatilfreepptmba.com Page 18
  • 19. “DEMAND ESTIMATE OF MILK FOR INSTITUTIONAL SALES, in Dharwar indicators is that they form the baseline against which any changes in the efficiency or performance of the system can be measured. Formal market includes firms and organizations whose daily operations are guided by statutory rules and procedures, e.g. a parastatal dairy processing plant or a company engaged in dairy marketing. Informal market includes firms whose daily operations are not guided by statutory rules and procedures except for any trade license, e.g. dairy producers and itinerant traders. A marketing chain defines the flow of commodities from producers to consumers that brings into place economic agents who perform complementary functions with the aim of satisfying both producers and consumers. A marketing node is defined as any point in the marketing chain where an exchange and/or transformation of a dairy product take place. A marketing chain may link both formal and informal market agents. The Liquid Milk & Milk Products Market Out of a total production of 88 mt of milk, 46per cent is consumed as liquid milk. Less than 30 per cent of milk production – i.e. 26.4 mt – is packaged. Currently barely 778 out of 3,700 cities and towns are served by the milk distribution network, dispensing hygienically packed wholesome, quality pasteurized milk. According to one estimate, the packed milk segment would double in the next five years. Babasabpatilfreepptmba.com Page 19
  • 20. “DEMAND ESTIMATE OF MILK FOR INSTITUTIONAL SALES, in Dharwar The effective milk market is largely confined to urban areas, inhabited by over 25 per cent of the country's population. In urban India, an estimated 50 per cent of the total milk produced is consumed by a population of roughly about 350 million. The expected rise in urban population would be a boon to Indian dairying. Of the three A's of marketing - availability, acceptability and affordability, the dairy sector is at an advantage since Indians are a milk loving people. However what continues to be a challenge is the affordability factor. Volume sales could dramatically increase if small packs of 250 ml or less is made available. Sales of milk powders in mini-sachets, for two cups of tea or coffee, could also help in increasing volumes. Flavored Milk is increasingly becoming the toast of the milk market. The overall market for flavored milk in India is estimated to have grown 27 per cent in value terms in 2004- 05. Milk-based drinks are the flavor of the season as consumers seek healthy lifestyles. Nestlé’s Fruit and Milk and Amrit Foods’ Gagan are the two brands that have a significant presence in this segment Ultra Heat Treatment (UHT) milk or long-shelf-life milk sales are estimated to be in the region of 70 million liters and the segment is growing at a healthy pace of 20-25 per cent per year. Packaged curd and curd products – such as lassi, buttermilk, chhas, set dahi, mishti doi, etc. – are new products and are witnessing a rapid pace of growth. In terms of volumes this just comprises 5 per cent of dairy products, but they are growing at 10 per cent per Babasabpatilfreepptmba.com Page 20
  • 21. “DEMAND ESTIMATE OF MILK FOR INSTITUTIONAL SALES, in Dharwar annum. Flavored yoghurt, which is popular in the West, however, has not been successful in India. Traditional products, such as paneer, mithai, khoa and khoa-based sweets, which are available in the unorganized market, is a huge segment. Apart from Amul which has launched paneer and its Mithaee brand which offers traditional Indian sweets, the organised sector has not tapped into the potential that this sub-category offers. Some facts about organized Milk market in India: Beginning in organized milk handling was made in India with the establishment of Military Dairy Farms. Babasabpatilfreepptmba.com Page 21
  • 22. “DEMAND ESTIMATE OF MILK FOR INSTITUTIONAL SALES, in Dharwar • Handling of milk in Co-operative Milk Unions established all over the country on a small scale in the early stages. • Long distance refrigerated rail-transport of milk from Anand to Bombay since 1945 • Pasteurization and bottling of milk on a large scale for organized distribution was started at Aarey (1950), Calcutta (Haringhata, 1959), Delhi (1959), Worli (1961), Madras (1963) etc. • Establishment of Milk Plants under the Five-Year Plans for Dairy Development all over India. These were taken up with the dual object of increasing the national level of milk consumption and ensuing better returns to the primary milk producer. Their main aim was to produce more, better and cheaper milk. Milk Production data 1950 – 17 million tonnes 1996 – 70.8 million tonnes 1997 – 74.3 mT (Projected) 2020 – 240 mT Expected to reach- 220 to 250 mT – 2020 India contributes to world milk production rise from 12-15 % & it will increase up to 30- 35% (year 2020) SWOT ANALYSIS OF INDIAN DAIRY INDUSTRY Strengths: Babasabpatilfreepptmba.com Page 22
  • 23. “DEMAND ESTIMATE OF MILK FOR INSTITUTIONAL SALES, in Dharwar • Demand profile: Absolutely optimistic. • Margins: Quite reasonable, both on packed and non packed liquid milk. • Flexibility of product mix: tremendous opportunities are present. With balancing equipment, we can keep on adding to your product line. • Availability of raw material: Abundant. Presently, more than 80 per cent of milk produced is flowing into the unorganized sector, which requires proper channelization. • Technical manpower: Professionally-trained, technical human resource pool, built over last 30 years. Weaknesses: • Perishability: Pasteurization has overcome this weakness partially. Surely, many new processes will follow to improve milk quality and extend its shelf life. • Lack of control over yield: Theoretically, there is little control over milk yield. However, increased awareness of developments like embryo transplant, artificial insemination and properly managed animal husbandry practices, coupled with higher income to rural milk producers should automatically lead to improvement in milk yields. Babasabpatilfreepptmba.com Page 23
  • 24. “DEMAND ESTIMATE OF MILK FOR INSTITUTIONAL SALES, in Dharwar • Logistics of procurement: Woes of bad roads and inadequate transportation facility make milk procurement problematic. But with the overall economic improvement in India, these problems would also get solved. • Problematic distribution: Yes, all is not well with distribution. But then if ice creams can be sold virtually at every nook and corner, why can’t we sell other dairy products too? Moreover, it is only a matter of time before we see the emergence of a cold chain linking the producer to the refrigerator at the consumer’s home! • Competition: With so many newcomers entering this industry, competition is becoming tougher day by day. But then competition has to be faced as a ground reality. The market is large enough for many to carve out their niche. Opportunities: "Failure is never final, and success never ending”. If dairy entrepreneurs are looking for opportunities in India, the following areas must be tapped: • Value addition: There is a phenomenal scope for innovations in product development, packaging and presentation. Given below are potential areas of value addition: o Steps should be taken to introduce value-added products like shrikhand, ice creams, paneer, khoa, flavored milk, dairy sweets, etc. This will lead to a greater presence and flexibility in the market place along with opportunities in the field of brand building. Babasabpatilfreepptmba.com Page 24
  • 25. “DEMAND ESTIMATE OF MILK FOR INSTITUTIONAL SALES, in Dharwar o Addition of cultured products like yoghurt and cheese lend further strength - both in terms of utilization of resources and presence in the market place. o A lateral view opens up opportunities in milk proteins through casein, and other dietary proteins, further opening up export management. o Yet another aspect can be the addition of infant foods, geriatric foods and nutritional Export potential: Efforts to exploit export potential are already on. Amul is exporting to Bangladesh, Sri Lanka, Nigeria, and the Middle East. Following the new GATT treaty, opportunities will increase tremendously for the export of agri-products in general and dairy products in particular. Threats: Milk vendors, the un-organized sector: Today milk vendors are occupying the pride of place in the industry. Organized dissemination of information about the harm that they are doing to producers and consumers should see a steady decline in their importance. The study of this SWOT analysis shows that the ‘strengths’ and ‘opportunities’ far outweigh ‘weaknesses’ and ‘threats’. Strengths and opportunities are fundamental and weaknesses and threats are transitory. Any investment idea can do well only when you have three essential ingredients: entrepreneurship (the ability to take risks), innovation approach (in product lines and marketing) and values (of quality/ethics). Babasabpatilfreepptmba.com Page 25
  • 26. “DEMAND ESTIMATE OF MILK FOR INSTITUTIONAL SALES, in Dharwar The Indian dairy industry has been attracting a large number of entrepreneurs. Their success in dairying depends on factors such as an efficient yet economical procurement network, hygienic and cost-effective processing facilities and innovativeness in the market place. All that needs to be done is: to innovate, convert products into commercially exploitable ideas. All the time keep reminding yourself: Benjamin Franklin discovered electricity, but it was the man who invented the meter that really made the money. PART III-LITERATURE SURVEY Babasabpatilfreepptmba.com Page 26
  • 27. “DEMAND ESTIMATE OF MILK FOR INSTITUTIONAL SALES, in Dharwar INSTITUTIONAL SALES The institutional sales are defined as the process of selling the good and services to the customers who will make purchases in bulk quantity. Now in India the rate of consumerism is increasing predominantly these days. The customers are enjoying the purchase experience in the retail outlets. The increased number of consumerism has the strong supporting factors like the augmentation of the disposable income. These increased transactions and higher disposable incomes in Indian markets bring down the opportunities to expand the existing businesses and start a new venture. An institutional sale supports the 80:20 rules of the marketing or sales. These 20% Babasabpatilfreepptmba.com Page 27
  • 28. “DEMAND ESTIMATE OF MILK FOR INSTITUTIONAL SALES, in Dharwar institutional customers purchases 80%of the sales and 80% of the customers’ purchases 20%of the total production. Institutional sales provides very favorable margin to the companies in terms of cash sales and the profit margin is also very high as compared to the daily merchandised factors. Indian business scenario is changing every day. This change has many reasons in it, they all are not happened suddenly, but, all these are the results of LPG policy of 1991. At present every Indian per capital income has increased and the disposable income also raisened these years. These all lead them to have the paramount experience of purchasing process. These all factors gives raise to the more business opportunities generally and institutional sales particularly. Institutional sales more surely influenced by the market structure and demand forecasting data of that industry. It has many determining factors like economical, political, legal, and international factors play a vital role in the institutional sales. For the Indian dairy industry these institutional sales are not fixed. They vary according to the changing demands and other seasonal variations. India is one of hot region in this world. In summers the milk consumption rate as the its end product like cold milk, flavored milk, ice creams, curd, butter milk, etc is very high. So the Babasabpatilfreepptmba.com Page 28
  • 29. “DEMAND ESTIMATE OF MILK FOR INSTITUTIONAL SALES, in Dharwar summer season blossoms the high sales for this milk industry. Hence the milk industry has very changing business for the institutional sales. The dairy industry is growing in India and all the Indians are lacto-vegetarian in nature. Indians want to consume more milk content food in their eating menu. 60% of the produced milk in India is consumed by the urban people and this shows that the urban India is growing fastly. The fast urbanization leads to get more opportunities for these institutional purchasers of milk. These institutional sales are done on the discount rates. The purchasers get a bit high amount of discount in their total purchase. This leads them to get more profit in their manufacturing of their final product and selling. The institutional sales are based on the strong and good relationships with your customers. The customer relationship management (CRM) plays a very vital role in the institutional sales. To boost these institutional sales the manufacturers have to come up with many new marketing strategies in their product promotions and as well a with their product and pricing strategies. The distribution channel also has to be made so lively. The distribution channel has to be o strong and should follow the intensive distribution strategy For this dairy industry the distribution channel are its local operating dealers and other retailers of the market. The dealers are given more commission to achieve the high sales during a period of time. These dealers are very business minded and always push the Babasabpatilfreepptmba.com Page 29
  • 30. “DEMAND ESTIMATE OF MILK FOR INSTITUTIONAL SALES, in Dharwar product into the market which is fetching more commission to them. So its very important to see through this end channels of marketing. Philip kotler suggests that these institutional markets are very volatile in nature. In this market the buzz word “BRAND” plays a very important role. Many customers make the purchase decision on the basis of their preferred and most trusted brand. To boost the institutional sales the companies have to practice the strong brand building strategy in the customer mind sets. They have to make intensive advertisement campaigns to place their product in the customer mind. In institutional sales the quality is main element than the price. The quality has to be maintained as per the prescribed details. DEMAND ANALYSIS. The sale of a product depends upon the demand of that product. but the demand of that product depends upon a number of varied factors. These factors are such as price, buyers income, price of substitute or competing products, advertising and sales promotion, Babasabpatilfreepptmba.com Page 30
  • 31. “DEMAND ESTIMATE OF MILK FOR INSTITUTIONAL SALES, in Dharwar population, availability of credit, changes in buyers tastes, needs and preferences, geographical location, expected future trends in prices etc. there are certain fundamental factors which determine the demand for a product. These factors are price of a product, buyer’s income, prices of related goods and advertising and sales promotion. These factors have high influence on the sales and hence they constitute the controlling variables commonly used in the study of demand. The importance of each of these four factors varies from product to product and for the same product from time to time. What is demand? In the ordinary language the word demand means desire. But mere desire does not constitute demand in the economic sense. Because the person with low income may desire to have a MERCEDEZ BENZ car but this doesn’t constitute a demand for a car because that person doesn’t have adequate money to purchase the car. In other words he does not have the ability to purchase the car. In other words the demand is defined as the human want that are backed by his purchasing power. Demand implies three conditions; a) desire for a commodity or a service Babasabpatilfreepptmba.com Page 31
  • 32. “DEMAND ESTIMATE OF MILK FOR INSTITUTIONAL SALES, in Dharwar b) willingness to pay the price for it, and c) ability to pay price for it. Thus demand for any commodity as a desire for that commodity backed up by willingness and ability to pay. Further demand has no meaning without reference to price. LAW OF DEMAND This law states the relation between the price of commodity and its quantity demanded in the market. the law is” other things remaining equal, the amount of a commodity demanded increases every fall in its price and diminishes with every rise in its price” Thus the quantity of a commodity demanded varies inversely with its price. INCOME EFFECT OF DEMAND A fall in the price of a commodity results in an increase in the real income of the consumer. Because with the same amount of money to be spent on commodity he can now purchase more of it when its price falls. On the contrary a rise in the price of a commodity results in decrease in the real income of the consumer. Because with the same amount of money to be spent on the commodity, he will now purchase less quantity of it when its prices rises. Babasabpatilfreepptmba.com Page 32
  • 33. “DEMAND ESTIMATE OF MILK FOR INSTITUTIONAL SALES, in Dharwar Substitution effect of a demand A fall in the price of commodity leads to an increase in the demand for it, while the price of its substitutions remains constant. On the contrary, a raise in the price of a commodity will make it costlier and lead to a decrease in the demand for it, while prices of its substitutes remain constant. This is the case of contraction of demand are attributed to substitution effect. Normally the substitution effect is stronger than the income effect. Because consumers always substitute the cheaper commodity for the costlier commodity. Income effect has positive only in case of superior goods because if their prices fall the consumers real income will increases and they will , there fore buy more of them. But the income effect is negative in case of inferior goods because if their prices fall the consumers real income increases and they purchase less of such inferior goods. But the substitution effect on the other hand is always positive because consumers always substitute relatively cheaper goods for relatively costlier goods. Thus in the case of superior goods the income effect and substitution effect are both positive. But incase of inferior goods the income effect is negative while the substitution effect is positive FACTORS GOVERNING DEMAND The law of demand states that demand changes whenever prices changes. But this change in demand which is result of a change in price is known as extension or contraction of demand. But demand may also changes due to changes in factors other Babasabpatilfreepptmba.com Page 33
  • 34. “DEMAND ESTIMATE OF MILK FOR INSTITUTIONAL SALES, in Dharwar than price. This change due to changes in factors other than the price. The factors which bring about changes in demand price remaining the same. Changes in population: An increase in the size of population naturally leads to an increase in the demand for various goods and services. Conversely, a decrease in size of the population leads to a decrease in demand for goods and services. Changes in climatic conditions: Demand for certain goods are affected by changes in climatic conditions. Changes in fashion: Changes in fashion bring about changes in demand. Changes in tastes, habits etc: If tastes, habits and customs to which people are accustomed change, demand for goods and services also changes. Changes in quantity of money in circulation: If the quantity of money in circulation increases, people will be having more purchasing power and hence, demand for goods ad services increases. Conversely, if the quantity of Babasabpatilfreepptmba.com Page 34
  • 35. “DEMAND ESTIMATE OF MILK FOR INSTITUTIONAL SALES, in Dharwar money in circulation decreases, people will be having less purchase power and therefore demand for goods and services also decreases. Changes in the distribution of income and wealth: If the income or wealth is distributed more evenly among the various sections of the community, the purchasing power of majority of the people increases and therefore, demands for goods and services increases. Availability of substitutes: If the substitutes are available adequate then demand for commodity falls when its substitutes become cheap. If there are no substitutes for a commodity then demand for it does not fall even though their price increases. Advertisement and salesmanship: Clever and persistent advertisement and efficient salesmanship create new demand and increase the existing demand. Complementary goods: Babasabpatilfreepptmba.com Page 35
  • 36. “DEMAND ESTIMATE OF MILK FOR INSTITUTIONAL SALES, in Dharwar These goods are the goods which are demanded together. A change in the demand for one leads to a similar change in the demand for others. Technical progress: The introduction of new products in the market as a result of invention and discoveries also affects the demand. Demand for old things will decrease while demand for new ones increase. COMPANY DEMAND Company demand is the company’s share of market demand. This can be expressed as a formula: Company Demand = Market Demand v Company’s Market Share A company’s share of market demand depends on how its products, services, prices, brands and so on are perceived relative to the competitors. All other things being equal, the company’s market share will depend on the size and effectiveness of its marketing spending relative to competitors. Sales Forecast Babasabpatilfreepptmba.com Page 36
  • 37. “DEMAND ESTIMATE OF MILK FOR INSTITUTIONAL SALES, in Dharwar The Sales Forecast is the expected level of company sales based on a chosen marketing plan and an assumed marketing environment. Sales Forecast is not necessarily the same as a “sales target” or a “sales budget”. A sales target (or goal) is set for the sales force as a way of defining and encouraging sales effort. Sales targets are often set some way higher than estimated sales to “stretch” the efforts of the sales force. A sales budget is a more conservative estimate of the expected volume of sales. It is primarily used for making current purchasing, production and cash-flow decisions. Sales budgets need to take into account the risks involved in sales forecasting. They are, therefore, generally set lower than the sales forecast. OBTAINING INFORMATION ON MARKET DEMAND As a starting point for estimating market demand, a company needs to know the actual industry sales taking place in the market. This involves identifying its competitors and estimating their sales. An industry trade association will often collect and publish (sometime only to members) total industry sales, although rarely listing individual company sales separately. By using this information, each company can evaluate its performance against the whole market. Babasabpatilfreepptmba.com Page 37
  • 38. “DEMAND ESTIMATE OF MILK FOR INSTITUTIONAL SALES, in Dharwar This is an important piece of analysis. However, it finds out that overall industry sales are rising by 15% per year. This must mean that Company is losing market share – its relative standing in the industry. Another way to estimate sales is to buy reports from a marketing research firm. These are usually good sources of information for consumer markets – where retail sales can be tracked in great detail at the point of sale. Such sources are less useful in industrial markets which usually rely on distributors. Estimating Future Demand Current Company Demand = Current Market Demand x Current Market Share Very few products or services lend themselves to easy forecasting. These tend to involve a product whose absolute level or trend of sales is fairly constant and where competition is either non-existent (e.g. monopolies such as public utilities) or stable (pure oligopolies). In most markets, total demand and company demand are not stable – which makes good sales forecasting a critical success factor. Babasabpatilfreepptmba.com Page 38
  • 39. “DEMAND ESTIMATE OF MILK FOR INSTITUTIONAL SALES, in Dharwar A common method of preparing a sales forecast has three stages: (1) Prepare a macroeconomic forecast – what will happen to overall economic activity in the relevant economies in which a product is to be sold. (2) Prepare an industry sales forecast – what will happen to overall sales in an industry based on the issues that influence the macroeconomic forecast; (3) Prepare a company sales forecast – based on what management expect to happen to the company’s market share Demand forecasts can be based on three types of information: (1) What customers say about their intentions to buying new products? (2) What customers are actually doing in the market? (3) What customers have done in the past in the market? Babasabpatilfreepptmba.com Page 39
  • 40. “DEMAND ESTIMATE OF MILK FOR INSTITUTIONAL SALES, in Dharwar The value of a customer intention survey increases when there are a relatively small number of customers, the cost of reaching them is small, and they have clear intentions. An alternative way of measuring customer intentions is to sample the opinions of the sales force or to consult industry experts (1) The trend: are sales growing, “flat-lining” or in decline? (2) Seasonal or cyclical factors. Sales are affected by swings in general economic activity (e.g. increases in the disposable income of consumers may lead to increase in sales for products in a particular industry). Seasonal and cyclical factors occur in a regular pattern; (3) Erratic events; these include strikes, fashion fads, war scares and other disturbances to the market which need to be isolated from past sales data in order to be able to identify the more normal pattern of sales (4) Responses: the results of particular measures that have been taken to increase sales. Babasabpatilfreepptmba.com Page 40
  • 41. “DEMAND ESTIMATE OF MILK FOR INSTITUTIONAL SALES, in Dharwar PART-IV DESIGN OF THE STUDY NEED OF THE STUDY Babasabpatilfreepptmba.com Page 41
  • 42. “DEMAND ESTIMATE OF MILK FOR INSTITUTIONAL SALES, in Dharwar The need for demand analysis of institutional sales of milk arises to predict the demand for the milk at present and in future days. Ensuring the demand estimation is vital to our long-term business survival and profitability. Demand estimation Surveys are an important tool to help us collect the information we need to understand and evaluate the market structure. This survey answers tough questions. A well-designed survey can give answer to the most critical question, Are our products have potential demand in the market? Demand estimation surveys give us the insight we need to define what is extremely important to our customers. Once we came to know what is most important, we use the surveys to compare our product and its each section’s performance on the customers` wants. Surveys help us to identify which sections may need to improve so we can provide customers to decide how and where to allocate our product in different segments of the market. The need for the conducting this study was to estimate the potential demand of institutional sales for the company and to know the factors influencing it. Babasabpatilfreepptmba.com Page 42
  • 43. “DEMAND ESTIMATE OF MILK FOR INSTITUTIONAL SALES, in Dharwar The Research objectives  To find out the market potentiality.  To identify the new market opportunities.  To understand the new prospective of institutional sales of milk in Belguam city. RESEARCH PROCESS The research was carried out as per steps of consumer research process. The figure below depicts a model of consumer research process. STEP1: DEFINE THE OBJECTIVE OF THE RESEARCH STEP2: COLLECTING AND EVALUATING SECONDARY DATA STEP3: DESIGNING A PRIMARY RESEARCH STUDY STEP4: COLLECTING PRIMARY DATA STEP5: PROCESSING AND ANALYSING THE DATA Babasabpatilfreepptmba.com Page 43
  • 44. “DEMAND ESTIMATE OF MILK FOR INSTITUTIONAL SALES, in Dharwar Step1: Define the Objectives of the Research The first step in the consumer research is to care fully define the objectives of the study. The objectives of the study were explained earlier. The objectives of the study were decided at the vary outset to ensure that research design is appropriate. The statement of objectives helped to define the type and level of information needed. Step2: collecting and evaluating secondary data A search for secondary data generally follows the statement of objectives. Secondary information is any data originally generated for some other purpose other then the present research objectives. It includes findings based on research done by outside organizations, data generated in-house for earlier studies, details of other related documents & even customer information collected by the firms sales departments like sales call reports etc. Locating secondary data is called secondary research. In this secondary data was not available, as earlier studies were not carried out on this topic at on stores level. To meet the objectives primary research was undertaken. Babasabpatilfreepptmba.com Page 44
  • 45. “DEMAND ESTIMATE OF MILK FOR INSTITUTIONAL SALES, in Dharwar Step3: Designing a primary research study The design of a research study is based on the purpose of the study. A quantitative study was undertaken, as descriptive information was needed. Research design is the specification of procedures for collecting &analyzing the data necessary to identify or react to a problem or opportunity, such that the difference between the cost of obtaining various levels of accuracy & the expected value of the information associated with each level accuracy is maximized. RESEARCH DESIGN METHODOLOGY DATA COLLECTION DATA COLLECTION APPROACH: Survey Research DATA COLLECTION INSTRUMENTS: Questionnaires, Attitude scale SAMPLING PLAN SAMPLE UNIT: Milk consumption institutions SAMPLE SIZE: 100 Respondents METHOD OF SAMPLE SIZE DETERMINATION: Unaided judgment SAMPLING PROCEDURE: Non probability sampling Babasabpatilfreepptmba.com Page 45
  • 46. “DEMAND ESTIMATE OF MILK FOR INSTITUTIONAL SALES, in Dharwar SAMPLING FRAME: Institutional Customers SAMPLING PLAN: Selection of the customers based on the quantity Purchases STATISTICAL TOOLS  Simple percentage method  Measures of central tendency  Graphical representation tools like charts, tables etc SURVEY DETAILS LOCATION OF SURVEY: Dharwar DURATION OF THE SURVEY: 16 days. Step4: Collecting primary Data The survey has conducted in all the areas of Dharwarcity during the business hours. The respondents generally sought no assistance except for one or two questions. Data collection began in the first week of February and was completed in second third Babasabpatilfreepptmba.com Page 46
  • 47. “DEMAND ESTIMATE OF MILK FOR INSTITUTIONAL SALES, in Dharwar week of March. On an average took 10 minutes for respondents to answer the questionnaire. Respondents who were approached during morning hours were reluctant in filling up the questionnaire because of the time involved in responding. But when the customers were approached during afternoon and evening, it received encouraging response. Some of the customers were very enthusiastic. They showed keen interest and added their views regarding the survey topic. STEP: 5 PROCESSING AND ANALYSING THE DATA Analysis of data is done to build a sort of intellectual Model where the relationships involved are carefully brought out so that some meaningful inference can be drawn. It involves the presentation of data through tables, graphs and diagrams. Statistics was used to translate responses into meaningful information to get the most out of the collected data. Inferences have been drawn of the analyzed Data with proper supportive data. SCOPE OF THE STUDY The scope of the study is broader than mere gauging the demand estimation of institutional sales. It makes an effort to build and strengthen relationship with the Babasabpatilfreepptmba.com Page 47
  • 48. “DEMAND ESTIMATE OF MILK FOR INSTITUTIONAL SALES, in Dharwar customers. It makes Competition analysis as well as helps in knowing the expectations of the customers along with the market structure and its consumption pattern. The result obtained cannot be generalized to all the markets, as the methods for arriving at the sample size and selecting the sample were unempirical. . The study will help the company to identify the new segments and need to come up with the new marketing strategies so to achieve the market leadership and earn the revenues start from the entering stage. The study will also help the management to decide which strategies are to be used to tap the potential market LIMITATIONS OF THE STUDY Every study has its own limitations. The limitations of this study are:  Small Sample size  Study is restricted by the time  Absence of direct interference of owners in the outlets. Babasabpatilfreepptmba.com Page 48
  • 49. “DEMAND ESTIMATE OF MILK FOR INSTITUTIONAL SALES, in Dharwar PART V DATA ANALYSIS AND INTERPRETATION Babasabpatilfreepptmba.com Page 49
  • 50. “DEMAND ESTIMATE OF MILK FOR INSTITUTIONAL SALES, in Dharwar TYPE OF RESPONDENTS TYPE OF NO.OF INSTITUTIONS RESPONDENTS HOTELS 27 HOSTELS 5 HOSPITALS 0 CANTEENS 15 MOILE TEA 53 SALES Babasabpatilfreepptmba.com Page 50
  • 51. “DEMAND ESTIMATE OF MILK FOR INSTITUTIONAL SALES, in Dharwar TYPE OF RESPONDENTS 27 53 5 0 15 HOTELS HOSTELS HOSPITALS CANTEENS MOILE TEA SALES INTERPRETATION: The above chart shows that there is more number of respondents is from mobile tea sales as compared to the hotels, hospitalsand canteens. This is all because the population of mobile tea sales is more in Dharwar because of their character of mobility. END USE OF MILK IN HOTELS Babasabpatilfreepptmba.com Page 51
  • 52. “DEMAND ESTIMATE OF MILK FOR INSTITUTIONAL SALES, in Dharwar END NO.OF PRODUCT RESPONDENTS TEA/COFFEE 27 SWEETS 22 CURD 25 OTHERS 18 END USE OF MILK IN HOTELS 20% 29% TEA/COFFEE SWEETS CURD 27% OTHERS 24% INTERPRETATION: The above graph shows that in all visited hotels every one use milk for preparing tea and coffee and few of them use for preparing curds as due to the demand because demand for the curd is more due to the heat in Dharwar city. And in winter season the demand for tea and coffee increases due to cold and also in rainy season. And from total number of hotels visited i.e. 27 respondents maximum of them use milk for preparing sweets as well as others. Babasabpatilfreepptmba.com Page 52
  • 53. “DEMAND ESTIMATE OF MILK FOR INSTITUTIONAL SALES, in Dharwar END USE OF MILK IN HOSTELS END NO.OF PRODUCT RESPONDENTS TEA/COFFEE 05 SWEETS 0 CURD 04 OTHERS 0 END USE OF MILK IN HOSTELS 0% TEA/COFFEE 44% SWEETS CURD 56% OTHERS 0% INTERPRETATION: Babasabpatilfreepptmba.com Page 53
  • 54. “DEMAND ESTIMATE OF MILK FOR INSTITUTIONAL SALES, in Dharwar The above graph states that in all visited hostels all respondents use milk in preparing tea and coffee and also maximum respondents use milk for preparing curd due heat in the city. If hostels start supplying food to the students staying in hostel then this segment will be of good potential for the NOVA milk. END USE OF MILK IN CANTEENS END NO.OF PRODUCT RESPONDENTS TEA/COFFEE 15 SWEETS 13 CURD 15 OTHERS 05 Babasabpatilfreepptmba.com Page 54
  • 55. “DEMAND ESTIMATE OF MILK FOR INSTITUTIONAL SALES, in Dharwar END USE OF MILK IN CANTEENS 10% 32% TEA/COFFEE SWEETS 31% CURD OTHERS 27% INTERPRETATION: The above figure states that from all the canteen respondents every one uses milk for preparing tea, coffee and also curd. to increase there market share and also to retain the existing customers they go In preparing of Varity of sweets and also like other dishes. The people in Dharwar city are addicted to tea as the demand for coffee in this city is very less. Even though there is high temperature the people go in for consuming tea. END USE OF MILK IN MOBILE TEA SALES Babasabpatilfreepptmba.com Page 55
  • 56. “DEMAND ESTIMATE OF MILK FOR INSTITUTIONAL SALES, in Dharwar END NO.OF PRODUCT RESPONDENTS TEA/COFFEE 53 SWEETS 02 CURD 04 OTHERS 09 13% 6% TEA/COFFEE 3% SWEETS CURD OTHERS 78% INTERPRETATION: The above graph clearly states that end use of milk in mobile tea sales is for preparing tea and coffee. Due to excess demand for curd and also lassi even the mobile tea sales go in for preparing another product called as lassi. These people also go in for preparing of sweets and also others. Babasabpatilfreepptmba.com Page 56
  • 57. “DEMAND ESTIMATE OF MILK FOR INSTITUTIONAL SALES, in Dharwar TOTAL CONSUMPTION OF MILK BY THE INSTITUTIONS IN A DAY TYPE OF CONSUUMPTION INSTITUTION OF MILK PER DAY(LTRS) HOTELS 1861 HOSTELS 18 HOSPITALS 0 CANTEENS 687 MOBILE TEA 1300 SALES Babasabpatilfreepptmba.com Page 57
  • 58. “DEMAND ESTIMATE OF MILK FOR INSTITUTIONAL SALES, in Dharwar 1300 1861 687 18 0 HOTELS HOSTELS HOSPITALS CANTEENS MOBILE TEA SALES INTERPRETATION: The above figure clearly sates that from all the visited institutions the total consumption of milk is 3866 0f liters from all the visited institutions. The demand for curd, lassi and others depends on the season but the demand for tea and coffee hardly goes down which is very negligible. In other season the demand for others like badam milk goes up but in summer there is no demand for others in Dharwar city. The highest consumer of the milk from all visited institution hotels are ahead and next comes mobile tea sales. SOURCES OF MILK FOR HOTELS Babasabpatilfreepptmba.com Page 58
  • 59. “DEMAND ESTIMATE OF MILK FOR INSTITUTIONAL SALES, in Dharwar SOURCES NO. OF LITRES LOOSE 734 NANDINI 437 DUDH 480 PANDARI KRISHNA 107 AROKYA 142 TOTAL CONSUPTION OF MILK IN VISITED HOTELS 6% 7% 39% 25% 23% LOOSE NANDINI DUDH PANDARI KRISHNA AROKYA INTERPRETATION: The above figure clearly states that for the hotels the major supplier of milk is loose. These are the people who owns there own buffalo’s and early in the morning they supply milk to all the hotels. As Dharwar city is surrounded by villagers whose main business is agriculture and Babasabpatilfreepptmba.com Page 59
  • 60. “DEMAND ESTIMATE OF MILK FOR INSTITUTIONAL SALES, in Dharwar SOURCES OF MILK FOR HOSTELS SOURCES NO. OF LITRES LOOSE 8 NANDINI 0 DUDH 05 PANDARI KRISHANA 00 AROKYA 05 Babasabpatilfreepptmba.com Page 60
  • 61. “DEMAND ESTIMATE OF MILK FOR INSTITUTIONAL SALES, in Dharwar TOTAL CONSUMPTION OF MILK IN VISITED HOSTELS 28% 44% 0% 28% 0% LOOSE NANDINI DUDH PANDARI KRISHANA AROKYA INTERPRETATION: The above chart shows that the suppliers for the visited hostels are the milk man who comes on motor bike these are the people who have almost captured the market in Dharwar because of there time management, trust, the way they communicate to the customers and most importantly the quality of the product is very high compared to the other suppliers. next are the competitors like DUDH PANDARI AND NANDANI. in this segment other competitors like the local manufacturer KRISHNA and AROKYA are not that effective. SOURCES OF MILK FOR CANTEENS Babasabpatilfreepptmba.com Page 61
  • 62. “DEMAND ESTIMATE OF MILK FOR INSTITUTIONAL SALES, in Dharwar SOURCES NO. OF LITRES LOOSE 180 NANDINI 164 DUDH 180 PANDARI KRISHANA 62 AROKYA 72 CONSUMPTION OF MILK IN VISITED CANTEENS 10% 9% 31% 26% 24% LOOSE NANDINI DUDH PANDARI KRISHANA AROKYA INTERPRETATION: This above graph clearly shows that here in this segment other suppliers like NANDANI,DUDH PANDARI have made it to capture the market by there promotional activities and also with there sales force they are able to tap the market in this segment milk man is slowly loosing there market share. and also other competitors like KRISHNA AND AROKYA are slowly tapping the market. Babasabpatilfreepptmba.com Page 62
  • 63. “DEMAND ESTIMATE OF MILK FOR INSTITUTIONAL SALES, in Dharwar SOURCES OF MILK FOR MOBILE TEA STALLS SOURCES NO. OF LITRES LOOSE 537 NANDINI 302 DUDH 267 PANDARI KRISHANA 62 AROKYA 132 Babasabpatilfreepptmba.com Page 63
  • 64. “DEMAND ESTIMATE OF MILK FOR INSTITUTIONAL SALES, in Dharwar CONSUMPTION OF MILK IN VISITED MOBILE TEA SALES LOOSE NANDINI DUDH PANDARI KRISHANA AROKYA INTERPRETATION: The above chart clearly states that in this segment the milk man are the primary suppliers to all the mobile tea stalls. Other competitors are also heading very closely to the market leaders in tapping the market. The milk men are very comfortable with the relation with the owners of the tea stalls and also there flexibility towards the mode of payment. These are the reasons why the milk men or local dairy are the market leaders in this segment. TOTAL CONSUMPTION PATTERN OF MILK IN DHARWAR CITY BY THE INSTITUTIONS Babasabpatilfreepptmba.com Page 64
  • 65. “DEMAND ESTIMATE OF MILK FOR INSTITUTIONAL SALES, in Dharwar NO.OF RESPONDENTS END AND THE PRODUCT USAGE (OUT OF 100 ) TEA/COFFEE 98 SWEETS 38 CURD 56 OTHERS 24 CONSUMPTION PATTERN OF MILK IN BIJAPUR CITY 24 56 98 38 TEA/COFFEE SWEETS CURD OTHERS INTERPRETATION: The above chart clearly states that the end use of milk in Dharwar city is mainly in preparing of Tea/Coffee. As also earlier stated that the people over in Dharwar are very much addicted towards consumption of Tea/Coffee. Due to high temperature in this Babasabpatilfreepptmba.com Page 65
  • 66. “DEMAND ESTIMATE OF MILK FOR INSTITUTIONAL SALES, in Dharwar city much of the respondents use milk in preparing curd. And few other respondents use milk in preparing verity of items.. SUPPLY SCHEDULE OF MILK IN DHARWAR CITY SULLY CHEDULE SOURCES OF MILK IN DHARWAR NADINI 5-00 AM DUDH 5-00 AM PANDARI KRISHNA 4-45 AM AROKYA 5-00 AM LOCAL MILK 5-00 AM TO 7 AM Babasabpatilfreepptmba.com Page 66
  • 67. “DEMAND ESTIMATE OF MILK FOR INSTITUTIONAL SALES, in Dharwar MODE OF PAYMENT FOR SUPPLIERS MODE OF RESPONDENTS PAMENT CASH 82 CREDIT 18 Babasabpatilfreepptmba.com Page 67
  • 68. “DEMAND ESTIMATE OF MILK FOR INSTITUTIONAL SALES, in Dharwar MODE OF PAYMENT 18% 82% CASH CREDIT INTERPRETATION: The above chart shows that all the suppliers believe in cash and carry policy. Few of brand go for giving in credit for the customers this is because the suppliers do not want any clashes in their business .Few of milk men go in for giving credit to those customers who are well known to them and even if credit is given the collection is done within couple of days as it is daily business. MAIN SOURCES OF MILK Babasabpatilfreepptmba.com Page 68
  • 69. “DEMAND ESTIMATE OF MILK FOR INSTITUTIONAL SALES, in Dharwar SOURCES OF CONSUUMPTION MILK OF MILK PER DAY(LTRS) NANDINI 249 SAHYADRI 828 MORANA 1118 AROKYA 534 LOOSE/LOCA 1177 L MAIN SOURCES OF MILK IN BIJAPUR 249 1177 828 534 1118 NANDINI SAHYADRI MORANA AROKYA LOOSE/LOCAL INTERPRETATION: Babasabpatilfreepptmba.com Page 69
  • 70. “DEMAND ESTIMATE OF MILK FOR INSTITUTIONAL SALES, in Dharwar The above figure clearly mentions that the market leader in all segments are local dairy and milk men this is all because of earlier stated the good relation, trust, reliability, time management. PART-VI FINDINGS Babasabpatilfreepptmba.com Page 70
  • 71. “DEMAND ESTIMATE OF MILK FOR INSTITUTIONAL SALES, in Dharwar FINDINGS During the survey it is found that Dharwar is very much potential market for “NOVA MILK” of KALPATARU DAIRY, as there is always scope for such products which are of good quality and the city has more disposable income, day by day it is increasing as you find at least 2-3 people getting employed and minimum 2 to 3 people starting up new business it might be kirana shop or dealers for any company, so the people in this city are ready to spend the money for good product and for such products which are good for health. During the survey it was found that local dairy is the only person who is satisfying the need of the customers. There fore it will be a good potential market for NOVA MILK and also other player “DUDH PANDARI” have come very aggressive into the market with good promotional activity and the people here say that the quality of this product is “OK”. This product is produced in solapur (Maharashtra). As the border of Karnataka and Maharashtra is very near to this city we find outside company doing good business in Dharwar. Babasabpatilfreepptmba.com Page 71
  • 72. “DEMAND ESTIMATE OF MILK FOR INSTITUTIONAL SALES, in Dharwar Due to the brand name and efforts of aggressive promotional strategies initially the “NANDANI” is also making a very good business in this city. It has already captured 31% of total market. “AROKYA” is struggling to tap the market as market leaders like LOCAL DAIRY,NANDANI,DUDH PANDARI have captured the almost total market. But the people here complaint regarding the quality of the product. SUGGESTIONS  The liquid milk should be offered in different range of packets.  The packing should be very strong and should not give bad smell once it is opened.  Should maintain good relationship with the retailers as they are main source who will help the company to create brand awareness.  They can also offer storage devices like refrigerator to bulk buyers.  Delivery timing should be maintained on time.  Special care & attention should be given to rural areas as they are the un tapped & potential market. Babasabpatilfreepptmba.com Page 72
  • 73. “DEMAND ESTIMATE OF MILK FOR INSTITUTIONAL SALES, in Dharwar  As early as possible diversification in products range offering should be done. Like (curd, buttermilk & milk powder) Babasabpatilfreepptmba.com Page 73