Employment Situation (Dec 2011)
•
1 gostou•776 visualizações

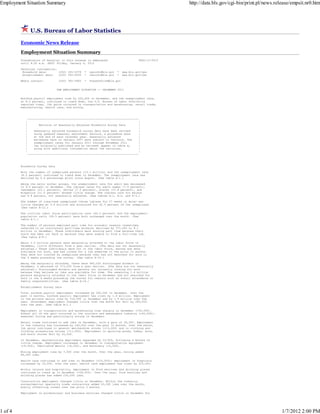
THE EMPLOYMENT SITUATION -- DECEMBER 2011 Nonfarm payroll employment rose by 200,000 in December, and the unemployment rate, at 8.5 percent, continued to trend down, the U.S. Bureau of Labor Statistics reported today. Job gains occurred in transportation and warehousing, retail trade, manufacturing, health care, and mining.

Recomendados
Mais conteúdo relacionado
Mais procurados
Mais procurados (20)
Destaque
Destaque (9)
Semelhante a Employment Situation (Dec 2011)
Semelhante a Employment Situation (Dec 2011) (20)
Mais de BDPA Education and Technology Foundation
Mais de BDPA Education and Technology Foundation (20)
Último
Último (20)
Employment Situation (Dec 2011)
- 1. Employment Situation Summary http://data.bls.gov/cgi-bin/print.pl/news.release/empsit.nr0.htm U.S. Bureau of Labor Statistics Economic News Release Employment Situation Summary Transmission of material in this release is embargoed USDL-12-0012 until 8:30 a.m. (EST) Friday, January 6, 2012 Technical information: Household data: (202) 691-6378 * cpsinfo@bls.gov * www.bls.gov/cps Establishment data: (202) 691-6555 * cesinfo@bls.gov * www.bls.gov/ces Media contact: (202) 691-5902 * PressOffice@bls.gov THE EMPLOYMENT SITUATION -- DECEMBER 2011 Nonfarm payroll employment rose by 200,000 in December, and the unemployment rate, at 8.5 percent, continued to trend down, the U.S. Bureau of Labor Statistics reported today. Job gains occurred in transportation and warehousing, retail trade, manufacturing, health care, and mining. -------------------------------------------------------------------- | | | Revision of Seasonally Adjusted Household Survey Data | | | | Seasonally adjusted household survey data have been revised | | using updated seasonal adjustment factors, a procedure done | | at the end of each calendar year. Seasonally adjusted | | estimates back to January 2007 were subject to revision. The | | unemployment rates for January 2011 through November 2011 | | (as originally published and as revised) appear in table A, | | along with additional information about the revisions. | | | -------------------------------------------------------------------- Household Survey Data Both the number of unemployed persons (13.1 million) and the unemployment rate (8.5 percent) continued to trend down in December. The unemployment rate has declined by 0.6 percentage point since August. (See table A-1.) Among the major worker groups, the unemployment rate for adult men decreased to 8.0 percent in December. The jobless rates for adult women (7.9 percent), teenagers (23.1 percent), whites (7.5 percent), blacks (15.8 percent), and Hispanics (11.0 percent) showed little change. The jobless rate for Asians was 6.8 percent, not seasonally adjusted. (See tables A-1, A-2, and A-3.) The number of long-term unemployed (those jobless for 27 weeks or more) was little changed at 5.6 million and accounted for 42.5 percent of the unemployed. (See table A-12.) The civilian labor force participation rate (64.0 percent) and the employment- population ratio (58.5 percent) were both unchanged over the month. (See table A-1.) The number of persons employed part time for economic reasons (sometimes referred to as involuntary part-time workers) declined by 371,000 to 8.1 million in December. These individuals were working part time because their hours had been cut back or because they were unable to find a full-time job. (See table A-8.) About 2.5 million persons were marginally attached to the labor force in December, little different from a year earlier. (The data are not seasonally adjusted.) These individuals were not in the labor force, wanted and were available for work, and had looked for a job sometime in the prior 12 months. They were not counted as unemployed because they had not searched for work in the 4 weeks preceding the survey. (See table A-16.) Among the marginally attached, there were 945,000 discouraged workers in December, a decrease of 373,000 from a year earlier. (The data are not seasonally adjusted.) Discouraged workers are persons not currently looking for work because they believe no jobs are available for them. The remaining 1.6 million persons marginally attached to the labor force in December had not searched for work in the 4 weeks preceding the survey for reasons such as school attendance or family responsibilities. (See table A-16.) Establishment Survey Data Total nonfarm payroll employment increased by 200,000 in December. Over the past 12 months, nonfarm payroll employment has risen by 1.6 million. Employment in the private sector rose by 212,000 in December and by 1.9 million over the year. Government employment changed little over the month but fell by 280,000 over the year. (See table B-1.) Employment in transportation and warehousing rose sharply in December (+50,000). Almost all of the gain occurred in the couriers and messengers industry (+42,000); seasonal hiring was particularly strong in December. Retail trade continued to add jobs in December, with a gain of 28,000. Employment in the industry has increased by 240,000 over the past 12 months. Over the month, job gains continued in general merchandise stores (+13,000) and in clothing and clothing accessories stores (+11,000). Employment in sporting goods, hobby, book, and music stores fell by 10,000. In December, manufacturing employment expanded by 23,000, following 4 months of little change. Employment increased in December in transportation equipment (+9,000), fabricated metals (+6,000), and machinery (+5,000). Mining employment rose by 7,000 over the month. Over the year, mining added 89,000 jobs. Health care continued to add jobs in December (+23,000); employment in hospitals increased by 10,000. Over the year, health care employment has risen by 315,000. Within leisure and hospitality, employment in food services and drinking places continued to trend up in December (+24,000). Over the year, food services and drinking places has added 230,000 jobs. Construction employment changed little in December. Within the industry, nonresidential specialty trade contractors added 20,000 jobs over the month, mostly offsetting losses over the prior 2 months. Employment in professional and business services changed little in December for 1 of 4 1/7/2012 2:00 PM
- 2. Employment Situation Summary http://data.bls.gov/cgi-bin/print.pl/news.release/empsit.nr0.htm the second month in a row. The industry added 42,000 jobs per month, on average, during the first 10 months of 2011. Government employment changed little in December but was down by 280,000 over the year. Job losses in 2011 occurred in local government; state government, excluding education; and the U.S. Postal Service. The average workweek for all employees on private nonfarm payrolls increased by 0.1 hour to 34.4 hours in December. The manufacturing workweek increased by 0.1 hour to 40.5 hours. Factory overtime decreased by 0.1 hour to 3.2 hours. The average workweek for production and nonsupervisory employees on private nonfarm payrolls edged up by 0.1 hour to 33.7 hours. (See tables B-2 and B-7.) In December, average hourly earnings for all employees on private nonfarm payrolls rose by 4 cents, or 0.2 percent, to $23.24. Over the past 12 months, average hourly earnings have increased by 2.1 percent. In December, average hourly earnings of private-sector production and nonsupervisory employees were unchanged at $19.54. (See tables B-3 and B-8.) The change in total nonfarm payroll employment for October was revised from +100,000 to +112,000, and the change for November was revised from +120,000 to +100,000. __________ The Employment Situation for January is scheduled to be released on Friday, February 3, 2012, at 8:30 a.m. (EST). -------------------------------------------------------------------- | | | Upcoming Changes to Establishment Survey Data | | | | With the release of January 2012 data on February 3, 2012, the | | Current Employment Statistics (CES) survey will introduce revisions| | to nonfarm payroll employment, hours, and earnings data to reflect | | the annual benchmark adjustment for March 2011 and updated | | seasonal adjustment factors. Not seasonally adjusted data | | beginning with April 2010 and seasonally adjusted data beginning | | with January 2007 are subject to revision. | | | | The CES survey also will revise the basis for industry | | classification from the 2007 North American Industry | | Classification System (NAICS) to the 2012 NAICS. The 2012 NAICS | | includes minor changes within the Construction, Manufacturing, | | Retail trade, Utilities, and Leisure and hospitality sectors. | | Several industry titles and descriptions also changed. | | Approximately one percent of employment will be reclassified | | into different industries as a result of the NAICS revision. For | | more information on the 2012 NAICS, visit www.census.gov/epcd/ | | www/naics.html. | | | | In addition to changes resulting from the conversion to the 2012 | | NAICS update, there will be some changes to the list of CES | | series published as a result of the annual benchmarking process. | | For more information on the industry changes effective with the | | release of the January 2012 data, visit www.bls.gov/ces/ | | cesnaics12.htm. | | | | Finally, some historical data prior to April 2010 are subject to | | minor revisions due to the application of a consistent rounding | | method over the entire time series. For additional details see | | www.bls.gov/ces/ceshistchanges.htm. | | | -------------------------------------------------------------------- -------------------------------------------------------------------- | | | Upcoming Changes to the Household Survey | | | | Effective with the release of The Employment Situation for | | January 2012 scheduled for February 3, 2012, population controls | | that reflect the results of Census 2010 will be used in the | | monthly household survey estimation process. Historical data | | will not be revised to incorporate the new controls; consequently, | | household survey data for January 2012 will not be directly | | comparable with that for December 2011 or earlier periods. A | | table showing the effects of the new controls on the major labor | | force series will be included in the January 2012 release. | | | | Also effective with the release of The Employment Situation for | | January 2012, the questions on race and Hispanic or Latino | | ethnicity in the household survey will be modified. The minor | | wording changes in the questions are not expected to affect the | | estimates. | | | | In January 2012, the Census Bureau, which conducts the household | | survey, began a year-long process of reorganizing its regional | | office structure. For more information on these Census Bureau | | changes, see www.census.gov/newsroom/pdf/General_QAs_FINAL2.pdf. | | Both the Census Bureau and the Bureau of Labor Statistics (BLS) | | will monitor survey operations during the transition period. No | | impact on the employment and unemployment estimates from the | | survey is anticipated from this organizational change. | | | -------------------------------------------------------------------- Revision of Seasonally Adjusted Household Survey Data At the end of each calendar year, BLS routinely updates the seasonal adjustment factors for the labor force series derived from the Current Population Survey (CPS), or household survey. As a result of this process, seasonally adjusted data for January 2007 through November 2011 were subject to revision. Table A shows the unemployment rates for January 2011 through November 2011, as first published and as revised. The rates changed by one- tenth of a percentage point in 8 of the 11 months and were unchanged in the remaining 3 months. Revised seasonally adjusted data for other major labor force series beginning in December 2010 appear in table B. An article describing the seasonal adjustment methodology for the household survey data and revised data for January 2011 through November 2011 is available at www.bls.gov/cps/cpsrs2012.pdf. Historical data for the household series contained in the A-tables (A-1--A-16) of this release can be accessed at www.bls.gov/cps/ cpsatabs.htm. Revised historical seasonally adjusted monthly and quarterly data for additional series are available on the Internet at ftp.bls.gov/pub/special.requests/lf/. 2 of 4 1/7/2012 2:00 PM
- 3. Employment Situation Summary http://data.bls.gov/cgi-bin/print.pl/news.release/empsit.nr0.htm Table A. Seasonally adjusted unemployment rates in 2011 and changes due to revision, January - November 2011 Month As first As Change computed revised January ............... 9.0 9.1 0.1 February .............. 8.9 9.0 .1 March ................. 8.8 8.9 .1 April ................. 9.0 9.0 .0 May ................... 9.1 9.0 -.1 June .................. 9.2 9.1 -.1 July .................. 9.1 9.1 .0 August ................ 9.1 9.1 .0 September ............. 9.1 9.0 -.1 October ............... 9.0 8.9 -.1 November .............. 8.6 8.7 .1 HOUSEHOLD DATA Table B. Employment status of the civilian population by sex and age, seasonally adjusted [Numbers in thousands] Employment status, sex, and age 2010 2011 Dec. Jan. Feb. Mar. Apr. May June July Aug. Sept. Oct. Nov. Dec. TOTAL Civilian noninstitutional population(1). 238,889 238,704 238,851 239,000 239,146 239,313 239,489 239,671 239,871 240,071 240,269 240,441 240,584 Civilian labor force ................. 153,613 153,250 153,302 153,392 153,420 153,700 153,409 153,358 153,674 154,004 154,057 153,937 153,887 Participation rate ................. 64.3 64.2 64.2 64.2 64.2 64.2 64.1 64.0 64.1 64.1 64.1 64.0 64.0 Employed ........................... 139,220 139,330 139,551 139,764 139,628 139,808 139,385 139,450 139,754 140,107 140,297 140,614 140,790 Employment-population ratio ....... 58.3 58.4 58.4 58.5 58.4 58.4 58.2 58.2 58.3 58.4 58.4 58.5 58.5 Unemployed ......................... 14,393 13,919 13,751 13,628 13,792 13,892 14,024 13,908 13,920 13,897 13,759 13,323 13,097 Unemployment rate ................ 9.4 9.1 9.0 8.9 9.0 9.0 9.1 9.1 9.1 9.0 8.9 8.7 8.5 Men, 20 years and over Civilian noninstitutional population(1). 107,216 107,203 107,292 107,381 107,469 107,566 107,668 107,773 107,884 107,994 108,104 108,203 108,290 Civilian labor force ................. 78,884 78,594 78,832 78,805 78,895 79,204 79,116 78,977 79,089 79,241 79,291 79,440 79,436 Participation rate ................. 73.6 73.3 73.5 73.4 73.4 73.6 73.5 73.3 73.3 73.4 73.3 73.4 73.4 Employed ........................... 71,494 71,593 71,901 71,918 71,942 72,161 71,981 71,930 72,098 72,340 72,379 72,846 73,080 Employment-population ratio ....... 66.7 66.8 67.0 67.0 66.9 67.1 66.9 66.7 66.8 67.0 67.0 67.3 67.5 Unemployed ......................... 7,390 7,001 6,931 6,887 6,953 7,043 7,135 7,047 6,991 6,901 6,912 6,594 6,356 Unemployment rate ................ 9.4 8.9 8.8 8.7 8.8 8.9 9.0 8.9 8.8 8.7 8.7 8.3 8.0 Women, 20 years and over Civilian noninstitutional population(1). 114,894 114,637 114,714 114,792 114,868 114,954 115,045 115,138 115,238 115,338 115,437 115,526 115,602 Civilian labor force ................. 68,982 68,843 68,818 68,852 68,860 68,878 68,570 68,706 68,784 68,989 68,981 68,711 68,748 Participation rate ................. 60.0 60.1 60.0 60.0 59.9 59.9 59.6 59.7 59.7 59.8 59.8 59.5 59.5 Employed ........................... 63,429 63,403 63,351 63,515 63,431 63,385 63,088 63,257 63,322 63,406 63,520 63,352 63,323 Employment-population ratio ....... 55.2 55.3 55.2 55.3 55.2 55.1 54.8 54.9 54.9 55.0 55.0 54.8 54.8 Unemployed ......................... 5,553 5,440 5,467 5,336 5,430 5,493 5,482 5,449 5,462 5,584 5,461 5,359 5,425 Unemployment rate ................ 8.1 7.9 7.9 7.8 7.9 8.0 8.0 7.9 7.9 8.1 7.9 7.8 7.9 Both sexes, 16 to 19 years Civilian noninstitutional population(1). 16,780 16,863 16,845 16,827 16,809 16,792 16,776 16,760 16,749 16,739 16,728 16,711 16,693 Civilian labor force ................. 5,748 5,813 5,651 5,735 5,665 5,618 5,724 5,675 5,801 5,774 5,785 5,786 5,704 Participation rate ................. 34.3 34.5 33.5 34.1 33.7 33.5 34.1 33.9 34.6 34.5 34.6 34.6 34.2 Employed ........................... 4,297 4,334 4,299 4,332 4,255 4,262 4,316 4,262 4,333 4,362 4,398 4,416 4,387 Employment-population ratio ....... 25.6 25.7 25.5 25.7 25.3 25.4 25.7 25.4 25.9 26.1 26.3 26.4 26.3 Unemployed ......................... 1,451 1,479 1,352 1,404 1,410 1,356 1,408 1,412 1,467 1,412 1,386 1,370 1,316 Unemployment rate ................ 25.2 25.4 23.9 24.5 24.9 24.1 24.6 24.9 25.3 24.5 24.0 23.7 23.1 Footnotes: (1) The population figures are not adjusted for seasonal variation. NOTE: Seasonally adjusted data have been revised to reflect updated seasonal adjustment factors. Employment Situation Summary Table A. Household data, seasonally adjusted Employment Situation Summary Table B. Establishment data, seasonally adjusted Employment Situation Frequently Asked Questions Employment Situation Technical Note Table A-1. Employment status of the civilian population by sex and age Table A-2. Employment status of the civilian population by race, sex, and age Table A-3. Employment status of the Hispanic or Latino population by sex and age Table A-4. Employment status of the civilian population 25 years and over by educational attainment Table A-5. Employment status of the civilian population 18 years and over by veteran status, period of service, and sex, not seasonally adjusted Table A-6. Employment status of the civilian population by sex, age, and disability status, not seasonally adjusted Table A-7. Employment status of the civilian population by nativity and sex, not seasonally adjusted Table A-8. Employed persons by class of worker and part-time status Table A-9. Selected employment indicators Table A-10. Selected unemployment indicators, seasonally adjusted Table A-11. Unemployed persons by reason for unemployment Table A-12. Unemployed persons by duration of unemployment Table A-13. Employed and unemployed persons by occupation, not seasonally adjusted Table A-14. Unemployed persons by industry and class of worker, not seasonally adjusted Table A-15. Alternative measures of labor underutilization Table A-16. Persons not in the labor force and multiple jobholders by sex, not seasonally adjusted Table B-1. Employees on nonfarm payrolls by industry sector and selected industry detail Table B-2. Average weekly hours and overtime of all employees on private nonfarm payrolls by industry sector, seasonally adjusted Table B-3. Average hourly and weekly earnings of all employees on private nonfarm payrolls by industry sector, seasonally adjusted Table B-4. Indexes of aggregate weekly hours and payrolls for all employees on private nonfarm payrolls by industry sector, seasonally adjusted Table B-5. Employment of women on nonfarm payrolls by industry sector, seasonally adjusted Table B-6. Employment of production and nonsupervisory employees on private nonfarm payrolls by industry sector, seasonally adjusted(1) Table B-7. Average weekly hours and overtime of production and nonsupervisory employees on private nonfarm payrolls by industry sector, seasonally adjusted(1) Table B-8. Average hourly and weekly earnings of production and nonsupervisory employees on private nonfarm payrolls by industry sector, seasonally adjusted(1) Table B-9. Indexes of aggregate weekly hours and payrolls for production and nonsupervisory employees on private nonfarm payrolls by industry sector, seasonally adjusted(1) Access to historical data for the "A" tables of the Employment Situation Release Access to historical data for the "B" tables of the Employment Situation Release HTML version of the entire news release The PDF version of the news release Table of Contents Last Modified Date: January 06, 2012 U.S. Bureau of Labor Statistics | Division of Labor Force Statistics, PSB Suite 4675, 2 Massachusetts Avenue, NE Washington, DC 20212-0001U.S. Bureau of Labor Statistics | Division of Current Employment Statistics, PSB Suite 3 of 4 1/7/2012 2:00 PM
- 4. Employment Situation Summary http://data.bls.gov/cgi-bin/print.pl/news.release/empsit.nr0.htm 4860, 2 Massachusetts Avenue, NE Washington, DC 20212-0001 www.bls.gov/CPS | Telephone: 1-202-691-6378 | Contact CPSwww.bls.gov/CES | Telephone: 1-202-691-6555 | Contact CES 4 of 4 1/7/2012 2:00 PM