Ralph paglia optimizing your dealership advertising mix
•Transferir como DOCX, PDF•
0 gostou•537 visualizações

Ralph paglia optimizing your dealership advertising mix

Recomendados
Recomendados
Mais conteúdo relacionado
Mais de Automotive Digital Marketing Professional Community
Mais de Automotive Digital Marketing Professional Community (20)
Último
Último (20)
Ralph paglia optimizing your dealership advertising mix
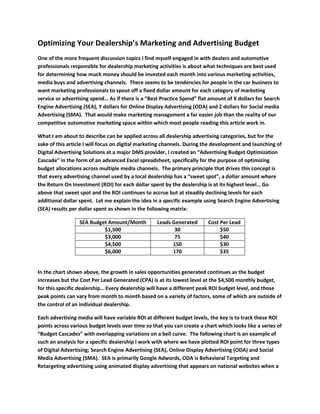
- 1. Optimizing Your Dealership’s Marketing and Advertising Budget One of the more frequent discussion topics I find myself engaged in with dealers and automotive professionals responsible for dealership marketing activities is about what techniques are best used for determining how much money should be invested each month into various marketing activities, media buys and advertising channels. There seems to be tendencies for people in the car business to want marketing professionals to spout off a fixed dollar amount for each category of marketing service or advertising spend… As if there is a “Best Practice Spend” flat amount of X dollars for Search Engine Advertising (SEA), Y dollars for Online Display Advertising (ODA) and Z dollars for Social media Advertising (SMA). That would make marketing management a far easier job than the reality of our competitive automotive marketing space within which most people reading this article work in. What I am about to describe can be applied across all dealership advertising categories, but for the sake of this article I will focus on digital marketing channels. During the development and launching of Digital Advertising Solutions at a major DMS provider, I created an “Advertising Budget Optimization Cascade” in the form of an advanced Excel spreadsheet, specifically for the purpose of optimizing budget allocations across multiple media channels. The primary principle that drives this concept is that every advertising channel used by a local dealership has a “sweet spot”, a dollar amount where the Return On Investment (ROI) for each dollar spent by the dealership is at its highest level… Go above that sweet spot and the ROI continues to accrue but at steadily declining levels for each additional dollar spent. Let me explain the idea in a specific example using Search Engine Advertising (SEA) results per dollar spent as shown in the following matrix: SEA Budget Amount/Month Leads Generated Cost Per Lead $1,500 30 $50 $3,000 75 $40 $4,500 150 $30 $6,000 170 $35 In the chart shown above, the growth in sales opportunities generated continues as the budget increases but the Cost Per Lead Generated (CPA) is at its lowest level at the $4,500 monthly budget, for this specific dealership… Every dealership will have a different peak ROI budget level, and those peak points can vary from month to month based on a variety of factors, some of which are outside of the control of an individual dealership. Each advertising media will have variable ROI at different budget levels, the key is to track these ROI points across various budget levels over time so that you can create a chart which looks like a series of “Budget Cascades” with overlapping variations on a bell curve. The following chart is an example of such an analysis for a specific dealership I work with where we have plotted ROI point for three types of Digital Advertising; Search Engine Advertising (SEA), Online Display Advertising (ODA) and Social Media Advertising (SMA). SEA is primarily Google Adwords, ODA is Behavioral Targeting and Retargeting advertising using animated display advertising that appears on national websites when a
- 2. dealership’s local area (Geotargeted) visitors who are known to be “In Market” visit any of those hundreds of popular websites. SMA is primarily Facebook and YouTube advertising such as “Sponsored Stories” and display ads that appear on top of the play space within YouTube videos targeted based on keywords used in their descriptions and by category. In the chart shown above the peak ROI points for each respective media channel’s budget levels occur at $4,750 for SEA, $7,500 for ODA and $2,200 for SMA… The sum of these three peak ROI levels results in the optimum Digital Advertising monthly budget for this specific dealership, which equals $14,450. The most interesting aspect of this type of approach to media budget allocations is the impact it has on results… When a dealership funds their respective media channels at the optimum spend for maximum ROI within each category of advertising, and the messaging is consistent across each channel, the synergy achieved results in a boost to ROI for the total advertising budget that exceeds the average across all the channels. In the case of impact on SEA from ODA and SMA, the boost to ROI for SEA increases an average of 22% because of the impact that ODA and SMA has on the mix of search queries and their respective conversion rates… Cost per Lead drops across the board! What are the action items you should create as a result of this article? Let’s make a short list:
- 3. 1. Track the ROI of each media channel that your dealership uses to generate opportunities to do business by calculating the cost per phone call, showroom visit, lead and chat session. 2. Create an Excel spreadsheet that tracks these ROI levels over time… There are several examples available for download in the Forum section at www.ADMPC.com 3. Determine the peak ROI point for each media channel and add each channel’s peak ROI budget level up to determine your recommended advertising budget total for the channels tracked. 4. Continue measuring these ROI levels with an objective of raising the overall ROI level based on shifting and adjusting each media channel’s budget allocation over time. Written by Ralph Paglia Editor-in-Chief Automotive Digital Marketing Professional Community