SlideShare uma empresa Scribd logo
1 de 210
Baixar para ler offline
1Journal of Data on the Prevention and Eradication of Drug Abuse and Illicit Trafficking (P4GN)
Year 2013 Edition 2014
CHAPTER I
INTRODUCTION
1. Drug Abuse and Illicit Trafficking at Global Level.
The 2013 Annual Report issued by United Nations Office on Drugs and Crime
(UNODC) stated that in 2011 an estimation of 167 to 315 million people take drugs the
minimum of once in a year (equivalent to 3.6-6.9% of the world population between
the age of 15-64 years).
Among the narcotics, Cannabis (marihuana) is the most consumed drug in the
world. The prevalence of abuse ranges from 2.9% - 4.3% per year among the world
population between the age of 15-64 years. Legalization of cannabis has been applied
in the the following countries: the States of New York and Colorado of the United
States, Netherland, Germany (for personal use of 6 grams), Argentine, Cyprus (15
grams), Equador, Mexico (5 grams), Peru (8 grams), Switzerland (4 cigarettes), Belgium
(3 grams), Brazil, Uruguay, Paraguay (10 grams), Colombia (20 grams) and Australia.
The global abuse of Cocaine is estimated to range from 15%-19.3% yearly
(prevalence of 0.3-0.4% per year). Meanwhile, a decrease was seen in the West and
Central Europe related to the abuse and trafficking in cocaine, from 1.3% in 2010 to
1.2% in 2011; this decrease also occurred in North America, from 1.6% in 2010 to 1.5%
in 2011.
The highest prevalence of opiates abuse was reported in the regions of South-
West Asia (1,2%), in particular the states of Afghanistan, Iran and Pakistan, Central
Asia, South Europe (0.8%), North America (0.5%), and Central Africa (0.4%).
Abuse of Amphetamine-Type Stimulants (ATS) including Ecstasy, has made a
wide spread and increased all over the world, namely: Oceania (2.9%), North America
(0,9%) and Europe (0.7%). Pakistan has become a country of emergency for the
prevalence of ATS abuse, covering 0.1% of the total population. An increase is also
seen in Oceania (2.1%), Australia, New Zealand, Central America and North America,
respectively 1.3%, Africa (0.9%), and Asia (0.7%).
UNODC reported that Afghanistan placed the highest rank in the production and
cultivation of opium poppy in 2012 (74%). Cultivation of opium poppy increased by
15% in 2012; however, the production of opium in Myanmar decreased by 30%, or the
equivalent of 5,000 tons compared to 2012. Meanwhile, Mexico is reported to be the
llargest country of opium poppy in the continent of America. Known as the source of
illicit trafficking in opium in the world, it is estimated that 93% of the world opium
poppy cultivation is found in Afghanistan. Approximately 80% of the Afghanistan
opium is smuggled through the countries of Iran and Pakistan to Central Asia.
2Journal of Data on the Prevention and Eradication of Drug Abuse and Illicit Trafficking (P4GN)
Year 2013 Edition 2014
Every year an amount of 900 tons opium and 375 tons heroin, equivalent to US$
65 billion leave Afghanistan to supply + 15 million drug abusers, causing the death of
100,000 people every year. The circulation of opium goes through the Balkan and
Eurasia, including through China, India and Russia.
2. Drug Abuse and Illicit Trafficking at Regional Level.
Data on drug abuse in the ASEAN Region could not be monitored in detail, but in
general it depicts a rising trend in the abuse of ATS, enabling in the increase of illicit
trafficking as the market demand rises.
There is a significant progress related to drug trafficking in the ASEAN Region,
which is marked by the uncovering of a number of drug cases in the respective
countries:
a. The arrest of an Iranian nationals in Indonesia, Thailand and the Philippines, in
the smuggle of a large quantity of Methamphetamines, or known as Shabu
b. The disclosure of a new method of cannabis cultivation in Japan (indoor system)
by using a large number of pots.
c. Disclosure of a group of Vietnamese criminals applying the cloning method in
producing the same quality of cannabis plants, which was learned from
Vietnamese criminals in Australia.
d. Nigerian drug syndicates making use of couriers, mostly local women, remain a
serious problem, although many of these syndicates have been uncovered.
However, these syndicates frequently change their modus operandi. The worst,
their actions may result in criminal acts conducted by local law enforcement
apparatus, such as corruption for example.
e. As the source of Ketamine production, India sends large quantities of Ketamine
to countries in America and Europe, including to ASEAN countries.
f. The smuggle of large quantities of cold tablets from South Korea to Thailand. 6
Kg of Pseudo-ephedrine can be extracted from 100,000 tablets, changing the
function of this chemical substance to become an ingredient in the manufacture
of shabu.
g. In 2011 law enforcement agencies in Myanmar have seized 5.9 million
methamphetamine tablets, this is an increase of 168% from 2.2 million tablets
seized in the previous year.
h. 2011 UNODC Asia and the Pacific Regional ATS Report, reports that in 2010
approx. 136 million methamphetamine tablets were seized in the regions of East
Asia and South-East Asia. 98% of the total seized tablets were in three countries:
China (58.4 million), Thailand (50.4 million), and Laos (24.5 million). A seizure
was also made on 6.9 tons crystal methamphetamine in the same regions, and
61% of the total quantity seized was found in China (4.2 tons). Moreover, also in
the same regions 1.7 million ecstasy tablets were seized. The largest seizures
were made in China and Indonesia (94%).
3Journal of Data on the Prevention and Eradication of Drug Abuse and Illicit Trafficking (P4GN)
Year 2013 Edition 2014
i. UNODC Asia and the Pacific Report, Global SMART Update 2012, reported that
one-third of the global ATS and half of the global Methamphetamine seized
originate from East Asia and South-East Asia regions. Large quantities of illicit
ATS are produced in countries that were formerly transit countries for ATS. For
example, Cambodia, Indonesia and Malaysia. Meanwhile, South Asia remains
the target of organized syndicates for the source of ATS, in particular ephedrine
and pseudoephedrine.
j. The high market price of narcotics, and the increasing demand make the ASEAN
region a target for the smuggle of narcotic chemicals and precursors of different
types and packings.
3. Drug Abuse and Illicit Trafficiking at National Level.
Results of The National Survey on the Development of Drug Abuse in Indonsia,
conducted by BNN in coordination with University of Indonesia Health Research
Center reveal that the prevalence of drug abuse has reached 2.23%, or approx.. 4.2
million of the total population (between the age 10 – 59). In 2015 the number of drug
abusers is projected at + 2.8%, or an equivalent of + 5.1 – 5.6 million of the total
population.
The outcomes of a National Survey on Drug Abuse and Illicit Trafficking among
Workers of Transportation Modes (Land, Sea and Air) in Indonesia conducted in 2013
by BNN in cooperation with Health Research Center, University of Indonesia, reveal
that the prevalence of drug abuse in the past year (current user) indicates also a
relative high rate (6.9%), while the highest prevelance was found among workers in
the River, Lake and Water Crossings (9.7%) with the highest prevalence rate among
operators of land transportation (7.6%).
Meanwhile, the highest prevalence rates of the most abused drugs by
transportation workers in the past year are Cannabis (4.9%), ATS (2.3%), Opiates,
Tranquilizers, Hallucinogens and Inhalants below 1%.
Among ATS abusers the most frequently drugs used are Exstasy and Shabu,
indicating respectively a prevalence of 1.4% for Ecstasy and Shabu 1.4%. Katinon is
also reported with a prevalence of 0.3%. Among the opiates, heroin abuse indicates a
prevalence of 0.5%, morphine 0.4%, and opium 0.2%. Among the group of
tranquilizers, Luminal (0.4%) and koplo/BK tablet (0,5%). Phenobarbital (barbiturates)
with a prevalence of 0.1% is also detected among transportation workers in the past
year. In the group of hallucinogens, the most frequently used are mushroom (0.3%),
kecubung (purple trumpet shaped flowers) 0.3%. LSD is still in circulation (0.1%).
Among ”over the counter” drugs the most abused is dextromethorphan (0.7%).
ATS abuse (Ecstasy) is found among workers of all transportation modes, with
the exception of railway transportation, with the highest prevalence of 4.1% among
workers of ASDP (River, Lake and Water Crossings), Land Transportation (1.6%), and
Sea Transportation (1.0%). Shabu is also much abused in the past year among ASDP
workers (3.6%), land transportation (1.7%), and sea transportation (1.1%). Among
workers of air transportation ATS abuse is relatively less compared to other modes of
transportation, indicating respectively 0.7% for Ecstasy and Shabu 0.1%.
4Journal of Data on the Prevention and Eradication of Drug Abuse and Illicit Trafficking (P4GN)
Year 2013 Edition 2014
Based on data of BNN Deputy of Rehabilitation a total of 6,111 drug abusers all
over Indonesia had received treatment and rehabilitation in 2013. The majority
belongs to the age group of 25-40 years (3,916). Based on data from T&R services the
most drugs abused are heroin (1,243), shabu (1,649), cannabis (1,243), ecstasy ((282)
and opiates (195).
Based on classification of drug cases, the year 2013 indicates a decreasing trend
for Psychotropic Substances, with a percentage of 6.77% from 1,729 cases in 2012 to
1,612 in 2013. The largest increase of cases is seen in the abuse of Other Addictive
Substances, with a percentage of 60.48% from 7,917 cases in 2012 to 12,705 cases in
2013. The largest number of cases with a total of 21,267 is seen in the abuse of
Narcotics.
According to classification of suspects, Narcotics cases rank the highest, totalling
28,784 suspects. There is an increase of 13.73% compared to 2012. The number of
suspects in the group of Psychotropic Substances decreased by 9.41% from 2,062
arrewsted in 2012 to 1,868 in 2013. Suspects in the group of Other Addictive
Substances increased by 61.52% from 8,269 suspects in 2012 to 13,355 in 2013.
Furthermore, related to seized evidence, 2013 showed an increase of 56,66% for
the seizure of cannabis trees, from 341,395 in 2012 to 534,829 in 2013. A significant
decrease is reported in the seizures of cannabis seeds with a percentage of 95.79%,
from 284.91 grams in 2012 to 12 grams in 2013.
5Journal of Data on the Prevention and Eradication of Drug Abuse and Illicit Trafficking (P4GN)
Year 2013 Edition 2014
CHAPTER II
DATA ON THE PREVENTION AND ERADICATION
OF DRUG ABUSE AND ILLICIT TRAFFICKING, 2013
1. Supply Reduction.
a. Cases, Suspects and Evidence seized of Drug Crimes from National Police,
Republic of Indonesia
Table 1. Number of Drug Cases Based on Classification of Drugs, 2013
NO. CLASSIFICATION OF DRUGS TOTAL CASES 2013
1 2 3
1. Narcotics 21,119
2. Psychotropic Substances 1,612
3. Other Addictive Substances 12,705
TOTAL 35,436
Source : National Police, Reppublic of Indonesia, March 2014
Table 2. Total Number of Drug Suspects Based on Classification of Drugs,
2013
NO. CLASSIFICATION OF DRUGS TOTAL SUSPECTS 2013
1 2 3
1. Narcotics 28,543
2. Psychotropic Substances 1,868
3. Other Addictive Substances 13,356
TOTAL 43,767
Source : National Police, Republic of Indonesia, March 2014
Table 3. Total Number of Drug Suspects Based on Nationality, 2013
NO. NATIONALITY TOTAL SUSPECTS 2013
1 2 3
1. Domestic 43,640
2. Foreign 127
TOTAL 43,767
Source : National Police, Republic of Indonesia, March 2014
6Journal of Data on the Prevention and Eradication of Drug Abuse and Illicit Trafficking (P4GN)
Year 2013 Edition 2014
Table 4. Total Number of Drug Suspects Based on Gender, 2013
NO. GENDER TOTAL SUSPECTS 2013
1 2 3
1. Male 39,511
2. Female 4,256
TOTAL 43,767
Source : National Police, Republic of Indonesia, March 2014
Table 5. Number of Drug Suspects Based on Age Group, 2013
NO. AGE GROUP TOTAL SUSPECTS 2013
1 2 3
1. <16 years 122
2. 16-19 years 2,377
3. 20-24 years 6,246
4. 25-29 years 16,167
5. > 30 years 18,855
TOTAL 43,767
Source : National Police, Republic of Indonesia, March 2014
Table 6. Number of Drug Suspects Based on Educational Background, 2013
NO. EDUDCATION TOTAL SUSPECTS 2013
1 2 3
1. Elementary 7,540
2. Junior High School 12,169
3. Senior High School 22,952
4. University 1,106
TOTAL 43,767
Source : National Police, Republic of Indonesia, March 2014
Table 7. Number of Drug Suspects Based on Occupation, 2013
NO. OCCUPATION TOTAL SUSPECTS 2013
1 2 3
1. Civil Servant 410
2. Police/Armed Forces 256
3. Private Sector 19,731
4. Entrepreneur 9,010
5. Farmer 2,107
6. Labor 4,944
7. University student 857
8. Student 1,121
9. Unemployed 5,331
TOTAL 43,767
Source : National Police, Republic of Indonesia , March 2014
7Journal of Data on the Prevention and Eradication of Drug Abuse and Illicit Trafficking (P4GN)
Year 2013 Edition 2014
Table 8. Quantity of Seized Cannabis, 2013
NO. EVIDENCE TOTAL 2013
1 2 3
1. Cannabis Leaves (Gram) 17,763,959.76
2. Cannabis Trees 534,829
3. Cultivation Area (Ha) 119.9
4. Cannabis Seeds 12
5. Cannabis Seeds (Gram) 12
Source : National Police, Republic of Indonesia, March 2014
Table 9. Quantity of Seized Narcotics, 2013
NO. EVIDENCE TOTAL 2013
1 2 3
1. Heroin (Gram) 11,054.04
2. Cocaine (Gram) 2,035
3. Hashish (Gram) 2,067.68
4. Ecstasy (Tablet) 1,137,940
5. Ecstasy (Gram) 2,113.17
6. Shabu (Gram) 398,602.55
Source : National Police, Republic of Indonesia, March 2014
Table 10. Quantity of Seized Psychotropic Substances, 2013
NO. EVIDENCE TOTAL 2013
1 2 3
1. Benzodiazepine (Tablet) 460,806.75
2. Barbiturates (Tablet) 181
3. Barbiturates(Gram) 7,275.5
4. Ketamine (Gram) 4,661.51
5. Controlled Medicines (Tablet) 5,869,329.5
6. Controlled Medicines (Bottle) 7
Source : National Police, Republic of Indonesia, March 2014
Table 11. Quantity of Seized Other Addictive Substances, 2013
NO. EVIDENCE TOTAL 2013
1 2 3
1. Alcohol (Bottle) 148,161
2. Alcohol (Litre) 3,022,520.10
Source : National Police, Republic of Indonesia, March 2014
8Journal of Data on the Prevention and Eradication of Drug Abuse and Illicit Trafficking (P4GN)
Year 2013 Edition 2014
b. Suspects and Seized Evidence of Narcotics and Precursor Cases, and Money
Laundering, from National Narcotics Board (BNN)
1) Total Disclosures of Cases Related to Narcotics and Psychotropic
Substances
Table 12. Cases of Narcotics and Precursors, 2013
NO. CASE TOTAL CASES 2013
1 2 3
1. Narcotics and Precursors 150
2. Money Laundering 15
TOTAL 165
Source : Deputyof Eradication, BNN, March 2014
Table 13. Narcotics and Precursors Cases Based on Type of Narcotics, 2013
NO. TYPE OF CASE TOTAL CASES 2013
1 2 3
1. Shabu 132
2. Cannabis 3
3. Ecstasy 10
4. Heroin 1
5. Precursors 3
6. Methilone 1
TOTAL 150
Source : Deputy of Eradication, BNN, March 2014
Table 14. Total Cases of Narcotics and Precursors Based on Classification of
Narcotics, 2013
NO. CLASSIFICATION TOTAL CASES 2013
1 2 3
1. Narcotics 148
2. Precursors 2
TOTAL 150
Source : Deputy of Eradication, BNN, March 2014
9Journal of Data on the Prevention and Eradication of Drug Abuse and Illicit Trafficking (P4GN)
Year 2013 Edition 2014
Table 15. Total Cases of Narcotics and Precursors Based on Type of Offence,
2013
NO. TYPE OF OFFENCE TOTAL CASES 2013
1 2 3
1. Consumption 13
2. Distribution 135
3. Production 2
4. Cultivation -
TOTAL 150
Source : Deputy of Eradication, BNN, March 2014
2) Total Number of Suspects of Narcotics, Psychotropic Substances and
Money Laundering, 2013
Table 16. Number of Suspects of Narcotics and Precursors Based on Type of
Narcotics, 2013
NO. TYPE OF NARCOTIC TOTAL SUSPECTS 2013
1 2 3
1. Shabu 217
2. Cannabis 3
3. Ecstasy 14
4. Heroin 2
5. Precursors 4
6. Methilone 1
TOTAL 245
Source : Deputy of Eradication, BNN, March 2014
Table 17. Total Suspects of Narcotics and Precursors Based on Classification,
2013
NO. CLASSIFICATION TOTAL SUSPECTS 2013
1 2 3
1. Narcotics and Precursors 245
2. Money Laundering 15
TOTAL 260
Source : Deputy of Eradication, BNN, March 2014
10Journal of Data on the Prevention and Eradication of Drug Abuse and Illicit Trafficking (P4GN)
Year 2013 Edition 2014
Table 18. Total Suspects of Narcotics and Precursors Based on Type of
Offence, 2013
NO. TYPE OF OFFENCE TOTAL SUSPECTS 2013
1 2 3
1. Consumption 18
2. Distribution 223
3. Production 4
4. Cultivation -
TOTAL 245
Source : Deputy of Eradication, BNN, March 2014
Table 19. Total Suspects of Narcotics and Precursors Based on Nationality,
2013
NO. NATIONALITY TOTAL SUSPECTS 2013
1 2 3
1. Domestic 223
2. Foreign 22
TOTAL 245
Source : Deputy of Eradication, BNN, March 2014
Table 20. Total Suspects of Narcotics and Precursors Based on Gender, 2013
NO. GENDER DOMESTIC
SUSPECTS 2013
FOREIGN
SUSPECTS 2013
1 2 3
1. Male 187 17
2. Female 36 5
TOTAL 245
Source : Deputy of Eradication, BNN, March 2014
Table 21. Total Suspects of Narcotics and Precursors Based on Age Group,
2013
NO. AGE GROUP TOTAL SUSPECTS 2013
1 2 3
1. < 16 years -
2. 16-19 yrs 5
3. 20-24 yrs 23
4. 25-29 yrs 49
5. > 30 yrs 168
TOTAL 245
Source : Deputy of Eradication, BNN, March 2014
11Journal of Data on the Prevention and Eradication of Drug Abuse and Illicit Trafficking (P4GN)
Year 2013 Edition 2014
Table 22. Total Suspects of Narcotics and Precursors Based on Educational
Background, 2013
NO. EDUCATION TOTAL SUSPECTS 2013
1 2 3
1. Elementary 33
2. Junior High School 47
3. Senior High School 134
4. University 31
TOTAL 245
Source : Deputy of Eradication, BNN, March 2014
Table 23. Total Suspects of Narcotics and Precursors Based on Occupation,
2013
NO. OCCUPATION TOTAL SUSPECTS 2013
1 2 3
1. Swasta Private Sector 73
2. Unemployed 44
3. Labors 10
4. Farmers 1
5. Entrepreneurs 95
6. University students 13
7. Civil Servants 3
8. Police/Armed Forces 6
TOTAL 245
Source : Deputy of Eradication, BNN, March 2014
Table 24. Total Foreign Suspects Involved in Drug and Precursor Crimes, 2013
NO. NATIONALITY TOTAL SUSPECTS 2013
1 2 3
1. Nigeria 5
2. India 3
3. China 2
4. Germany 2
5. Pakistan 1
6. South Afrika 1
7. Thailand 1
8. Austria 1
9. Malaysia 1
10. Mali 1
11. Vietnam 1
12. Taiwan 1
13. England 1
14. Ivory Coast 1
TOTAL 22
Source : Deputy of Eradication, BNN, March 2014
12Journal of Data on the Prevention and Eradication of Drug Abuse and Illicit Trafficking (P4GN)
Year 2013 Edition 2014
Table 25. Total Suspects in Money Laundering Based on Nationality, 2013
NO. SUSPECTS TOTAL SUSPECTS 2013
1 2 3
1. Domestic 15
2. Foreign 0
TOTAL 15
Source : Deputy of Eradication, BNN, March 2014
Table 26. Total Suspects in Money Laundering Based on Gender, 2013
NO. GENDER DOMESTIC 2013 FOREIGN 2013
1 2 3
1. Male 10 0
2. Female 5 0
TOTAL 15
Source : Deputy of Eradication, BNN, March 2014
Table 27. Total Suspects in Money Laundering Based on Age Group, 2013
NO. AGE GROUP
TOTAL SUSPECTS
2013
1 2 3
1. < 16 years -
2. 16-19 years -
3. 20-24 years 1
4. 25-29 years 1
5. > 30 years 13
TOTAL 15
Source : Deputy of Eradication, BNN, March 2014
Table 28. Total Suspects in Money Laundering Based on Educational
Background, 2013
NO. EDUCATION
TOTAL SUSPECTS
2013
1 2 3
1. Elementary -
2. Junior High School 2
3. Senior High School 12
4. University 1
TOTAL 15
Source : Deputy of Eradication, BNN, March 2014
13Journal of Data on the Prevention and Eradication of Drug Abuse and Illicit Trafficking (P4GN)
Year 2013 Edition 2014
Table 29. Total Suspects in Money Laundering Based on Occupation, 2013
NO. OCCUPATION
TOTAL SUSPECTS
2013
1 2 3
1. Private Sector 3
2. Unemployed 5
3. Labor 1
4. Farmer -
5. Entrepreneur 6
6. University Student -
7. Civil Servant -
8. Police/Armed Forces -
TOTAL 15
Source : Deputy of Eradication, BNN, March 2014
3) Total Quantity of Seized Evidence of Cases Related to Narcotics,
Psychotropic Substances, and Money Laundering, 2013
Table 30. Total Seized Narcotic Evidence, 2013
NO. EVIDENCE TOTAL 2013
1 2 3
1. Crystalline Shabu 144,049.77 gram
2. Ecstasy 27,238 tablets
3. Liquid Shabu 13,620 ml
4. Shabu 85 tablets
5. Ecstasy (powder) 150.50 gram
6. Heroin 215.90 gram
7. Cannabis 13,182.00 gram
8. Methilon 7.4 gram
9. Methcatinone 30.5 gram
10. MDMA Powder 5.25 gram
11. Happy Five 588 tablets
12. Liquid Toluene 41,140 ml
13. Liquid HCL 1,030 ml
14. Liquid H2SO4 10.410 ml
15. Liquid Acetone 500 ml
16. LiquidEphedrine 20 ml
17. Ephedrine Tablets 938 tablet = 146.38 gram
18. Safrole 257,000 ml
19. Non-narcotic Tablets 172.40 gram
Source : Deputy of Eradication, BNN, March 2014
14Journal of Data on the Prevention and Eradication of Drug Abuse and Illicit Trafficking (P4GN)
Year 2013 Edition 2014
Table 31. Total Seized Evidence in Money Laundering, 2013
NO. EVIDENCE TOTAL PROCESS TOTAL
1 2 3 4 5
1. Vehicles 20 Units 2units 22 Units
2. Motor cycle 4 Units - 4 Units
3. House&
Apartement
12 Units - 12 Units
4. Land 47 SHM - 47 SHM
5. Jewelry 45 Pieces - 45 Pieces
6. Cash Money Rp. 5,252,864,204 Rp. 81,835,000 Rp. 5,334,699,204
7. Bank Account Rp.25,176,571,918 Rp. 732,650,000 Rp.25,909,221,918
8. Goods Rp.17,892,500,000 Rp. 330,000,000 Rp.18,222,500,000
Source : Deputy of Eradication, BNN, March 2014
Table 32. Details of Seized Evidence in Money Laundering, 2013
NO. LKN SUSPECTS
EVIDENCE
RE-
MARKS
MONEY/BANK
ACCOUNT (Rp.)
GOODS
1 2 3 4 5
1. LKN/08-WTB/II/
2013/BNN
Moch. Azwar
als Siwa
124.500.000 1 House
1 Piece lf Land &
Building
2nd
stage
2. LKN/23-WTB/II/
2013/BNN
Faisal 16.061.112.818 3 UnitsVehicles
19 UnitsLand &
Buildings
5 PiecesGold
Jewelry
1 Unit Gas Station
Stage II
3. LKN/30-WTB/III/
2013/BNN
Andi Juanda 1.071.508.394 2 Pieces Land
1 Unit Vehicle
10 Pieces Jewelry
Stage II
4. LKN/54-WTB/IV/
2013/BNN
Sodikin
Lilik Hamidah
- 15 UnitsLand &
Buildings
13 UnitsVehicles
2 Units Motor
cycles
Stage II
5. LKN/57-WTB/IV/
2013/BNN
Midy 3.884.084.886 1 Unit Laptop
1 Unit CPU
2 Units Houses
2 UnitsVehicles
9 Pieces Jewelry
Stage II
6. LKN/82-WTB/VI/
2013/BNN
Agung
Adhyaksa
125.000.000 2 UnitsLand &
Buildings
Stage II
7. LKN/85-WTB/VI/
2013/BNN
Yudi Hasmir
Siregar
4.650.450.000 1 Unit Vehicle
2 Units Cutting
Machines
Stage II
8. LKN/86-WTB/VI/
2013/BNN
Komariah als
Ruwi als Vivian
Unayah
228.500
Incl. foreign
money not yet
converted
1 Unit Laptop
9 UnitsSewing
Machines
Stage II
9. LKN/89-WTB/VI/
2013/BNN
Tias Tilawati als
Natalia Trisna
als Lila
Edi Purwono
als Paul
42.000
Incl. foreign
money not yet
converted
1 Unit Laptop Stage II
15Journal of Data on the Prevention and Eradication of Drug Abuse and Illicit Trafficking (P4GN)
Year 2013 Edition 2014
1 2 3 4 5
10. LKN/92-WTB/
VII/2013/BNN
Jeky als Alimim
als Limeng als
Jet li
2 UnitsHouse &
Building
1 Unit Motorcycle
Stage II
11. LKN/105-WTB/
VI/2013/BNN
Irwindy als
Erwin Bin
Baserani
3.561.761.000 1 Unit Laptop
22 Pieces Jewelry
2 UnitsVehicles
1 Unit Motorcycle
12 UnitsLand &
Buildings
Stage II
12. LKN/108-WTB/
VII/2013/BNN
Martunis als
Tunis
814.485.000 330.000.000 Investi-
gation
process
13. LKN/89-WTB/
VI/2013/BNN
Mulyono, Dkk 950.728.524 Stage II
14. LKN/87-WTB/X/
2013/BNN
Haryono
Nitirahardjo als
Supardjo
Sastro als Herry
Martin als Om
Jukerto
Investi-
gation
process
15. LKN/153-WTB/
XII/2013/BNN
Tjeuw Anton Investi-
gation
process
Source : Deputy of Eradication, BNN, March 2014
4) Disclosure of Outstanding Cases Data by BNN, 2013
Table 33. Total Outstanding Drug Cases, 2013
NO. UNIT CASE SUSPECT EVIDENCE
RE-
MARKS
1 2 3 4 5 6
1. BNN 1 1 7 bottles (10 ltr) liquid
precursor
Cannabis 3 gr
10 jerrycans(250 ltr)
2. BNN 1 6 Shabu 6.527,8 gr
Ecstasy 47 tabs weight
15,9 gr,
Ecstasy powder, 169,5 gr
Shabu 0,8 gr
Shabu 2 gr
Ecstasy 14 tabs
3. BNN 1 2 House: 1 unit
6 units sewing/hemming
machines
1 unit Honda Jazz vehicle
Several ATM cards and
bank account books
4. BNN 1 2 Shabu 5.018 gr
5. BNN 1 1 Shabu 2.002 gr
6. Riau 1 7 Shabu 3,8 kg
7. BNN 1 1 Shabu 2.558 gr
8. BNN 1 1 Shabu 5.716 gr
9. East Kalimantan 1 3 Shabu 4.069,3 gr
10. West
Kalimantan
1 2 Shabu 5.109,1 gr
Ecstasy 9.107 tabs
16Journal of Data on the Prevention and Eradication of Drug Abuse and Illicit Trafficking (P4GN)
Year 2013 Edition 2014
1 2 3 4 5 6
11. East Java 1 2 Shabu 1.562,7 gr
12. North Sumatera 1 3 Shabu 2,1 kg
Shabu seberat 1 kg
Ekstasi 11.400 butir
TOTAL 12 31
Source : Deputy of Eradication, BNN, March 2014
5) Illicit Drug Trafficking Routes from overseas into Indonesia, 2013.
a) Land Routes.
(1) Malaysia – Entikong – Sanggau (West Kalimantan).
(2) Malaysia – Entikong – Pontianak.
(3) Papua New Guinea – Jayapura.
b) Air Routes.
(1) South Africa –Manado.
(2) South Africa – Singapore– Lombok.
(3) Netherland– Jakarta.
(4) Netherland– Malaysia – Aceh.
(5) Bangladesh –Jakarta.
(6) China –Jakarta.
(7) China – Malaysia – Jakarta.
(8) China – Malaysia – Aceh.
(9) Doha – Denpasar.
(10) Doha – Jakarta.
(11) Dubai – Jakarta.
(12) India – Jakarta.
(13) India – Timor Leste.
(14) India – Singapore – Manado.
(15) India – Singapore – Medan.
(16) Iran – Malaysia – Aceh.
(17) New Delhi – Bangkok – Denpasar.
(18) New Delhi – Kuala Lumpur – Denpasar.
(19) Kuala Lumpur – Makassar.
(20) Mali, Central Africa – Medan.
(21) Malaysia – Aceh.
(22) Malaysia – Aceh – Medan.
(23) Malaysia – Medan.
(24) Malaysia – Padang.
(25) Malaysia – Batam.
(26) Malaysia – Pekanbaru.
(27) Malaysia – Jakarta.
(28) Malaysia – Semarang.
(29) Malaysia – Surabaya.
(30) Malaysia – Madura.
(31) Malaysia – Bali.
17Journal of Data on the Prevention and Eradication of Drug Abuse and Illicit Trafficking (P4GN)
Year 2013 Edition 2014
(32) Malaysia – Tarakan (East Kalimantan).
(33) Malaysia – Jakarta – Surabaya.
(34) Malaysia – Pontianak.
(35) Pakistan – Jakarta.
(36) Singapore – Lombok.
(37) Siberia – Jakarta – Banjarmasin.
(38) Timor Leste – Indonesia.
(39) Thailand – Jakarta.
(40) Thailand – Denpasar.
(41) Bangkok – Makassar.
c) Sea Routes.
(1) Portklang – Dumai.
(2) Iran – Taiwan – Tanjung Priok.
(3) Johor Baru – Tanjung Balai Karimun.
(4) Malacca – Dumai.
(5) Pasirgudang Malaysia – Batam.
(6) Stulang Laut Malaysia – Batam.
(7) Singapore – Batam.
(8) Malacca – Bengkalis.
(9) Malacca – Dumai.
(10) Portklang – Dumai.
(11) Malaysia – Batam.
(12) Malaysia – Tanjung Pinang (Kepri) – Jakarta.
(13) Malaysia – Dumai – Jakarta.
(14) Malaysia – Balikpapan.
(15) Malaysia – Jakarta.
(16) Malaysia – Pekanbaru.
(17) Malaysia – Batam – Pekanbaru – Pangkal Pinang.
(18) Malaysia – Batam – Pelabuhan Tanjung Priok (Jakarta).
(19) Malaysia – Medan – Merak – Jakarta.
d) Domestic Routes.
(1) Aceh – Bakauheni Seaport (Lampung) - Jakarta.
(2) Aceh – Jambi – Surabaya.
(3) Aceh – Medan – Bukittinggi.
(4) Aceh – Pekanbaru.
(5) Aceh – Palembang.
(6) Aceh – Medan.
(7) Aceh – Cianjur.
(8) Aceh – Jakarta.
(9) Aceh – Jakarta – Cirebon - Jember.
(10) Medan – Jakarta – Kupang – Atambua – Dili.
(11) Medan – Nusa Tenggara Barat.
(12) Batam – Surabaya.
(13) Batam – Tanjung Priok.
(14) Palembang – Jakarta.
18Journal of Data on the Prevention and Eradication of Drug Abuse and Illicit Trafficking (P4GN)
Year 2013 Edition 2014
(15) Jakarta – Makassar.
(16) Jakarta – Balikpapan (Kalimantan Barat).
(17) Jakarta – Bogor – Sukabumi.
(18) Jakarta – Pekalongan (Jawa Tengah).
(19) Jakarta – Surabaya.
(20) Malang (East Java ) – Bali.
(21) Tangerang – Bekasi.
(22) Bandung – Cianjur.
(23) Surabaya – Bali.
(24) Surabaya – Batam.
(25) Pontianak – Ketapang.
(26) Ketapang – Pontianak.
c. Destroyed Narcotic Evidence Seized by National Narcotics Board.
Table 34. Narcotic Evidence in Powder Form 2013
NO. EVIDENCE
TOTAL QUANTITY DESTROYED
2013
REMARKS
1 2 3 4
1. Shabu 130,106.61 Gram
2. Heroin 199.40 Gram
3. Ecstasy 142.30 Gram
4. Cannabis 12,913.10 Gram
5. Precursors 28.00 Gram
6. Tablet Ephdedrine 144.92 Gram
TOTAL 143,534.33 Gram
Source : Deputy of Eradication, BNN, March 2014
Table 35. Total Destroyed Narcotics Evidence (Tablets), 2013
NO. EVIDENCE
TOTAL QUANTITY DESTROYED
2013
REMARKS
1 2 3 4
1. Ecstasy 26.546 Gram
2. Methamphetamine 75 Gram
3. Happy Five 578 Gram
TOTAL 27.199 Gram
Source : Deputy of Eradication, BNN, March 2014
19Journal of Data on the Prevention and Eradication of Drug Abuse and Illicit Trafficking (P4GN)
Year 2013 Edition 2014
Table 36. Quantity of Liquid Narcotic Evidence, 2013
NO. EVIDENCE
TOTAL EVIDENCE DESTROYED
2013
REMARKS
1 2 3 4
1. Liquid Precursor 322.885 Gram
TOTAL 322.885 Gram
Source : Deputy of Eradication, BNN, March 2014
d. Seizures and Ranking of Narcotic Evidence from Ministry of Finance RI 2013
Table 37. Total Seizures of Natural Narcotics Evidence at Airports, 2013
NO. EVIDENCE 2013
1 2 3
1. Cannabis (Gram) 7,59
2. Heroin (Gram) 372
3. Cocaine (Gram) 0
4. Hashish (Gram) 103,64
Source : Directorate General of Customs & Excise, Ministry of Finance RI, March 2014
Table 38. Total and Ranking of Seized Cannabis Leaves at Airports, 2013
NO. PROVINCE AIRPORT 2013 REMARKSTOTAL RANKING
1 2 3 4 5 6
1. Bali Ngurah Rai 7,59 1 Gram
TOTAL 7,59 Gram
Source : Directorate General of Customs & Excise, Ministry of Finance RI, March 2014
Table 39. Total and Ranking of Seized Heroin Evidence at Airports, 2013
NO. PROVINCE AIRPORT
2013
REMARKS
TOTAL RANKING
1 2 3 4 5 6
1. Bali Ngurah Rai 372 1 Gram
JUMLAH Gram
Source : Directorate General of Customs & Excise, Ministry of Finance RI,March2014
Table 40. Total and Ranking of Seized Hashish at Airports, 2013
NO. PROVINCE AIRPORT
2013
REMARKS
TOTAL RANKING
1 2 3 4 5 6
1. Bali Ngurah Rai 103.64 1 Gram
TOTAL Gram
Source : Directorate General of Customs & Excise, Ministry of Finance RI, March 2014
20Journal of Data on the Prevention and Eradication of Drug Abuse and Illicit Trafficking (P4GN)
Year 2013 Edition 2014
Table 41. Total Synthetic Narcotics Seized at Airports, 2013
NO. EVIDENCE 2013
1 2 3
1. Ecstasy (Gram) 207.221,63
2. Shabu (Gram) 78.488,2
3. Methadone (ML) 40
4. Ketamine (Gram) 4.152,3
5. Xanax (Tabs) 8
Source : Directorate General of Customs & Excise, Ministry of Finance RI , March 2014
Table 42. Total and Ranking of Seized Ecstasy at Airports, 2013
NO. PROVINCE AIRPORT
2013
REMARKS
TOTAL RANKING
1 2 3 4 5 6
1. Banten Soekarno Hatta 207,220 1 Gram
2. North Sumatera Polonia Medan 1.63 2 Gram
TOTAL 207,221.63 Gram
Source : Directorate General of Customs & Excise, Ministry of Finance RI, March 2014
Table 43. Total and Ranking of Seized Shabu at Airports, 2013
NO. PROVINCE AIRPORT
2013
REMARKS
TOTAL RANKING
1 2 3 4 5 6
1. Banten Soekarno Hatta 31,914 1 Gram
2. Jawa Timur Juanda 15,276.20 2 Gram
3. Batam Hang Nadim 8,619 3 Gram
4. Bali Ngurah Rai 6,827 4 Gram
5. West Java Husein Sastranegara 3,875 5 Gram
6. North Sulawesi Samratulangi 3,667 6 Gram
7. Yogya Adi Sucipto 2,800 7 Gram
8. West Sumatra Minang Kabau 2,800 8 Gram
9. East Kalimantan Sepinggan Balikpapan 1,534 9 Gram
10. North Sumatra Polonia Medan 916 10 Gram
11. West Kalimantan Supadio Pontianak 260 11 Gram
TOTAL 78,488 Gram
Source : Directorate General of customs & Excise, Ministry of Finance RI, March 2014
21Journal of Data on the Prevention and Eradication of Drug Abuse and Illicit Trafficking (P4GN)
Year 2013 Edition 2014
Table 44. Total Seized Heroin Evidence at Seaports, 2013
NO. PROVINCE SEAPORT 2013 REMARK
STOTAL RANKING
1 2 3 4 5 6
1. Riau Islands Batam Center 623 1 Gram
2. Riau Balai Karimun 11.92 2 Gram
TOTAL 635 Gram
Source : Directorate General of Customs & Excise, Ministry of Finance RI, March 2014
Table 45. Total Ecstasy Seized at Seaports, 2013
NO. PROVINCE SEAPORT
2013 REMARK
STOTAL RANKING
1 2 3 4 5 6
1. Riau Islands Batam Center 9.921 1 Butir
TOTAL 9.921 Butir
Source : Directorate General of Customs & Excise, Ministry of Finance RI, March 2013
Table 46. Total Shabu Evidence Seized at Airports, 2013
NO. PROVINCE SEAPORT
2013 REMAR
REMAR
KSTOTAL RANKING
1 2 3 4 5 6
1. North
Sumatera
1. Teluk Nibung 724,60 3 Gram
2. Riau
1. Dumai 2.437,99 2 Gram
2. Setia Raja 450 4 Gram
3. Balai Karimun 1,12 5 Gram
3. Riau Isl, 1. Batam Centre 4.402 1 Gram
TOTAL 8.015,71 Gram
Source : Directorate General of Customs & Excise, Ministry of Finance RI, March 2013
Table 47. Total Cannabis Evidence Seized at Border Crossing, 2013
NO. PROVINCE BORDER CROSSING
2013 REMARK
STOTAL RANKING
1 2 3 4 5 6
1.
West Papua
PPLB Skow Wutung
1.520
500 seeds
1
2. Riau Tanjung Balai Karimun 1,1 2
TOTAL
1.521,1
500 seeds
Source : Directorate General of Customs & Excise, Ministry of Finance RI, March 2014
22Journal of Data on the Prevention and Eradication of Drug Abuse and Illicit Trafficking (P4GN)
Year 2013 Edition 2014
Table 48. Total Shabu Evidence Seized at Border Crossings, 2013
NO. PROVINCE BORDER CROSSING
2013
REMARKS
TOTAL RANKING
1 2 3 4 5 6
1. Riau Isl Batam Center 1,12 2 Gram
2. Riau Tanjung Balai Karimun 4.402 1 Gram
TOTAL 4.403,12 Gram
Source : Directorate General of Customs & Excise, Ministry of Finance RI, March 2014
Table 49. Total Narcotics Suspects Based on Nationality, 2013
NO. NATIONALITY TOTAL SUSPECTS 2013
1 2 3
1. Indonesia 133
2. Malasyia 32
3. Papua New Guinea 3
4. China 29
5. Nigeria 2
6. France 2
7. Philippines 3
8. Ukraina 1
9. Thailand 3
10. Iran 1
11. Chile 1
12. South Africa 2
13. Singapore 2
14. Taiwan 1
15. Belgium 1
16. India 7
17. Vietnam 3
18. Germany 2
19. Bangladesh 1
20. Austria 1
21. USA 1
22. Sweden 1
TOTAL 232
Source : Directorate General of Customs & Excise, Ministry of Finance RI, March 2014
Table 50. Total Narcotics suspects Based on Gender, 2013
NO. GENDER TOTAL SUSPECTS2013
1 2 3
1. Male 170
2. Female 62
TOTAL 232
Source : Directorate General of Customs & Excise, Ministry of Finance RI, March 2014
23Journal of Data on the Prevention and Eradication of Drug Abuse and Illicit Trafficking (P4GN)
Year 2013 Edition 2014
e. Prisoners and Detainees of Drug Cases Throughout Indonesia in 2013, from
Ministry of Justice and Human Rights, Republic of Indonesia
Table 51. Total Number of Prisoners and Detainees of Narcotics Cases in Indonesia,
by Province, 2013
NO. REGIONAL OFFICE
TOTAL PRISONERS AND
DETAINEES 2013
1 2 3
1. Aceh 1,706
2. North Sumatera 64
3. West Sumatera 1,149
4. Riau Island 1,209
5. Riau 2,689
6. Jambi 906
7. South Sumatera 2,275
8. Bangka Belitung 483
9. Lampung 1,715
10. Bengkulu 438
11. Banten 3,502
12. DKI Jakarta 10,026
13. West Java 7,111
14. DI Yogyakarta 319
15. Central Java 3,237
16. East Java 4,055
17. West Kalimantan 811
18. Central Kalimantan 688
19. South Kalimantan 3,249
20. East Kalimantan 1,592
21. North Sulawesi 64
22. Gorontalo 56
23. Central Sulawesi 342
24. South Sulawesi 1,125
25. West Sulawesi 78
26. Southeast Sulawesi 213
27. Bali 459
28. West Nusa Tenggara 375
29. East Nusa Tenggara 25
30. Maluku 87
31. North Maluku 70
32. West Papua 28
33. Papua 37
TOTAL 55,671
Source : Directorate General of Correctional Facilities, Ministry of Justice & Human Rights, March 2014
Note : Source of the data from 411 Technical Services Unit (UPT) in Indonesia
24Journal of Data on the Prevention and Eradication of Drug Abuse and Illicit Trafficking (P4GN)
Year 2013 Edition 2014
Table 52. Total Number of Prisoners and Detainees of Drug Cases by Province, Based
on Classification of Dealers and Users, 2013
NO. REGIONAL OFFICE
DRUG CASES
TOTALDEALER/
TRAFFICKER
USER
1 2 3 4 5
1. Aceh 1,255 451 1,706
2. North Sumatera 3,250 2,302 5,552
3. West Sumatera 520 629 1,149
4. Riau Island 631 578 1,209
5. Riau 2,084 605 2,689
6. Jambi 635 271 906
7. South Sumatera 961 1,314 2,275
8. Bangka Belitung 396 87 483
9. Lampung 1,237 478 1,715
10. Bengkulu 324 114 438
11. Banten 1,475 2,027 3,502
12. DKI Jakarta 4,940 5,086 10,026
13. West Java 635 271 906
14. DI Yogyakarta 205 114 319
15. Central Java 2,281 956 3,237
16. East Java 853 3,202 4,055
17. West Kalimantan 251 560 811
18. Central Kalimantan 221 467 688
19. South Kalimantan 1,784 1,465 3,249
20. East Kalimantan 1,179 413 1,592
21. North Sulawesi 35 29 64
22. Gorontalo 0 56 56
23. Central Sulawesi 97 245 342
24. South Sulawesi 298 827 1,125
25. West Sulawesi 35 43 78
26. Southeast Sulawesi 100 113 213
27. Bali 211 248 459
28. West Nusa Tenggara 302 73 375
29. East Nusa Tenggara 1 24 25
30. Maluku 25 62 87
31. North Maluku 57 13 70
32. West Papua 15 22 37
33. Papua 1 24 25
TOTAL 30,132 25,539 55,671
Source : Directorate General of Correctional Facilities, Ministry of Justice & Human Rights, March 2014
25Journal of Data on the Prevention and Eradication of Drug Abuse and Illicit Trafficking (P4GN)
Year 2013 Edition 2014
Table 53. Number of Prisoners and Detainees in Narcotics Prisons Throughout
Indonesia, 2013
NO. TECHNICAL SERVICE UNIT
REGI-
ONAL
OFFICE
NUMBER OF
CAPACITY
%
CAPACITY
DETAI-
NEES
PRISO-
NERS
TOTAL
1 2 3 4 5 6 7 8
1. Lapas Kelas II A Narkotika
Bandar Lampung
Lampung 689 689 168 410
2. Lapas Kelas II A Narkotika
Bandung
West
Java
581 544 1,125 448 251
3. Lapas Kelas II A Narkotika
Cipinang
DKI
Jakarta
185 2,919 3,104 1,084 286
4. Lapas Kelas II A Narkotika
Cirebon
West
Java
785 785 455 173
5. Lapas Kelas II A Narkotika
Jayapura
Papua 21 124 145 308 47
6. Lapas Kelas II A Narkotika
Karang Intan
S. Kali-
mantan
730 730 300 243
7. Lapas Kelas II A Narkotika
Lubuk Linggau
S. Suma-
tera
68 275 343 198 173
8. Lapas Kelas II A Narkotika
Madiun
East Java 0 0 200 0
9. Lapas Kelas II A Narkotika
Nusakambangan
Central
Java
431 431 245 176
10. Lapas Kelas II A Narkotika
Pamekasan
East Java 0 0 1,250 0
11. Lapas Kelas II A Narkotika
Pematang Siantar
N. Suma-
tera
1 20 21 420 5
12. Lapas Kelas II A Narkotika
Sungguminasa
S.
Sulawesi
1 601 602 368 164
13. Lapas Kelas II A Narkotika
Tanjung Pinang
Riau
Island
22 22 200 11
14. Lapas Kelas II A Narkotika
Yogyakarta
DI Yogya-
karta
30 229 259 474 55
15. Lapas Kelas III Narkotika
Kasongan
C. Kali-
mantan
7 7 240 3
16. Lapas Kelas III Narkotika
Langkat
N. Suma-
tera
49 49 1,500 3
17. Lapas Kelas III Narkotika
Langsa
Aceh 1 131 132 800 17
18. Lapas Kelas III Narkotika
Muara Sabak
Jambi 64 64 160 40
19. Lapas Kelas III Narkotika
Pangkal Pinang
Babel 236 236 168 140
20. Lapas Kelas III Narkotika
Samarinda
E. Kali-
mantan
500 500 339 147
TOTAL 888 8,356 9,244 9,730
Source : Directorate General of Correctional Facilities, Ministry of Justice & Human Rights, March 2014
26Journal of Data on the Prevention and Eradication of Drug Abuse and Illicit Trafficking (P4GN)
Year 2013 Edition 2014
f. Detainees of Narcotic Cases throughout Indonesia in 2013, from BNN
Table 54. Total Number of Detainees of Narcotic Cases at National Narcotics Board,
Based on Nationality, 2013
NO. NATIONALITY TOTAL DETAINEES 2013
1 2 3
1. Indonesia 223
2. Malaysia 1
3. Nigeria 5
4. India 3
5. China 2
6. Taiwan 1
7. Vietnam 1
8. English 1
9. Mali 1
10. South Africa 1
11. Ivory Coast 1
12. German 2
13. Pakistan 1
14. Austria 1
15. Thailand 1
TOTAL 245
Source : Deputy of Eradication, BNN, March 2014
Table 55. Total Number of Detainees of Narcotic Cases at National Narcotics Board
Based on Gender, 2013
NO. GENDER TOTAL DETAINEES 2013
1 2 3
1. Male 199
2. Female 46
TOTAL 245
Source : Deputy of Eradication, BNN, March 2014
Table 56. Total Number of Detainees of Narcotic Cases Based on Age Group, 2013
NO. AGE GROUP TOTAL DETAINEES 2013
1 2 4
1. < 16 Years 0
2. 16 – 20 Years 8
3. 21 – 25 Years 31
4. 26 – 30 Years 51
5. 31 – 35 Years 56
6. 36 – 40 Years 40
7. 41 – 45 Years 30
8. 46 – 50 Years 20
9. > 50 Years 9
TOTAL 245
Source : Deputy of Eradication, BNN, March 2014
27Journal of Data on the Prevention and Eradication of Drug Abuse and Illicit Trafficking (P4GN)
Year 2013 Edition 2014
g. Number of Prosecutions and Death Verdicts for Foreign and Domestic
Nationals for Cases of Narcotic and Psychotropic Substances in 2013, by
General Attorney Office, Republic of Indonesia
Table 57. Total Number of Prosecutions for Narcotics and Psychotropic Sustances
Cases by Province, 2013
NO. PROVINCE
TOTAL PROSECUTIONS
TOTAL
NARCOTICS PSYCHOTROPICS
1 2 3 4 5
1. Aceh 380 1 381
2. Nort Sumatera 2,562 227 2,789
3. West Sumatera 302 11 313
4. Riau 436 2 438
5. Riau Island 187 6 193
6. Jambi 136 0 136
7. South Sumatera 877 1 878
8. Bengkulu 160 0 160
9. Lampung 360 0 360
10. Bangka Belitung 183 11 194
11. Banten 0 0 0
12. DKI Jakarta 2,599 99 2,698
13. West Java 1,138 35 1,173
14. Central Java 431 21 452
15. DI Yogyakarta 140 13 153
16. East Java 1,187 81 1,268
17. West Kalimantan 266 8 274
18. South Kalimantan 579 0 579
19. East Kalimantan 584 31 615
20. Central Kalimantan 143 0 143
21. Bali 58 0 58
22. West Nusa Tenggara 87 15 102
23. East Nusa Tenggara 19 0 19
24. South Sulawesi 159 15 174
25. West Sulawesi 0 0 0
26. Southeast Sulawesi 68 0 68
27. Central Sulawesi 18 0 18
28. North Sulawesi 47 1 48
29. Gorontalo 18 0 18
30. Maluku 19 1 20
31. North Maluku 33 0 33
32. Papua 20 0 20
33. West Papua 0 0 0
TOTAL 13,196 579 13,775
Source : General Attorney Office, Republic of Indonesia, March 2014
28Journal of Data on the Prevention and Eradication of Drug Abuse and Illicit Trafficking (P4GN)
Year 2013 Edition 2014
Table 58. Number of Death Verdicts for Foreign and Domestic Nationals for Cases
of Narcotic and Psychotropic Substances in 2013
NO. LEGAL ACTION TOTAL REMAKS
1 2 3 4
1. Judicial review and pardon denied 0
2. Not yet take a stand 25
3. Judicial review denied 6
4. Pardon granted, changed to life imprisonment 3
5. First pardon process 8
6. Second petition for pardon 2
7. Judicial review process 18
8. Judicial review granted 9
9. Convicted person passed away 5
10. Already executed 7
11. Decision on the cassation turned to life imprisonment 1
12. Still waiting for the verdict of the high court appeal 5
TOTAL 89
Source : General Attorney Office, Republic of Indonesia, March 2014
h. Results of Tested Evidence from Crimes on Narcotics, Psychotropic Substances
and other Addictive Substances in 2013, from the Office of Drugs and Food
Control
Table 59. Total Results of Laboratory-tested Narcotics Evidence by Province, 2013
NO.
REGIONAL OFFICE/
OFFICE
TO-
TAL
SAM-
PLE
TEST RESULTS
TO-
TAL
H
E
R
O
I
N
C
O
D
E
I
N
E
C
A
N
A
B
I
S
MET-
AM-
PE-
TA-
MINE
AM-
PHE
TA-
MI-
NE
SUL-
FATE
M
D
M
A
NEG
A-
TIVE
DRU
G
1 2 3 4 5 7 8 9 10 11 12
1. BBPOM Jakarta
2. BBPOM Banda Aceh 11 10 1 11
3. BBPOM Lampung 63 1 36 21 1 2 1 62
4. BBPOM Bandung 632 1 1 498 98 2 3 603
5. BBPOM Banjarmasin 413 1 365 22 23 411
6. BBPOM Denpasar 3 1 2 3
7. BBPOM Jayapura 74 56 16 1 73
8. BBPOM Makassar
9. BBPOM Manado
10. BBPOM Mataram 141 54 81 3 3 141
11. BBPOM Medan
12. BBPOM Padang
13. BBPOM Palembang
14. BBPOM Pekanbaru 286 66 201 14 4 285
29Journal of Data on the Prevention and Eradication of Drug Abuse and Illicit Trafficking (P4GN)
Year 2013 Edition 2014
1 2 3 4 5 7 8 9 10 11 12
15 BBPOM Pontianak 367 16 280 44 25 365
16 BBPOM Samarinda 15 10 10
17 BBPOM Semarang
18 BBPOM Surabaya
19 BBPOM Yogyakarta 5 1 1
20 BPOM Ambon 42 21 21 42
21 BPOM Bengkulu 200 100 95 1 4 200
22 BPOM Jambi 23 4 13 6 23
23 BPOM Gorontalo 14 4 10 14
24 BPOM Kendari
25 BPOM Kupang
26 BPOM Palangkaraya 19 8 6 3 17
27 BPOM Palu 92 2 67 1 1 71
T O T A L 2.400 3 1 879 1284 1 95 69 2.332
Source : National Food & Drugs Control Agency, March 2014
Table 60. Total Results of Laboratory-tested Psychotropic Substances Evidence
from Crimes by Province, 2013
NO.
REGIONAL OFFICE/
OFFICE
TEST RESULTS
TO-
TAL
ALPRA-
ZOLAM
DIAZE-
PAM
CLO-
NA-
ZEPAM
NIME-
TAZE-
PAM
NITRA-
ZEPAM
NEGA-
TIVE
1 2 3 4 5 6 7 8 9
1 BBPOM Jakarta
2 BBPOM Banda Aceh
3 BBPOM Lampung
4 BBPOM Bandung 17 1 5 23
5 BBPOM Banjarmasin
6 BBPOM Denpasar
7 BBPOM Jayapura
8 BBPOM Makassar
9 BBPOM Manado
10 BBPOM Mataram
11 BBPOM Medan
12 BBPOM Padang
13 BBPOM Palembang
14 BBPOM Pekanbaru
15 BBPOM Pontianak 1 1 2
16 BBPOM Samarinda
17 BBPOM Semarang
18 BBPOM Surabaya
19 BBPOM Yogyakarta 1 2 1 4
20 BPOM Ambon
21 BPOM Bengkulu
22 BPOM Jambi
23 BPOM Gorontalo
24 BPOM Kendari
25 BPOM Kupang
26 BPOM Palangkaraya 1 1
27 BPOM Palu
T O T A L 18 3 1 1 5 2 30
Source : National Food & Drugs Control Agency, March 2014
30Journal of Data on the Prevention and Eradication of Drug Abuse and Illicit Trafficking (P4GN)
Year 2013 Edition 2014
Table 61. Total Results of Laboratory-tested Evidence of Other Addictive
Substances from Crimes by Province, 2013
NO.
REGIONAL OFFICE/
OFFICE
TEST RESULTS
TTL
P
A
R
A
C
E
T
A
M
O
L
P
S
E
U
D
O
E
P
H
E
D
R
I
N
E
E
P
H
E
D
R
I
N
E
C
H
L
O
R
O
Q
U
I
N
C
A
F
F
E
I
N
E
T
R
I
H
E
X
Y
P
H
E
N
I
D
I
L
DEX-
TRO-
MET-
HOR-
FAN
HBR
C
A
R
I
S
O
P
R
O
D
O
L
T
R
A
M
A
D
O
L
K
E
T
A
M
I
N
E
1 2 3 4 5 6 7 8 9 10 11 12 13
1 BBPOM Jakarta
2 BBPOM Banda Aceh
3 BBPOM Bandar
Lampung
1 1
4 BBPOM Bandung 6 6
5 BBPOM Banjarmasin 1 1 2
6 BBPOM Denpasar
7 BBPOM Jayapura 1 1
8 BBPOM Makassar
9 BBPOM Manado
10 BBPOM Mataram
11 BBPOM Medan
12 BBPOM Padang
13 BBPOM Palembang
14 BBPOM Pekanbaru 1 1
15 BBPOM Pontianak
16 BBPOM Samarinda 5 5
17 BBPOM Semarang
18 BBPOM Surabaya
19 BBPOM Yogyakarta
20 BPOM Ambon
21 BPOM Bengkulu
22 BPOM Jambi
23 BPOM Gorontalo
24 BPOM Kendari
25 BPOM Kupang
26 BPOM Palangkaraya 1 1
27 BPOM Palu 20 1 21
T O T A L 2 1 2 25 7 1 38
Source : National Food & Drugs Control Agency, March 2014
31Journal of Data on the Prevention and Eradication of Drug Abuse and Illicit Trafficking (P4GN)
Year 2013 Edition 2014
i. Recommendations for Non Pharmaceutical Precursors issued in 2013, by BNN
Table 62. Recommendations for Non-Pharmaceutical Precursors, 2013
NO. COMPANY RECOMENDATION PRECURSOR IMPORT
1 2 3 4 5
1. PT. Halim Sakti
Pratama
lmportation Approval Letter Potassium
Permanganate
BP 2000
60 MT (3 FCL)
Changing of General
Importer Identification
Number
2. PT. EDF System
Integration
lmportation Approval Letter Methyl Ethyl Ketone 3.000 litre
3. PT. AKR Niaga
Indonesia
Appointment of Importers
Limited
lmportation Approval Letter Sulfuric Acid 99.500 MT
4. PT. Anugerah
Inti Artha
lmportation Approval Letter Potassium
Permanganate
120.000 kg
5. PT. Jatika Nusa Extension of Appointment
of Importers Limited
lmportation Approval Letter Potassium
Permanganate
140.000 kg
Piperonal 3.000 kg
Phenyl Acetic Acid 1.000 kg
Potassium
Permanganate
BP 2000
80.000 kg
6. PT. Mulya Adhi
Paramita
lmportation Approval Letter Acetone 6.300 MT &
4.000 litre
Methyl Ethyl Ketone 6.500 MT &
3.500 litre
Toluene 30.000 MT &
15.000 litre
Extension of Appointment
of Importers Limited
7. PT. Multiredjeki
Kita
lmportation Approval Letter Hydrochloric Acid 7.500 litre
Sulphuric Acid 5.500 litre
Ethyl Ether 1.200 litre
Toluene 2.816 litre
Ether 1.200 litre
Acetone 4.600 litre
8. PT. Sinarkimia
Utama
lmportation Approval Letter Hydrochloric Acid 1.000 gallon
Potassium
Permanganate
40 MT
9. PT. AIK MOH
Chemicals
Indonesia
lmportation Approval Letter Acetone 62 ton
Toluene 48 ton
Methyl Ethyl Ketone 46 ton
Hydrochloric Acid 52 ton
Sulphuric Acid 49 ton
Appointment of Importers
Limited
10. PT. PKG Lautan
Indonesia
lmportation Approval Letter Toluene 12.300 ton
Aceton 4.000 ton
Methyl Ethyl Ketone 4.000 ton
32Journal of Data on the Prevention and Eradication of Drug Abuse and Illicit Trafficking (P4GN)
Year 2013 Edition 2014
1 2 3 4 5
11. PT. Indonesian
Acids Industry
Pre-Export Notification Sulfuric Acid 38% - 39% 42,72 MT (2 FCL)
Export Approval Letter Sulfuric Acid 42,72 MT (2 FCL
20’)
Export Approval Letter Sulphuric Acid 98% 24 MT (1 FCL
20’)
Pre-Export Notification Sulphuric Acid 38%-39% 109,44 MT (5
FCL 20’)
12. PT. Sari Sarana
Kimiatama
Appointment of Importers
Limited
lmportation Approval Letter Acetone 300 liter & 300
MT
MEK 2.000 liter &
2.000 MT
Toluene 6.000 liter &
6.000 MT
13. PT.
Printechnindo
Raya Utama
Extension of Appointment
of Importers Limited
lmportation Approval Letter MEK 34.600 litre
14. PT. Itochu
Indonesia
lmportation Approval Letter Toluene 18.000 ton &
25.500 litre
MEK 6.000 ton &
1.400 litre
Acetone 6.000 ton &
17.800 litre
Asetat Anhidrida 900 litre
Dietil Eter 19.590 litre &
40 ton
Asam Klorida 140.000 litre &
4.400 ampule
Asam Fenilasetat 120 kg
Piperidina 24 kg & 40 litre
Kalium Permanganate 1.330 kg & 280
litre & 1.430
ampule
Asam Sulfat 36.110 litre &
2.300 ampule
Extension of Appointment
of Importers Limited
15. PT. Nagase
Impor Ekspor
Indonesia
lmportation Approval Letter Hydrochloric Acid 3.200 kg
16. PT. Samchem
Prasandha
Extension of Appointment
of Importers Limited
lmportation Approval Letter Acetone 800 MT
Toluene 1.500 MT
MEK 1.550 MT
17. PT. Prochem
Tritama
lmportation Approval Letter Hydrochloric Acid 92.876,91 kg
Sulphuric Acid 76.385 kg
Acetone 25.920 kg
Toluene 4.680 kg
MEK 400 kg
18. PT. Praganusa lmportation Approval Letter Toluene 1.440 kg
19. PT. Fanindo
Chiptronic
lmportation Approval Letter Acetone 1.240 litre
MEK 2.300 litre
Toluene 32.400 litre
Sulfuric Acid 40 liter & 4.000
20. PT. Arta Palu Export Approval Letter Sassafras Oil 17.200 kg
Pre-Export Notification Sassafaras Oil 90% 17.200 kg
Export Approval Letter Sassafras Oil
(safrole content min 90%)
17.200 kg
Pre-Export Notification Sassafras Oil
(safrole content min 90%)
17.200 kg
33Journal of Data on the Prevention and Eradication of Drug Abuse and Illicit Trafficking (P4GN)
Year 2013 Edition 2014
1 2 3 4 5
21. PT. Udaya
Anugerah Abadi
lmportation Approval Letter Toluene 6.000 MT
Methyl Ethyl Ketone 2.000 MT
Acetone 1.000 MT
Extension of Appointment
of Importers Limited
22. PT. Rukun
Persada
Makmur
lmportation Approval Letter Potassium
Permanganate
40 ton & 60 MT
Extension of Appointment
of Importers Limited
23. PT. Elang Kurnia
Sakti
lmportation Approval Letter Sulphuric Acid 58.140 kg
Hydrochloric Acid 58.695 kg
24. PT.
Indochemical
Citra Kimia
Extension of Appointment
of Importers Limited
lmportation Approval Letter Toluene 48.000 MT
Methyl Ethyl Ketone 15.000 MT
Acetone 6.000 MT
25. PT. Karunia
Jasindo
lmportation Approval Letter Hydrochloric Acid 1.500 litre
Potassium Permangante litre
Acetone 6.000 litre
Acetic Anhydride 400 litre
Diethyl Ether 2.000 litre
MEK 100 litre
Sulfuric Acid 2.000 litre
Toluene 1.200 litre
26. PT. Indofa
Utama Multi
Core
lmportation Approval Letter Hydrochloric Acid 7.500 litre
Sulphuric Acid 1.500 litre
Toluene 300 litre
27. PT. Multi Eka
Chemicalindo
Extension of Appointment
of Importers Limited
lmportation Approval Letter Hydrochloric Acid 3.750 litre
Sulphuric Acid 1.000 litre
28. PT. Wilmar
Chemical
Indonesia
Appointment of Importers
Limited
29. PT. Synergi
Multi Daya
Pratama
Appointment of Importers
Limited
30. PT. Makro Jaya Appointment of Importers
Limited
lmportation Approval Letter Methyl Ethyl Ketone 1.140 litre
Acetone 440 litre
31. PT. Merck, Tbk. Exportation Approval Letter Diethyl Ether 8.500 litre
Acetone 10.000 litre
32. PT. Sinar Berkat
Anugrah
lmportation Approval Letter Potassium
Permanganate
40.000 kg
Extension of Appointment
of Importers Limited
33. PT. Marga Cipta
Selaras
Appointment of Importers
Limited
Source : Directorate of Psychotropics Substance and Precursors BNN, March 2014
34Journal of Data on the Prevention and Eradication of Drug Abuse and Illicit Trafficking (P4GN)
Year 2013 Edition 2014
j. Results of Laboratory-tested Drug Samples in 2013, and NPS List and its
Derivateves in Indonesia from BNN
Table 63. Total Results of Tested Samples at BNN Drug Laboratory, 2013
NO. MONTH
NARKOTICS PSYCHOTROPIC NEGATIVE PRECURSOR
TOTAL
RAW
MATE-
RIAL
URINE
RAW
MATE-
RIAL
URINE
RAW
MATE-
RIAL
URINE
RAW
MATE-
RIAL
URINE
1 2 3 4 5 6 7 8 9 10 11
1. January 1,310 124 8 - 27 518 - - 1,987
2. Pebruary 1,153 114 3 - 43 28 1 - 1,342
3. March 115 106 4 - 55 34 - - 314
4. April 1,479 168 13 - 48 52 - - 1,760
5. May 1,231 155 8 - 42 50 - - 1,486
6. June 1,541 158 20 - 134 55 - - 1,908
7. July 1,463 137 6 - 95 29 55 - 1,785
8. Augst 672 122 9 - 21 65 - - 889
9. September 1,302 129 10 - 48 45 - - 1,534
10. October 1,458 141 18 - 66 58 - - 1,741
11. November 1,375 134 3 - 48 162 6 - 1,728
12. December 942 153 4 - 30 36 1 - 1,166
TOTAL 14,041 1,641 106 0 657 1,132 63 0 17,640
Source : Center for Drug Testing Laboratory BNN, March 2014
Table 64. NPS List and its Derivatives in Indonesia.
NO. IUPAC NAME EFFECTS
COMMON
NAME
TYPE
RE-
MARKS
1 2 3 4 5 6
1. 2-methylamino-1-(3,4-
methylenedioxyphenyl)propan-1-
one
Stimulan, halusinongen,
insomnia and
Sympathomimetic
Methylone
(MDMC)
Cathinone
Derivative
2. (RS)-2-methylamino-1-(4-
methylpenhyl)propan-1-one
Stimulan, Increasing
heart rate and harmful
Mephedrone (4-
MMC)
Cathinone
Derivative
3. (±)-1-phenyl-2-
(methylamino)pentan-1-one
Psychostimulant Pentedrone Cathinone
Derivative
4. (RS)-2-ethylamino-1-(4-
methylphenyl)propan-1-one
Stmulant with teh
effect of empathogenic
4-MEC Cathinone
Derivative
5. (RS)-1-(benzo[d][1,3]dioxol-5-yl)-2-
(pyrrolidin-1-yl)pentan-1-one
euphoria, stmulan,
effect aphrodisiac and
effect empathogenic
MDPV Cathinone
Derivative
6. (RS)-2-ethylamino-1-phenyl-
propan-1-one
Psychostimulant Ethcathinone
(N-
ethylcathinone)
Cathinone
Derivative
7. (RS)-1-(4-methylphenyl)-2-(1-
pyrrolidinyl)-1-hexanone
Psychostimulant MPHP Cathinone
Derivative
8. Catha edulis mengandung
cathinone dan cathine
Psychostimulant Khat Plant
containing
Cathinone dan
Cathine
Cathinone
and Cathine
35Journal of Data on the Prevention and Eradication of Drug Abuse and Illicit Trafficking (P4GN)
Year 2013 Edition 2014
1 2 3 4 5 6
9. (1-pentyl-1H-indol-3-yl)-1-
naphthalenyl-methanone
Halusinogen, effect
cannabinoid and toxic
JWH-018 Syntetic
cannabinoid
10. (1-(5-fluoropentyl)-1H-indol-3-
yl)2,2,3,3-tetramethylcyclopropyl)-
methanone
Halusinogen, effect
cannabinoid and toxic
XLR-11 Syntetic
cannabinoid
11. 5-fluoroAKB48 Halusinogen, effect
cannabinoid andtoxic
5-fluoro AKB 48 Syntetic
cannabinoid
12. MAM2201 Halusinogen, effect
cannabinoid and toxic
MAM 2201 Syntetic
cannabinoid
13. N,N-2-dimethyl-1-phenylpropan-2-
amine
Stimulan, lower than
the effect of
methamphetamine
DMA
(Dimethylam-
phetamine)
Phenethylamine
Derivative
14. 5-(2-aminopropyl)benzofuran Stimulan,
empathogenic
5-APB Phenethylamine
Derivative
15. 6-(2-aminopropyl)benzofuran Euphoria 6-APB Phenethylamine
Derivative
16. 1-(4-methoxyphenyl)-N-methyl-
propan-2-amine
Stimulan, halusinongen,
insomnia and
Sympathomimetic
PMMA Phenethylamine
Derivative
17. 2-(4-Bromo-2,5-
dimethoxyphenyl)ethanamine
Hallusinogen 2C-B Phenethylamine
Derivative
18. 1-(4-chloro-2,5-dimethoxy-
phenyl)propan-2-amine
Euphoria, archetypal
psychedelic
DOC Phenethylamine
Derivative
19. 2-(4-Iodo-2,5-dimethoxyphenyl)-N-
[(2-
methoxypehyl)methyl]ethanamine
Stimulan, halusinogen,
and Toxic
25I-NBOMe Phenethylamine
Derivative
20. 2-(4-Bromo-2,5-dimethoxyphenyl)-
N-[(2-
methoxypehyl)methyl]ethanamine
Stimulan, halusinogen,
and Toxic
25B-NBOMe Phenethylamine
Derivative
21. 2-(4-Chloro-2,5-dimethoxyphenyl)-
N-[(2-methoxypehyl)methyl]etha-
nemine
Stimulan, halusinogen,
and Toxic
25C-NBOMe Phenethylamine
Derivative
22. 1-benzofuran-4-ylpropan-2-amine Stimulan, halusinogen,
and Toxic
4 APB Phenethylamine
Derivative
23. 1-Benzylpiperazine Euphoria, Increasing
heart rate, dilated
pupils, and Toxic
BZP Piperazine
Derivative
24. 1-(3-Chlorophenyl)piperazine Euphoria, Increasing
heart rate, dilated
pupils, and Toxic
mCPP Piperazine
Derivative
25. 1-(3-
Trifluoromethylphenyl)piperazine
Euphoria, Increasing
heart rate, dilated
pupils, and Toxic
TFMPP Piperazine
Derivative
26. 2-(1H-indol-3-yl)-1-methyl-
ethylamine
Euphoria, empathy,
psychedelic, stimulan,
dan anxiety
αMT Tryptamine
Derivative
27. Mitragyna speciosa mengandung
mitragynine dan speciogynine
Opiat and cocaine like
effect
Kratom
containing
mitragynine and
speciogynine
Plant / Pollent
28. 2-(2-chlorophenyl)2-
(methylamino)cyclohexan-1-one
Hallusination, euphoria,
psychotomymetic
Ketamine Ketamine
29. (RS)2-(3-methoxyphenyl)-2-
(ethylamino)cyclohexanone
Halusinasi, euphoria,
psychotomymetic
Methoxetamin Ketamin
Derivative
Source : Center for Drug Testing Laboratory BNN, March 2014
36Journal of Data on the Prevention and Eradication of Drug Abuse and Illicit Trafficking (P4GN)
Year 2013 Edition 2014
2. Demand Reduction.
a. Results of BNN National Survey on Drug Abuse and Illicit Trafficking in the
Sector of Transportation, 2013.
1) Methodology.
a) Study Design.
The study applies the cross-sectional approach targeting
workers of transportation modes. Data collection is carried out
through the qualitative and quantitative method.
b) Study Location.
Conducted in 23 provinces with the province capital as the
main study location, considering that the central offices of
transportation are located in the center of the city. For example,
airways companies, Railway company, shipping companies, general
transportation, taxi companies, etc. Purposive selection is made on
provinces based on the mapping of transportation modes (land and
sea transportation). The mapping shows that several transportation
are available at each province. The selected provices are: Aceh,
North Sumatera, West Sumatera, South Sumatera, Riau, Lampung,
Ruiau Isands, Banten, Jakarta, West Java, Central Java, East Java,
Bali, West Kalimantan, Central Kalimantan, East Kalimantan, North
Sulawesi, South Sulawesi, S.E. Sulawesi, West Nusatenggara (NTB),
Maluku and Papua.
c) Population and Number of Samples
The sector of land transportation accomodates thelargest
amount of worker population, approx. 6,010,042 of a total 8,056,307
workers in the whole sector of transportation (BPS 2010). Air
transportation absorbs 1,046,607, sea transportation 721,261, and
ASDP (Water, Lake and Water Crossing) 211,205, and the railway
company has the smallest number of workers, namely, 67,131. From
these data a proportion is made for the respective sub-sectorsin
order to accomplish their representation, and be able to assume the
following probability:
37Journal of Data on the Prevention and Eradication of Drug Abuse and Illicit Trafficking (P4GN)
Year 2013 Edition 2014
Table 65. Estimated Proportion of Transportation Workers
LAND TRANSPORTATION TRANSPORTASI LAUT
OTHERS
INTER-
CITY
TRANS
PORTA
TION
CITY
TRANS
PORTA
TION
KERETA
API
ASDP:
FERRY/
RIVER
CROSSING
NATIONAL
SHIPPING
(PASSENG
ERS)
NATIONAL
SHIPPING
(GOODS)
Estimated
worker
population
75% 5% 1% 9% 10 %
Sub-sector
assumed
estimation
35% 40% 3% 3% 4,5% 4,5% 10%
The number of study samples is based on the Lemeshow
formula, and the data from the Study on Drug abuse workers in
2012, by using the following formula:
With this statitiscal assumption: 1). Estimation of one
proportion with 95% trust, 19% reliability, design effect (deff); 2).
Based on this calculation the established number of samples in each
sector of transportation is 315 respondents. The survey was able to
collect data from more than 10,000 target respondents and its
realization at the end of the survey, as is shown in the table below:
Table 66. Target and Realization of the Survey at the Sector of
Transportation
LAND
ASDP
(CROSSING)
RAILWAY SEA
Target 7.590 352 352 920
Realization 7.628 341 386 896
2) Results.
a) Characteristic.
The majority of respondents are above the age of 30 years
(76%), with an average of 37, although this varies in the different
modes of transportation. An average of a younger age is found in the
air and railway transportation modes. The majority of respondents
are married and live with the family, or relative. Domination of male
workers is truly felt in the sector of transportation, as most of the
respondents are males (97%). From the aspect of education, almost
all respondents are from secondary education, the largest proportion
among railway workers. Respondents with a higher education are
found in the air and sea transportation.
2
2
2/1 )1(
d
PPz
n

 
X deff (design effect)
38Journal of Data on the Prevention and Eradication of Drug Abuse and Illicit Trafficking (P4GN)
Year 2013 Edition 2014
Table 67. Respondent’s Characteristic
VARIABLE SEA LAND
ASDP
(CROSSING)
RAILWAY
N 896 7628 341 386
Age (years)
Mean 39 38 38 31
Median 39 37 37 27
SD 10 9 11 10
< 30 19,6 19,6 26,3 59,5
≥ 30 80,4 80,4 73,7 40,5
Gender
Male 98,4 99,5 100 98,2
Female 1,6 0,5 1,8
Education
No response 0,1 0,2 0,5
No education/not finished
elementary
1,3 7,0 8,8 0,8
Passed Elementary/equivalent 4,1 11,8 12,9 1,8
Passed Junior High/equivalent 6,8 30,1 20,2 6,7
Passed Senior High/equivalent 39,8 47,3 41,9 79,0
Passed Academy/Higher
education/PT
47,8 3,6 16,1 11,1
Marital Status
No response 0,2 0,0 0,3
Not married/single 12,8 11,3 16,7 39,6
Married 85,2 86,7 81,8 60,1
Widow/widower 0,7 0,4 0,3
Divorced 1,1 1,3 0,9
Living together 0,1 0,3
b) Drug Abuse PRevalence
The prevalence of drug abuse is measured by applying 3
approaches of drug use: lifetime (ever used), pastyearand past
month (current user). This report focuses on the past year use, since
this gives an illustration of the present drug abuse situation. The
prevalence of current user indicates a potential drug abuser high
addiction with compulsion of routine drug consumption.
39Journal of Data on the Prevention and Eradication of Drug Abuse and Illicit Trafficking (P4GN)
Year 2013 Edition 2014
(1) Drug Abuse Prevalence Based on Lifetime Use (Ever used)
The lifetime drug abuse prevalence among workers is
relatively high (18.9%), or 1 of 5 workers has at least taken a
drug once in his/her lifetime. This rate is the highest among
workers of land transportation, 20% and 19%, while the lowest
rate is among workers of railway transportation (5.75%).
Table 68. Lifetime, Past Year and Past Month Drug Abuse Prevalence
VARIABLE SEA LAND
ASDP
(CROSSI
NG)
RAIL-
WAY
TOTAL
Lifetime 16,2 20,1 16,1 5,7 18,9
Past Year 5,4 7,6 9,7 0,8 6,9
Past Month 1,0 2,9 4,7 0,0 2,5
Likewise with past month (current user) drug abuse
prevalence that shows a relatively high rate (6.9%), with the
highest prevalence rate of 9.7% among workers of ASDP
(Crossings) and 7.6% among workers of land transportation.
Past month prevalence of drug abuse is detected in all modes
of transportation except railway. This condition indicates that
there are still workers who routinely take the drug in their
daily work. A prevalence of 2.5% is found in all modes of
transportation, indicating the highest for ASDP and land
transportation.
Based on the age group of respondents, the lifetime drug
abuse prevalence is higher among the group below 30 (20%)
compared to above 30 (18%). The highest prevalence rate is
concentrated in the group with and higher education (the
minimum of diploma or higher), indicating a prevalence of
19.5% in both groups. Based on marital status, drug abuse
prevalence is higher among the divorced group (27.5%),
compared to the single and married groups, respectively 22%
and 18%.
40Journal of Data on the Prevention and Eradication of Drug Abuse and Illicit Trafficking (P4GN)
Year 2013 Edition 2014
Apparently, income of a worker also has an influence on drug
abuse. Among respondents with a higher income drug abuse
prevalence is also higher. Respondents with an income of more
than Rp 10 million have a greater proportion (23%) compared
to those with less earnings, below Rp. 10 million. This survey
also discovered that workers with different status show
variable prevalence. Temporary workers indicate a higher
percentage of prevalence (20%) than permanent workers
(17%).
The pattern of drug prevalence in the past year is not
much different to lifetime abuse. Based on age group, the
percentage of past year drug abuse is greater in the group
below 30 (8.7%), and above 30 (6.2%).This pattern is
somewhat different for lifetime abuse in the group with
educational background. A higher rate is seen among the
group of secondary education (7.4%), while the group with
lower education (< Elementary) 6.2%, and the group with
higher education (D1) 5%. Based on marital status the rate is
higher among the singles/not married (9.7%), and married
(6.2%). Most interesting is the group without marital status,
but live together. They tend to have a higher prevalence rate
of drug abuse. However, since the samples are relatively small
in number, it is not possible to make a generalization. Likewise
with lifetime drug abuse among loose workers, or who have no
permanent job. They have a higher prevalence for past year
drug abuse (9.1%) than workers with permanent jobs or
contracted. From the aspect of earnings, prevalence is
different lifetime drug abuse. Respondents with lower earnings
tend to have a higher rate of prevalence.
(2) Drug Abuse Based on the Level of Drug Dependency
Table 69. Drug Abuse Prevalence Based on the Level of Dependency
(Experimental use, Regular use, Non-IDU, IDU)
DRUG DEPENDENCY SEA LAND
ASDP
(CROSSING)
RAILWAY TOTAL
Experimental 4,13 4,61 6,16 0,78 4,36
Regular 1,23 2,43 2,93 0,00 2,03
Non-IDU 0,00 0,46 0,59 0,00 0,38
IDU 0,00 0,12 0,00 0,00 0,09
41Journal of Data on the Prevention and Eradication of Drug Abuse and Illicit Trafficking (P4GN)
Year 2013 Edition 2014
Based on the level of dependency, drug abuse prevalence indicates
the number of experimental drug use, or those who are in a condition of
dependency, either for recreational purposes or due to addiction. The
prevalence rate for experimental use is 4.4% in all modes of
transportation, the highest (6.2%) is reported among workers of ASDP
(Crossings), land transportation (4.6%) and sea transportation (4.6%).
Prevalence rate of 2.3% for regular use indicates the routine use of drug
for recreational purposes as well as to ease their dependency/addiction.
Regular drug abuse is found at all modes of transportation except railway,
the highest prevalence among ASDP and land transportation. IDUs are
also reported among workers of land and ASDP transportation.
3) History of Drug Abuse
a) First Drug Abused
The first drug abused among worker respondents of
transportation is quite variable, from cannabis/marihuana, ecstasy,
nipam, and shabu. The prevalence of first time drug use (cannabis) is
the highest (11.94%), followed by ecstasy (1.32%), shabu and all its
kinds (0,91%), koplo pill and all its kinds (0.50%), nipam (0.27%) and
dextro (0.77%). Cannabis and ecstasy have become very common as
the first drug, that may indicate the easy acquisition of both these
drugs.
The prevalence of first use drugs according to the transport
modes, pattern of drugs use does not have a big difference with the
prevalence of the first drugsuseaccording to the types of drugs.
Types of drugs: marijuana, ecstacy, shabu and methamphetamine
are popular among the first use level according to the transportation
modes. Marijuana is the highest number (13.1%) used by the land
transport mode workers, followed by the sea transportation mode
workers (9.8%). While ecstacy is more popular among the group of
ASDP workers (2.0%), the inland transportation mode workers
(1.4%) and sea transportation mode workers (1.2%). The other type
of drugs that popular for the first use is shabu, it has the highest
prevalence among the land transportation workers (1.14%) and
ASDP transportation workers (0.9%).
42Journal of Data on the Prevention and Eradication of Drug Abuse and Illicit Trafficking (P4GN)
Year 2013 Edition 2014
11,7
0,8
15,8
1,2
10,1
0
3,9
0,3
0
2
4
6
8
10
12
14
16
18
Ganja Hasish (getah ganja)
Laut Darat ASDP Kereta api
1
4,3
1,2
3,4
0,7
4,9
0,7
5,2
0
8,9
0
7,1
0,3
1,3
0,3
0,8
0
2
4
6
8
10
Laut Darat ASDP Kereta api
0
0,1
0,2
0,3
0,4
0,5
0,6
0,7
0,8
0,9
1
Luminal,fenobarbital,
(barbiturat)
Nipam
Pilkoplo,
Rohypnol,mogadon
Valium
Xanax,Camlet/calmlet
(alprazolam)
Dumolid
Kokain
Ketamin
Laut Darat ASDP Kereta api
The first use of opiates such as heroin, putau, morphine and
opium, was also reported among workers of transportation,
generally, the prevalence is relatively low, below 0.1%. The highest
was detected in the use of codein, 0.8%. The use of opiates is found
in all modes of transportation, in exception of railway. The highest
prevalence is reported for codein among workers of land
transportation (0.4%) and morphine among ASDP workers (0.29%),
sea transportation (0.11%), while heroin was only found in the ASDP
transportation (0.04%).
Other drugs that are used as the first drug are tranquillizers:
koplo pill, BK, mogadon, valium, rohipnol, dumolit and Xanax. The
highest prevalence among these drugs is respectively for koplo pill
(0.50%), nipam (0.27%). The prevalence of other drugs in this groups
is below 0.1%, valium (0.08%), dumolid (0.03%), and Xanax/camlet
(0.02%).
0
0,2
0,4
0,6
0,8
1
1,2
1,4
1,6
1,8
Laut Darat ASDP Kereta api
Figure 1. First abuse of Cannabis Figure 2. First Abuse of ATS
Figure 4. First Abuse of TranquillizersFigure 3. First Abuse of Opiates
Cannabis Hashish
Sea Land Railway Sea Land Railway
43Journal of Data on the Prevention and Eradication of Drug Abuse and Illicit Trafficking (P4GN)
Year 2013 Edition 2014
This survey also shows the prevalence in the use of over-the-
counter drugs, e.g. drugs for head ache relief, cough syrups, and
analgesics. The use of these medicines becomes the drug abuse
when used excessively, mixing the drug with alcoholic drinks or soda
drinks with the purpose to become intoxicated, or fly. The most drug
used in excess in this groupare medicines for head ache relief
(1.18%), mixed with soda drinks (0.59%) among ASDP workers, and
dextromethorphan (0.93%) among land transportation workers.
b) Age of First time Drug Use
The first age of drug use among transportation workers is the
average of 20 years (median 20 years, Elementary 5 years). From the
aspect of age for the first drug use, the majority (95%) had the first
drug at the age of <30 years. Some (47%) are < 20 years, and another
part (48%) between 20 – 29 years. This indicates a condition that the
first drug use is done at an early age.
In the sea transportation sector almost half portion of the
workers (47%) consume drugs between 20-29 years, likewise with
ASDP workers (46%). Among workers in the area of land
transportation, the proportion of first time drug abuse is somewhat
the same in the group below 20 years (47%) and between 20-29
years (48%). In the railway sector the majority of workers (80%) take
drugs <20 years.
Table 70. Distribution of Respondents Based on Age for First time Drug Abuse
VARIABLE SEA LAND ASDP RAILWAY TOTAL
N
Age group
< 20 36,1 46,9 42,0 80,0 47,1
20 – 29 56,3 48,2 52,0 20,0 47,6
30 – 39 5,9 4,0 6,0 4,3
≥ 40 1,7 0,9 0,9
Mean 21 20 19 17 20
Median 20 20 20 17 20
SD 5 5 7 3 5
44Journal of Data on the Prevention and Eradication of Drug Abuse and Illicit Trafficking (P4GN)
Year 2013 Edition 2014
c) First Time Drug Abuse
This study also shows that first time drug abuse is done before
entering the working world than after. The prevalence of drug abuse
after having a job is half the proportion than drug taking before
becoming a worker. The prevalence of transportation workers
before having a job is approx.. 11%, while drug taking after having a
job is 6%. The prevalence of drug abuse based on transportation
mode does not differ so much. However, the rate of drug abuse
before work among land transportation workers (12%) is higher than
the three other modes of transportation. The high prevalence rate of
the first drug taking after having a job is of much concern. From the
aspect of transportation mode, the prevalence rate among ASDP
workers is the highest (8%), followed by land transportation (7%),
and sea transportation (5%). Based on lifetime drug abuse the
proportion of drug taking before having work reaches 64%, while the
remaining 36% starts drug taking after entering the working world.
This condition suggests that illicit drug trafficking is present
among the workers of transportation, or there is a tendency of drug
use within a particular mode of transportation. The qualitative study
indicates that drug taking is influenced by fellow workers of one
profession, but generally not from the same company. It is assumed
that fellow workers with the same profession from other regions
have much influence in the initial drug taking for reasons to relieve
boredom and weariness. The lowest prevalence rate is reported
among railway workers, since no one is reported taking drugs after
entering the working environment.
Table 71. Distribution of Respondents Based on First Time Drug use (Before of
After Working) Based on Transportation Mode
VARIABLE SEA LAND CROSSING RAILWAY TOTAL
N
Before entering the working
world
8.9 11.7 7.3 4.1 10.9
After entering the working
world
4.6 6.9 7.9 0.0 6.1
Never use a substance/drug 82.8 80.2 80.6 94.3 79.8
No response 3.7 1.1 4.1 1.6 3.2
45Journal of Data on the Prevention and Eradication of Drug Abuse and Illicit Trafficking (P4GN)
Year 2013 Edition 2014
d) Drug Abuse Based on Type of Drug (Lifetime Drug Use)
Lifetime drug abuse indicates a variation of different types of
drugs consumed by transportation workers, although only once in a
lifetime. The prevalence based on the type of drug shows that
cannabis/ganja remains the most consumed (14.6%), in particular
dried cannabis. The next is ATS, which are ecstasy, shabu, cathinone
and amphetamines, with a prevalence rate of 7%. The third in rank
are tranquillizers (2.3%) followed by opiates and hallucinogens
(2.1%), inhalants (1.1%) and over-the-counter drugs, e.g. drugs for
headache relief and dextro (2%).
In the lifetime use for cannabis, the workers in the
transportation mode the prevalence rate of workers in the sector of
land transportation who take cannabis is the highest (16%), followed
by sea transportation (12%), Crossings/ASDP (10%), and the lowest
among railway workers (3.4%). In this group some workers have ever
consumed hashish, indicating a prevalence of 1.2%. Based on mode
of transportation, land transportation 1.2% and sea transportation
0.8%.
The prevalence rate of opiates lifetime use among land
transportation workers is (2%), sea (1.7%), ASDP (1.2%) and railway
(0.8%). The most frequent drug used in the group of opiates is heroin
(putau) 1.6%, morphine (1.1%), opium and codein respectively (0.7^)
and (0.6%).
Lifetime use for ATS is the highest among workers of ASDP
(12.4%), followed by and transportation (7.4%), sea transportation
(6%), and the lowest railway workers (2%). Ecstasy and shabu in the
ATS group are the most frequently used, with a prevalence of
respectively 4.9% and 4.6%. The prevalence for ecstasy is the
highest in the ASDP sector(8.9%), then land transportation (4.9%).
The highest prevalence rate for shabu is also found in the sector of
ASDP (7.1%), followed by land transportation (5.2%).
e) Drugs of Past Year Abuse
Past Year drug abuse illustrates the many kinds of drugs
consumed and circulating among transportation workers and the .
The survey indicates that almost all kinds of drugs predicted being
consumed by the community are apparently also consumed in the
past year by transportation workers, although not in all modes of
transportation.
46Journal of Data on the Prevention and Eradication of Drug Abuse and Illicit Trafficking (P4GN)
Year 2013 Edition 2014
The most consumed drug by transportation workers in the past
year is cannabis, with a prevalence of 4.9%. The use os ATS is also
quite high, showing a prevalence of 2.3%. The prevalence for
opiates, tranquillizers, hallucinogens and inhalants is below 1%.
However these drugs belong to dangerous drugs.
Among ATS the most consumed are ecstasy and shabu, with a
prevalence of 1.4% for both drugs. Cathinone is also used with a
prevalence of 0.3%. In the group of opiates, heroin (0.5%), morphine
(0.4%) and opium (0.2%). Tranquillizers: luminal (0.4%), koplo/BK
(0.5%), and phenobarbital (barbiturate) 0.1%. In the group of
hallucinogens, the most consumed are mushroom (0.3%), kecubung
(0.3%), another is LSD (0.1%), still in circulation. Among over-the-
counter drugs, the most frequently used is dextromethorphan
(0.7%).
Past year drug abuse based on the transportation modeshows
a quite high rate i8n s certain mode. The majority of sorkers in the
sector of land transportation take cannabis with a prevalence of
(5.7%), followed by ASDP workers (4.1%), and sea transportation
(3.9%). Past year opiates abuse, in particular heroin, is also found
among ASDP and land transportation, railway and sea
transportation with a prevalence of consecutively (0.6%), (0.5%),
(0.3%) and 0.1%).
The abuse of ATS (ecstasy) is found in all modes of
transportation with the exception of railway. The prevalence is
respectively for ASDP the highest (4.1%), land (1.6%), and sea (1.6%).
Consumption of shabu is also seen in the past year among workers
os ASDP (3.6%), land (1.7%) and sea (1.1%)
Consumption of tranquillizers is not evenly spread in all
modes. The most consumed are koplo pill/BK, valium and nipam in
the ASDP mode. Valium in all modes except railway, while koplo pill
and nipam in ASDP, land and sea transportation. In the group of
hallucinogens, mushroom is used among workers of land and sea
transportation. Over-the-counter drugs in all modes except in the
railway transportation.
47Journal of Data on the Prevention and Eradication of Drug Abuse and Illicit Trafficking (P4GN)
Year 2013 Edition 2014
f) Frequency of Drug Abuse
Some concerns were much discussed in relation with drug
abuse in the modes of transportation, in particular on the time,
quantity and frequency of drug abuse among the workers. The
impact of drug abuse before or during work certainly influences the
workers’ performance and concentration in doing their task. The
prevalence of frequency in the consumption of drugs among
transportation workers is classified into always, frequently and
rarely. The majority of workers admit having consumed drugs eithr
before, during and outside work hours.
The frequency of drug abuse based on the mode of
transportation indicates that workers who always take drugs before
work the prevalence is (0.2%), and reported in the land and sea
transportation. Those reporting frequently before work (0.5%) are in
all modes of transportation, except Railways. A higher prevalence is
reported for rarely before work (3.7%). A similar pattern is seen for
drug abuse outside work hours, but generally the prevalence shows
a higher rate. Repondents reporting always has a prevalence of
(0.2%), detected in land and sea transportation. While those
reporting frequently (1.7%) are in all transportation modes except
Railways. The prevalence for those reporting rarely is relatively
higher (4.7%), als9o reported in all transportation modes except
Railways.
Workers reporting taking drugs during work activites has a
lower prevalence than those taking drug before or outside work
hours. Workers reporting “frequently” and “always” take drugs
during work are detected in the land and sea transportation, with a
prevalence of respectively (0.1%) and (0.3%), while those reporting :
rarely” (2.6%) are in all modes of transportation, except Railways.
4) Risk Behavior : Smoking, Drinking and Unsafe Sex
A number of risk behaviors are also explored in the study, such as
smoking, drinking and unsafe sex. The prevalence of smoking among
transportation workers is very high at all times of consumption, lifetime,
past year and past month. It can be said that all workers have ever smoked
(85%). Related to drug abuse, drug abusers have a somewhat higher rate
of prevalence (95%) than non-drug abuser (82%). In other words, smoking
is very closely related with the life of smoking workers, particularly with
drug abusers.
48Journal of Data on the Prevention and Eradication of Drug Abuse and Illicit Trafficking (P4GN)
Year 2013 Edition 2014
The prevalence of drinking among transportation workers is quite
high, but its rate varies according to the time of consumption: lifetime,
past year and past month. More than half the portion of respondents
reported having at least ever taken alcohol in their lifetime (58%), a lower
rate for those who reported past year consumption (41%), and past month
drinking (23%). A higher prevalence of drinking is seen among drug
abusers (95%), than among non-drug abusers, (52%) for lifetime, while
past year drinking covers two-third of the number of drug abusers (68%)
compared to non-drug abusers (36%). This condition illustrates that
drinking behavior is closely related to drug abuse behavior.
Lastly, unsafe sex. It can happen when this is done between non-
permanent sex partners (husband/wife), and no use of condoms. The
prevalence of sex with non-=permanent partners (husband/wife) is wuite
high, with boy/girld friend (21%), with intimate friend (8%), acquaintance
(6%), and sex worker (12%). The use of condoms during intercourse with
non-permanent partners is relatively low, the prevalence of condom use
with sex workers (8%), with boy/girl friend (11%), with a friend (5%), and
acquaintance (3%). It can be said that unsaf sex behavior among
transportation workers is relatively high. Other data confirm the
consistent use of condoms with a sex partner is very low, indicating only a
prevalence of (3%).
5) Understanding and Attitude Related to Smoking, Drinking and Drug
Abuse
a) Understanding on Drugs
Understanding of drugs covers types of drug one has ever
heard, effect of drug abuse, for example risk of injecting and
HIV/AIDS, addiction, problem in managing the dose of drugs, and
drugs destroys the brain and nerves. From 29 drugs circulating,
respondents can only mention about 7 kinds of drugs. Related to
understanding the effect of drugs respondents have relatively a good
knowledge, except about the effect of the problem in managing the
drug dose. The majority of respondents know that injecting has the
the risk of HIV/AIDS infection (90%), drugs cause dependency/
addiction (87%), and drugs ruin the nerves (95%). The number of
repondents who understand at least three effects of drug abuse is
quite high (85%), Generally, the understanding of drug abusers on
drugs and their effects is better than the non-drug abusers.
49Journal of Data on the Prevention and Eradication of Drug Abuse and Illicit Trafficking (P4GN)
Year 2013 Edition 2014
Table 72. Knowledge on Drugs Based on the Substance ever Heard and Effect
of Drug Abuse
SEA LAND
ASDP/
CROSSING
RAILWAYS
DA NDA DA NDA DA NDA DA NDA
N 145 751 1,534 6,094 55 286 22 364
Total Substances ever heard
Mean 10.0 7.9 8.3 5.9 8.1 5.8 9.9 8.6
Median 10.0 7.0 7.0 5.0 7.0 5.0 9.5 9.0
Minimum 0.0 0.0 0.0 0.0 1.0 0.0 1.0 0.0
Maximum 27.0 29.0 29.0 29.0 22.0 21.0 21.0 29.0
Effects of Drug Abuse
know IDU has great risk for HIV/AIDS 90.3 79.2 81.9 73.8 78.2 71.7 86.4 80.2
Know the risk of addiction/
dependency
86.9 71.8 77.2 72.3 80.0 73.8 72.7 82.4
Know the problem of managing the
dose of drugs
60.0 53.1 62.4 56.3 52.7 58.0 45.5 54.4
Know drugs ruin nerves/brain 95.2 83.5 87.3 82.4 83.6 79.0 86.4 89.0
Know≥ 3 effects of drug abuse 84.8 69.5 74.1 66.8 74.5 67.8 68.2 75.5
Note : DA = Drug Abuser NDA = Non-Drug Abuser
b) Attitude Related to Smoking, Drinking, Drugs.
The survey tries to explore the respondent’s attitude against
the attitude of smoking, drinking and drug abuse. The survey shows
that the attitude towards the three elements is generally positive as
the majority of respondents showed an attitude against the variable
as stated. The majority of respondents (90-96%) are against drinking
4-5 times/week, experiment with smoking cannabis, routinely smoke
cannabis, experiment with heroin, occasionally take heroin, routinely
take heroin, experiment with ecstasy, occasionally take ecstasy, and
routinely take ecstasy. A greater tolerance is seen among
respondents towards smoking than drinking and drugs, 1 out of 5
respondents agree with smoking 12-20 cigarettes per day. More
Many non-drug abusers show an attitude against all variables than
drug abusers.
Table 73. Attitude of Disagreement Against Attitude to Smoking. Drinking and
Drug Abuse.
SEA LAND ASDP RAILWAYS
DA NDA DA NDA DA NDA DA NDA
N 145 751 1,534 6,094 55 286 22 364
Smoking 12-20 cigts/day 70.3 86.3 70.3 80.4 70.9 81.1 72.7 84.3
Drinking 4-5 times/week 87.6 93.2 84.6 92.9 89.1 94.1 90.9 95.9
Experiment with cannabis smoking 91.0 97.5 89.4 97.4 89.1 96.9 95.5 98.1
Occasionally smoke cannabis 92.4 96.9 91.3 97.9 92.7 96.5 95.5 98.6
Routinely smoke cannabis 96.6 97.5 95.0 98.2 92.7 96.5 90.9 98.6
Experiment with heroin 97.2 97.3 95.0 98.1 94.5 96.9 95.5 98.4
Occasionally take heroin 96.6 97.1 95.6 98.1 94.5 96.9 95.5 98.6
Routinely take heroin 97.2 97.3 96.1 98.2 94.5 97.2 95.5 98.6
Experiment with ecstasy 95.9 96.8 93.9 98.1 94.5 96.9 95.5 98.4
Occasionally take ecstasy 96.6 96.8 94.7 98.2 94.5 96.9 95.5 98.6
Routinely take ecstasy 97.2 96.9 96.0 98.0 94.5 96.2 95.5 98.6
Note : DA = Drug Abuser NDA = Non-Drug Abuser
50Journal of Data on the Prevention and Eradication of Drug Abuse and Illicit Trafficking (P4GN)
Year 2013 Edition 2014
6) Respondent’s knowledge on the Access to Drugs in the Work
Environment,
a) Respondent’s Knowledge on the Access to Drugs.
A large portion (58.5%) of respondents stated not knowing of
an access to drugs in the work environment. Among all drug abusers
a great portion know the access to drugs. 5% of respondents know
and stated in getting quite easily even very easy to get drug within
the work environment (1.7%). The statement of the avaibility of
access with the work place is present in all modes of transportation
except Railway. The survey shows that there is indication of drug
trafficking in the transportation modes.
Drug abusers know better whethter there is access to drugs in
the work place. 13.6% of drug abusers respondents in the
transportation modes stated quite easy to obtain druts in the work
place. Respondents in ASDP are the largest of knowing that access
for drugs is present in the work place.
The percentage of those indicating access to drugs outside the
work place is greater than access to drugs in the work place. 8.4% of
respondents stated the access to drugs outside the workplace is
quite easy. and some respondents even stated to get drugs very
easily in the work environment (3.2%). Drug abusers know better
about the access in getting drugs than non-drug abusers.
Table 74. Prevalence of Respondent’s Knowledge on the Access to Drugs
Within and Outside the Workplace
SEA LAND ASDP RAILWAYS
DA NDA DA NDA DA NDA DA NDA
N 145 751 1,534 6,094 55 286 22 364
Access to drugs in the Workplace
Very difficult 31.0 17.8 25.9 24.2 30.9 22.7 9.1 13.2
Quite difficult 13.1 4.4 22.0 11.0 12.7 5.9 0.0 3.8
Quite easy 9.0 0.9 14.8 3.6 16.4 2.1 4.5 0.0
Very easy 1.4 0.5 2.9 1.8 7.3 0.7 0.0 0.0
Unknown 44.8 75.6 34.1 59.1 32.7 67.5 86.4 82.1
No response 0.7 0.7 0.3 0.3 0.0 1.0 0.0 0.8
Access to drugs within the living
environment:
Very difficult 15.9 10.5 18.1 17.8 14.5 17.1 9.1 6.9
Quite difficult 17.2 5.3 21.8 10.4 14.5 7.0 0.0 4.7
Quite easy 15.2 3.2 19.3 6.2 21.8 3.1 13.6 3.3
Very easy 6.2 1.2 6.1 2.8 9.1 1.0 0.0 0.0
Unknown 44.8 79.2 34.4 62.5 40.0 70.3 77.3 84.3
No response 0.7 0.5 0.3 0.3 0.0 1.4 0.0 0.8
DA : Lifetime Drug Abuser
NDA : Non Drug Abuser
51Journal of Data on the Prevention and Eradication of Drug Abuse and Illicit Trafficking (P4GN)
Year 2013 Edition 2014
7) Inducing to Take Drugs.
This survey indicates that workers in all modes of transportation are
prone to drug abuse. 17.9% of all respondents in the transportation modes
admit being offered to take drugs. Drug abusers are more frequently
induced to take drugs, however workers in the sector of sea, land and
ASDP are more vulnerable to inducement.
Most of the people offering drugs are generally friends in the
workplace, outside the dwelling place, and within the dwelling
environment. The largest percentage of people offering drugs are friends
witnin the dwelling environment (13.8%), friends in the workplace (9.1%),
and outside the workplace (6.9%).
It is known from the survey that many respondents mentioned drug
traffickers are those who offer drugs. 4.5% - 11.7% of drug abuse
respondents from all modes of transportation admit being offered drugs
by a trafficker. Even passengers (1.8%) offered drugs to respondents.
Schools/campus, rented houses/rooms, work place, in the street,
discotheque/pub/karaoke, dwelling place, friend’s house, bus terminal/
station, hotel/motel/guesthouse are the places much mentioned by
respondents being offered drugs. The most frequent places are friend’s
house, workplace and discotheque/pub and karaoke (6.9%; 5.8%; and
5.3%).
Table 75. Respondent’s Experience in the Offer to Drugs
VARIABLE
SEA LAND ASDP RAILWAYS
DA NDA DA NDA DA NDA DA NDA
N 145 751 1,534 6,094 55 286 22 364
Was ever offered drugs 42.8 6.7 53.1 12.8 43.6 9.1 31.8 2.7
Source of the offer
Relative 0.7 0.7 1.7 0.4 7.3 0.3 0.0 0.0
Younger/older brother/sister 0.7 0.1 0.7 0.1 7.3 0.3 0.0 0.0
Parents 0.0 0.1 0.3 0.1 1.8 0.0 0.0 0.0
Boy/girl friend/partner/husband/
wife
1.4 0.1 1.5 0.2 7.3 0.3 0.0 0.0
Fellow worker 24.1 3.2 29.2 5.3 29.1 3.1 4.5 1.1
Outside work friend 20.0 2.7 22.2 3.6 32.7 2.4 22.7 2.7
Friend in the dwelling environment 33.1 5.6 42.1 8.5 56.4 7.3 27.3 3.0
Passenger 5.5 0.9 4.8 1.2 5.5 1.4 0.0 1.1
Dealer/trafficker 11.7 1.2 8.0 1.3 10.9 0.0 4.5 0.8
Others…… 2.8 0.1 4.1 0.6 5.5 0.3 0.0 0.3
Place of offer
School/campus 9.7 1.1 7.1 0.8 1.8 0.3 13.6 0.5
Board/leased room/house 8.3 1.1 5.3 0.9 5.5 1.0 0.0 0.8
Workplace 15.9 2.3 19.4 3.4 25.5 2.1 4.5 0.5
Alley 7.6 2.0 14.9 2.7 16.4 2.4 18.2 0.8
Discotheque/pub/ karaoke 24.1 2.9 15.7 2.1 20.0 2.4 9.1 0.5
Own house 2.8 0.4 4.2 0.5 14.5 1.4 0.0 0.0
Friend’s house 22.8 2.7 23.5 3.4 25.5 1.4 9.1 2.2
Vehicle 6.2 0.9 5.3 1.1 10.9 1.0 0.0 0.0
Terminal/station 7.6 1.3 16.0 3.0 7.3 2.1 0.0 0.5
Hotel/lodging 5.5 0.9 3.7 0.5 3.6 0.7 0.0 0.5
Others…… 2.8 0.3 6.0 1.4 7.3 0.7 0.0 0.5
52Journal of Data on the Prevention and Eradication of Drug Abuse and Illicit Trafficking (P4GN)
Year 2013 Edition 2014
8) Exposure to P4GB Program.
a) Prevalence of Respondents having ever Heard of P4GN Program.
Almost half the total of respndents (47.8%) from all
transportation modes admit having heard information or have seen
matters related to P4GN in the workplace. There is no distinct
difference between drug users and non-drug users. This indicates
that information related to drug has reached workers in all modes of
transportation.
Communication channels employed by agencies or companies
in forwarding matters related to P4GN are very variable from
banners, posters, advertisement boards on drug abuse, information,
socialization on drug abuse, internal orders, and drug counseling.
Respondents’ reponses indicate that the most mentioned are
banners, posters or advertisement boards (82.2%), further also
mentioned is information activities and order within the agency of
company (48.9% and 44.8%). There is no great distinction seen in
relation with communication channels among the respective
transportation modes.
Table 76. Distribution of Respondents having heard of P4GN Programs
Based on Transportation
VARIABLE
SEA LAND ASDP RAILWAYS
DA NDA DA NDA DA NDA DA NDA
N 145 751 1,534 6,094 55 286 22 364
Have once received information related
to P4GN in the work place
66.2 63.0 49.5 40.8 50.9 48.6 72.7 58.0
Information channels in the work place
Banners. posters. advertisement boards
on drug abuse
72.9 81.0 84.5 82.3 89.3 82.7 87.5 76.3
Information and socialization on drugs 71.9 58.1 38.2 40.6 35.7 48.9 68.8 63.0
Internal order. guidelines or sanctions on
drug abuse
63.5 56.9 34.0 33.3 32.1 51.1 50.0 72.5
Counseling for drug prevention and
handling of drugs
30.2 25.2 11.1 11.0 14.3 14.4 18.8 22.3
A similar information is acquired from the qualitative study
that many informants are still unknown of the activities done in
relation with P4GN activities. As was informed by a group of drivers
who admitted they never knew of any activities/program on P4GN
from any agency including the owner of the company.
53Journal of Data on the Prevention and Eradication of Drug Abuse and Illicit Trafficking (P4GN)
Year 2013 Edition 2014
Likewise the informationacquired by stakeholders in the
province stating that there are not many P4GN activities for workers
in the transportation sector in his region. Even P4GN activities in
their own environment are minimum. “There are no special activities
(on P4GN)” (Manager for Sea and Air matters. Transportation Office,
Banten). The reasons put forward because there are no guidelines
from their superior or no budget available or they are not interested
because it is not their problem or they are not profitable for the
company.
Some of the informants of the survey evaluate that the
activities as well as the handling of drugs have not achieved the
maximum result. as not all apparatus are involved and sanction for
traffickers and drug abusers are controversial. Likewise the number
of law enforcement is not proportional with the total population and
drug traffickers for the control of drug circulation.
b) Information of P4GN
The most information source mentioned by respondents on
the prevention and eradication of drug abuse are television, printing
media (newspaper, and magazine), and other printing media like
posters, billboards, banners and brochures (90.3%; 60.4%; and
49.3%). Only a few respondents (13.4%) mentioned their company
as the source of information on P4GN. Likewise only 10.3% of
respondents mentioned BNNP/BNNK. The agency directly involved
with the transportation mode, Office of Transportation, wa only
mentioned by 5.0% respondents.
There is no distinct difference in percentage between drug
users and non-drug users when asked about P4GN source of
information. Likewise in the percentage among respondents in each
transportation mode. It is much regretted that only a very few
respondents mentioned their workplace, BNNP/BNNK and Office of
Transportation as the source of P4GN information.
54Journal of Data on the Prevention and Eradication of Drug Abuse and Illicit Trafficking (P4GN)
Year 2013 Edition 2014
Table 77. Distribution of Respondents Who Have Ever Received P4GN
Information From The Transportation Mode Source of
Information
VARIABLE
SEA LAND ASDP RAILWAYS
DU NDU DU NDU DU NDU DU NDU
N
Source of information, types
of drugs and dangers of drug
abuse
Television 92,4 93,1 92,2 90,1 90,9 88,8 100,0 94,0
Radio 40,7 39,4 37,1 31,3 23,6 28,0 59,1 40,9
Printing Media 69,0 61,0 61,2 57,3 54,5 58,4 72,7 72,8
Posters/billboard/banner/
brochures
55,9 47,3 52,8 46,7 50,9 34,3 54,5 59,6
Sticker/pamphlet/Handouts 42,1 31,7 28,4 24,2 23,6 21,3 45,5 38,2
Friends in the workplace 29,7 22,4 21,2 15,2 18,2 12,9 40,9 24,2
Friends outside the
workplace
26,9 16,6 18,3 12,3 18,2 10,5 40,9 21,7
Relative/ family member 29,0 20,1 14,6 9,7 16,4 8,7 36,4 27,5
Religious Leader 35,2 25,7 19,5 14,3 16,4 12,9 54,5 32,7
Company in the workpace 27,6 20,6 9,1 8,1 9,1 15,4 22,7 33,0
BNN/BNNP/BNNK 25,5 16,2 9,7 6,1 5,5 7,3 36,4 19,8
Police 26,9 21,3 19,4 13,7 7,3 9,4 36,4 29,1
Hospoital 26,9 17,7 12,6 7,8 9,1 7,7 31,8 29,1
Community Health Center 17,9 12,5 9,6 5,8 5,5 5,2 31,8 19,8
Ministry of
Transportation/Office of
Transporttation
11,7 8,3 2,6 2,4 5,5 3,5 27,3 10,2
NGO 9,0 7,1 3,0 2,4 3,6 2,8 13,6 9,6
Others 2,1 1,3 1,6 1,1 1,8 2,4 0,0 2,2
c) Involvement in P4GN Activities.
The survey also questioned respondent’s involvement in P4GN.
7.2% admitted being directly involved in the P4GN activities.
The P4GN Program hopes that the more people become
directly involved in P4GN activities, particularly become cadres or a
task force in their respective workplace. The survey indicates that
this expectation has not yet been fulfilled. Respondentsonly
attended lectures/information, discussion/interactive dialogue, drug
simulation, films/entertainment, trainings for cadres of a drug task
force, and members of a drug task force. The most attended by
respondents among these activities are information, and being
involved in discussions/dialogues (9.7% and 3.1%).
55Journal of Data on the Prevention and Eradication of Drug Abuse and Illicit Trafficking (P4GN)
Year 2013 Edition 2014
Table 78. Distribution of Involvement in P4GN Programs Based on the
Source of Information In the Transportation Mode.
VARIABLE
SEA LAND ASDP RAILWAYS
P BP P BP P BP P BP
N =all 145 751 1534 6094 55 286 22 364
Involved in P4GN 21.4 20.1 10.2 7.4 16.4 12.6 40.9 18.7
N respondents involved 31 151 157 452 9 36 9 68
Information source
Lectures/Information 74.2 82.8 79.0 86.3 77.8 91.7 66.7 76.5
Discussion/interactive
dialogue
22.6 23.8 23.6 20.6 11.1 8.3 11.1 20.6
Drug simulation 19.4 21.2 12.7 11.5 11.1 2.8 0.0 11.8
Films/entertainment 32.3 19.9 15.9 12.4 11.1 16.7 44.4 36.8
Training for cadres of drug
task force
19.4 8.6 5.7 4.6 0.0 8.3 22.2 5.9
Drug Task force 9.7 4.0 3.2 1.8 0.0 2.8 0.0 2.9
Others 0.0 2.0 0.0 2.2 11.1 2.8 11.1 4.4
One interesting example of drug prevention activities
combined with land greening/reforestation was conducted by a
company in East Java. This activity may be an example for companies
or government agencies in implementing P4GN activities.
“... As I was never involved, but was told by friends. Usually
there are campaigns. I once heard, but I was not involved, in
connection with the International Anti Drug Day, there was a
program in mangrove planting” (Manager, East Java Shipping
Company).
Another interesting example is the collaboration between
BNNP and a company in the prevention of drugs by printing 5,000
stickers to be placed on buses and other strategic places to be read
by many people.
“From us only support what is been planned by government
and the relationship shape we distributed by making stickers
that there is an obligation on the stickers regarding to
suggestion such as do not use drugs more less during 2
years...,” (Indept Interview of PO Sulsel Bus Manajer).
56Journal of Data on the Prevention and Eradication of Drug Abuse and Illicit Trafficking (P4GN)
Year 2013 Edition 2014
“We don’t have organization so we just an ordinary company.
Nevertheless we support government in this case National
Narcotic Board (BNN) by distributing stickers that socialized the
risk of the drugs use and they distributed everywhere, thati is
our support.
“Yes supporting means our shape kepedulian to government in
this case BNN in giving information to society about the risk of
drugs use. This is just a support by giving and making the
stickers and it is enough great amount sir if I am not mistaken
it is 5000 pieces and that is just from PO.liman its self and give
them to the BNN for distributing to society and sticking on the
our buses and or other public places..,“ (Indept Interview of PO
Sulsel Bus Manager).
The survey did not find special regulations that manage drug
abuse in the company, except in the airline companies. These
regulations are usually included in the work order, or in the
employee’s pocket book. Airline companies employ this regulation
on the basis of international statutes. Regulations on drug abuse are
seldom found within the companies as this is not regarded as a
crucial problem.
Companies and government agencies do not execute P4GN
activities as it is not their duty, since they do not obtain any profit in
doing these activites. Moreover, no funds available, not yet thought
about, no guidelines, or waiting for guidelines from the
management.
9) Quality of Life Related to Work.
This study distinguishes the group of non-drug use, ever-used
(lifetime), and past year use (current users). In the group of non-drug use
the average total score of the quality of liferelated to their work is more
than 80 in all sectors. The highest score is found in the sector of sea
transportation, while the lowest in the land transportation. Likewise in the
group of ever used (lifetime) that shows more or less the same indication.
In the group of current users (past year use) in the sector of railways, this
phenomenon is somewhat highest compared to lifetime use, namely
84:85. However, overall, among the three groups current users (past year
use) have relatively a lower quality of life related to their work compared
to lifetime and non-drug use.
Jurnal Data P4GN 2013 - Edisi 2014 - EN

Mais conteúdo relacionado

Semelhante a Jurnal Data P4GN 2013 - Edisi 2014 - EN

An Assignment On HIV AIDS
An Assignment On HIV AIDSAn Assignment On HIV AIDS
An Assignment On HIV AIDSWendy Berg
 
UNODC Adolescent Risk Behaviour Survey
UNODC Adolescent Risk Behaviour SurveyUNODC Adolescent Risk Behaviour Survey
UNODC Adolescent Risk Behaviour SurveySarah Bliss
 
H71310ANguyenThienLan
H71310ANguyenThienLanH71310ANguyenThienLan
H71310ANguyenThienLanLan Thien
 
Interesting things about alcohol and other drugs - Sept 2016
Interesting things about alcohol and other drugs - Sept 2016Interesting things about alcohol and other drugs - Sept 2016
Interesting things about alcohol and other drugs - Sept 2016Andrew Brown
 
THE EFFECTS OF DRUG ABUSE ON YOUTHS__ama.pptx
THE EFFECTS OF DRUG ABUSE ON YOUTHS__ama.pptxTHE EFFECTS OF DRUG ABUSE ON YOUTHS__ama.pptx
THE EFFECTS OF DRUG ABUSE ON YOUTHS__ama.pptxKelechiChukwuemeka
 
Drug trafficking impact on security in Afghanistan
Drug trafficking impact on security in Afghanistan Drug trafficking impact on security in Afghanistan
Drug trafficking impact on security in Afghanistan Christopher Pauli-Garcia
 
Evaluation of NDLEA Radio Campaign Influence on Drug Abuse among Youths in On...
Evaluation of NDLEA Radio Campaign Influence on Drug Abuse among Youths in On...Evaluation of NDLEA Radio Campaign Influence on Drug Abuse among Youths in On...
Evaluation of NDLEA Radio Campaign Influence on Drug Abuse among Youths in On...inventionjournals
 
Interesting things about alcohol and other drugs: October 2015 - slides
Interesting things about alcohol and other drugs: October 2015 - slidesInteresting things about alcohol and other drugs: October 2015 - slides
Interesting things about alcohol and other drugs: October 2015 - slidesAndrew Brown
 
IMPACT OF REHABILITATION RIGHT’S NEGLIGENCE FOR PEOPLE WHO USE DRUGS DURING T...
IMPACT OF REHABILITATION RIGHT’S NEGLIGENCE FOR PEOPLE WHO USE DRUGS DURING T...IMPACT OF REHABILITATION RIGHT’S NEGLIGENCE FOR PEOPLE WHO USE DRUGS DURING T...
IMPACT OF REHABILITATION RIGHT’S NEGLIGENCE FOR PEOPLE WHO USE DRUGS DURING T...Ardhany Rc
 
Substance use in india
Substance use in indiaSubstance use in india
Substance use in indiaSumity Arora
 
Bouncing Back Relapse in the Golden Triangle-English version
Bouncing Back  Relapse in the Golden Triangle-English versionBouncing Back  Relapse in the Golden Triangle-English version
Bouncing Back Relapse in the Golden Triangle-English versionMYO AUNG Myanmar
 
UNODC Drugs and HIV:AIDS Country Programme 2008
UNODC Drugs and HIV:AIDS Country Programme 2008UNODC Drugs and HIV:AIDS Country Programme 2008
UNODC Drugs and HIV:AIDS Country Programme 2008Giorgi Pkhakadze
 
Drug trafficking and abuse in mauritius
Drug trafficking and abuse in mauritiusDrug trafficking and abuse in mauritius
Drug trafficking and abuse in mauritiusVivian Jaque Martinez
 
Socio demographic variables and personality profiles of patients with substan...
Socio demographic variables and personality profiles of patients with substan...Socio demographic variables and personality profiles of patients with substan...
Socio demographic variables and personality profiles of patients with substan...Alexander Decker
 
Knowledge on use_and_effects_of_drug_and_substance
Knowledge on use_and_effects_of_drug_and_substanceKnowledge on use_and_effects_of_drug_and_substance
Knowledge on use_and_effects_of_drug_and_substanceEmmyKoech
 

Semelhante a Jurnal Data P4GN 2013 - Edisi 2014 - EN (20)

An Assignment On HIV AIDS
An Assignment On HIV AIDSAn Assignment On HIV AIDS
An Assignment On HIV AIDS
 
Drug Trafficking:SSB 54
Drug Trafficking:SSB 54Drug Trafficking:SSB 54
Drug Trafficking:SSB 54
 
UNODC Adolescent Risk Behaviour Survey
UNODC Adolescent Risk Behaviour SurveyUNODC Adolescent Risk Behaviour Survey
UNODC Adolescent Risk Behaviour Survey
 
H71310ANguyenThienLan
H71310ANguyenThienLanH71310ANguyenThienLan
H71310ANguyenThienLan
 
Interesting things about alcohol and other drugs - Sept 2016
Interesting things about alcohol and other drugs - Sept 2016Interesting things about alcohol and other drugs - Sept 2016
Interesting things about alcohol and other drugs - Sept 2016
 
THE EFFECTS OF DRUG ABUSE ON YOUTHS__ama.pptx
THE EFFECTS OF DRUG ABUSE ON YOUTHS__ama.pptxTHE EFFECTS OF DRUG ABUSE ON YOUTHS__ama.pptx
THE EFFECTS OF DRUG ABUSE ON YOUTHS__ama.pptx
 
Drug trafficking impact on security in Afghanistan
Drug trafficking impact on security in Afghanistan Drug trafficking impact on security in Afghanistan
Drug trafficking impact on security in Afghanistan
 
Evaluation of NDLEA Radio Campaign Influence on Drug Abuse among Youths in On...
Evaluation of NDLEA Radio Campaign Influence on Drug Abuse among Youths in On...Evaluation of NDLEA Radio Campaign Influence on Drug Abuse among Youths in On...
Evaluation of NDLEA Radio Campaign Influence on Drug Abuse among Youths in On...
 
Interesting things about alcohol and other drugs: October 2015 - slides
Interesting things about alcohol and other drugs: October 2015 - slidesInteresting things about alcohol and other drugs: October 2015 - slides
Interesting things about alcohol and other drugs: October 2015 - slides
 
Proposal asim
Proposal asimProposal asim
Proposal asim
 
IMPACT OF REHABILITATION RIGHT’S NEGLIGENCE FOR PEOPLE WHO USE DRUGS DURING T...
IMPACT OF REHABILITATION RIGHT’S NEGLIGENCE FOR PEOPLE WHO USE DRUGS DURING T...IMPACT OF REHABILITATION RIGHT’S NEGLIGENCE FOR PEOPLE WHO USE DRUGS DURING T...
IMPACT OF REHABILITATION RIGHT’S NEGLIGENCE FOR PEOPLE WHO USE DRUGS DURING T...
 
Substance use in india
Substance use in indiaSubstance use in india
Substance use in india
 
Drug Abuse and Drug Trafficking
Drug Abuse and Drug TraffickingDrug Abuse and Drug Trafficking
Drug Abuse and Drug Trafficking
 
Bouncing Back Relapse in the Golden Triangle-English version
Bouncing Back  Relapse in the Golden Triangle-English versionBouncing Back  Relapse in the Golden Triangle-English version
Bouncing Back Relapse in the Golden Triangle-English version
 
Ndews scs-methamphetamine-report-september-2018-final
Ndews scs-methamphetamine-report-september-2018-finalNdews scs-methamphetamine-report-september-2018-final
Ndews scs-methamphetamine-report-september-2018-final
 
UNODC Drugs and HIV:AIDS Country Programme 2008
UNODC Drugs and HIV:AIDS Country Programme 2008UNODC Drugs and HIV:AIDS Country Programme 2008
UNODC Drugs and HIV:AIDS Country Programme 2008
 
Drug trafficking and abuse in mauritius
Drug trafficking and abuse in mauritiusDrug trafficking and abuse in mauritius
Drug trafficking and abuse in mauritius
 
Socio demographic variables and personality profiles of patients with substan...
Socio demographic variables and personality profiles of patients with substan...Socio demographic variables and personality profiles of patients with substan...
Socio demographic variables and personality profiles of patients with substan...
 
Knowledge on use_and_effects_of_drug_and_substance
Knowledge on use_and_effects_of_drug_and_substanceKnowledge on use_and_effects_of_drug_and_substance
Knowledge on use_and_effects_of_drug_and_substance
 
regional substance use
regional substance useregional substance use
regional substance use
 

Mais de AntiNarkoba.com

Hasil survei penyalahgunaan dan peredaran gelap narkoba pada kelompok pelajar...
Hasil survei penyalahgunaan dan peredaran gelap narkoba pada kelompok pelajar...Hasil survei penyalahgunaan dan peredaran gelap narkoba pada kelompok pelajar...
Hasil survei penyalahgunaan dan peredaran gelap narkoba pada kelompok pelajar...AntiNarkoba.com
 
Heal th 2019 research on drugs abuse 2
Heal th 2019 research on drugs abuse 2Heal th 2019 research on drugs abuse 2
Heal th 2019 research on drugs abuse 2AntiNarkoba.com
 
Potensi desa dalam pencegahan penyalahgunaan narkoba 2019 (bnn bkkbn) 2
Potensi desa dalam pencegahan penyalahgunaan narkoba 2019 (bnn   bkkbn) 2Potensi desa dalam pencegahan penyalahgunaan narkoba 2019 (bnn   bkkbn) 2
Potensi desa dalam pencegahan penyalahgunaan narkoba 2019 (bnn bkkbn) 2AntiNarkoba.com
 
Survei prevalensi penyalahgunaan narkoba 2019 ( bnn lipi ) 2
Survei prevalensi penyalahgunaan narkoba 2019 ( bnn   lipi ) 2Survei prevalensi penyalahgunaan narkoba 2019 ( bnn   lipi ) 2
Survei prevalensi penyalahgunaan narkoba 2019 ( bnn lipi ) 2AntiNarkoba.com
 
Potret efektifitas rehabilitasi penyalahgunaan narkotika di lembaga permasyar...
Potret efektifitas rehabilitasi penyalahgunaan narkotika di lembaga permasyar...Potret efektifitas rehabilitasi penyalahgunaan narkotika di lembaga permasyar...
Potret efektifitas rehabilitasi penyalahgunaan narkotika di lembaga permasyar...AntiNarkoba.com
 
Village potential in drug abuse prevention 2019 2
Village potential in drug abuse prevention 2019 2Village potential in drug abuse prevention 2019 2
Village potential in drug abuse prevention 2019 2AntiNarkoba.com
 
Health 2019 research on drugs abuse 2
Health 2019 research on drugs abuse 2Health 2019 research on drugs abuse 2
Health 2019 research on drugs abuse 2AntiNarkoba.com
 
Potrait of drug abuse rehabilitation effectiveness in correctional facility 2...
Potrait of drug abuse rehabilitation effectiveness in correctional facility 2...Potrait of drug abuse rehabilitation effectiveness in correctional facility 2...
Potrait of drug abuse rehabilitation effectiveness in correctional facility 2...AntiNarkoba.com
 
Survei prevalensi penyalahgunaan narkoba 2019 ( bnn lipi ) 2
Survei prevalensi penyalahgunaan narkoba 2019 ( bnn   lipi ) 2Survei prevalensi penyalahgunaan narkoba 2019 ( bnn   lipi ) 2
Survei prevalensi penyalahgunaan narkoba 2019 ( bnn lipi ) 2AntiNarkoba.com
 
Village potential in drug abuse prevention 2019 2
Village potential in drug abuse prevention 2019 2Village potential in drug abuse prevention 2019 2
Village potential in drug abuse prevention 2019 2AntiNarkoba.com
 
Jurnal Data P4GN 2012 - Edisi 2013 - EN
Jurnal Data P4GN 2012 - Edisi 2013 - ENJurnal Data P4GN 2012 - Edisi 2013 - EN
Jurnal Data P4GN 2012 - Edisi 2013 - ENAntiNarkoba.com
 
Buku Petunjuk Teknis Pelaksanaan Kewirausahaan Pada Kawasan Rawan Narkoba
Buku Petunjuk Teknis Pelaksanaan Kewirausahaan Pada Kawasan Rawan NarkobaBuku Petunjuk Teknis Pelaksanaan Kewirausahaan Pada Kawasan Rawan Narkoba
Buku Petunjuk Teknis Pelaksanaan Kewirausahaan Pada Kawasan Rawan NarkobaAntiNarkoba.com
 
Buku Awas Narkoba Masuk Desa 2018
Buku Awas Narkoba Masuk Desa 2018Buku Awas Narkoba Masuk Desa 2018
Buku Awas Narkoba Masuk Desa 2018AntiNarkoba.com
 
Buku Pencegahan Narkoba Sejak Usia Dini
Buku Pencegahan Narkoba Sejak Usia DiniBuku Pencegahan Narkoba Sejak Usia Dini
Buku Pencegahan Narkoba Sejak Usia DiniAntiNarkoba.com
 
Buku Raih Prestasi Tanpa Narkoba
Buku Raih Prestasi Tanpa NarkobaBuku Raih Prestasi Tanpa Narkoba
Buku Raih Prestasi Tanpa NarkobaAntiNarkoba.com
 
Riset Kesehatan Dampak Penyalahgunaan Narkoba 2019
Riset Kesehatan Dampak Penyalahgunaan Narkoba 2019Riset Kesehatan Dampak Penyalahgunaan Narkoba 2019
Riset Kesehatan Dampak Penyalahgunaan Narkoba 2019AntiNarkoba.com
 
Pencegahan Bahaya Narkoba Di Lingkungan SMP Dan SMA
Pencegahan Bahaya Narkoba Di Lingkungan SMP Dan SMAPencegahan Bahaya Narkoba Di Lingkungan SMP Dan SMA
Pencegahan Bahaya Narkoba Di Lingkungan SMP Dan SMAAntiNarkoba.com
 
Buku Kita Butuh Bicara Hubungan Orang Tua Dan Anak
Buku Kita Butuh Bicara Hubungan Orang Tua Dan AnakBuku Kita Butuh Bicara Hubungan Orang Tua Dan Anak
Buku Kita Butuh Bicara Hubungan Orang Tua Dan AnakAntiNarkoba.com
 
Petunjuk Teknis Pelaksanaan Desa Bersih Narkoba
Petunjuk Teknis Pelaksanaan Desa Bersih NarkobaPetunjuk Teknis Pelaksanaan Desa Bersih Narkoba
Petunjuk Teknis Pelaksanaan Desa Bersih NarkobaAntiNarkoba.com
 
Buku Reflection Seni Berbicara Dengan Diri Sendiri
Buku Reflection Seni Berbicara Dengan Diri SendiriBuku Reflection Seni Berbicara Dengan Diri Sendiri
Buku Reflection Seni Berbicara Dengan Diri SendiriAntiNarkoba.com
 

Mais de AntiNarkoba.com (20)

Hasil survei penyalahgunaan dan peredaran gelap narkoba pada kelompok pelajar...
Hasil survei penyalahgunaan dan peredaran gelap narkoba pada kelompok pelajar...Hasil survei penyalahgunaan dan peredaran gelap narkoba pada kelompok pelajar...
Hasil survei penyalahgunaan dan peredaran gelap narkoba pada kelompok pelajar...
 
Heal th 2019 research on drugs abuse 2
Heal th 2019 research on drugs abuse 2Heal th 2019 research on drugs abuse 2
Heal th 2019 research on drugs abuse 2
 
Potensi desa dalam pencegahan penyalahgunaan narkoba 2019 (bnn bkkbn) 2
Potensi desa dalam pencegahan penyalahgunaan narkoba 2019 (bnn   bkkbn) 2Potensi desa dalam pencegahan penyalahgunaan narkoba 2019 (bnn   bkkbn) 2
Potensi desa dalam pencegahan penyalahgunaan narkoba 2019 (bnn bkkbn) 2
 
Survei prevalensi penyalahgunaan narkoba 2019 ( bnn lipi ) 2
Survei prevalensi penyalahgunaan narkoba 2019 ( bnn   lipi ) 2Survei prevalensi penyalahgunaan narkoba 2019 ( bnn   lipi ) 2
Survei prevalensi penyalahgunaan narkoba 2019 ( bnn lipi ) 2
 
Potret efektifitas rehabilitasi penyalahgunaan narkotika di lembaga permasyar...
Potret efektifitas rehabilitasi penyalahgunaan narkotika di lembaga permasyar...Potret efektifitas rehabilitasi penyalahgunaan narkotika di lembaga permasyar...
Potret efektifitas rehabilitasi penyalahgunaan narkotika di lembaga permasyar...
 
Village potential in drug abuse prevention 2019 2
Village potential in drug abuse prevention 2019 2Village potential in drug abuse prevention 2019 2
Village potential in drug abuse prevention 2019 2
 
Health 2019 research on drugs abuse 2
Health 2019 research on drugs abuse 2Health 2019 research on drugs abuse 2
Health 2019 research on drugs abuse 2
 
Potrait of drug abuse rehabilitation effectiveness in correctional facility 2...
Potrait of drug abuse rehabilitation effectiveness in correctional facility 2...Potrait of drug abuse rehabilitation effectiveness in correctional facility 2...
Potrait of drug abuse rehabilitation effectiveness in correctional facility 2...
 
Survei prevalensi penyalahgunaan narkoba 2019 ( bnn lipi ) 2
Survei prevalensi penyalahgunaan narkoba 2019 ( bnn   lipi ) 2Survei prevalensi penyalahgunaan narkoba 2019 ( bnn   lipi ) 2
Survei prevalensi penyalahgunaan narkoba 2019 ( bnn lipi ) 2
 
Village potential in drug abuse prevention 2019 2
Village potential in drug abuse prevention 2019 2Village potential in drug abuse prevention 2019 2
Village potential in drug abuse prevention 2019 2
 
Jurnal Data P4GN 2012 - Edisi 2013 - EN
Jurnal Data P4GN 2012 - Edisi 2013 - ENJurnal Data P4GN 2012 - Edisi 2013 - EN
Jurnal Data P4GN 2012 - Edisi 2013 - EN
 
Buku Petunjuk Teknis Pelaksanaan Kewirausahaan Pada Kawasan Rawan Narkoba
Buku Petunjuk Teknis Pelaksanaan Kewirausahaan Pada Kawasan Rawan NarkobaBuku Petunjuk Teknis Pelaksanaan Kewirausahaan Pada Kawasan Rawan Narkoba
Buku Petunjuk Teknis Pelaksanaan Kewirausahaan Pada Kawasan Rawan Narkoba
 
Buku Awas Narkoba Masuk Desa 2018
Buku Awas Narkoba Masuk Desa 2018Buku Awas Narkoba Masuk Desa 2018
Buku Awas Narkoba Masuk Desa 2018
 
Buku Pencegahan Narkoba Sejak Usia Dini
Buku Pencegahan Narkoba Sejak Usia DiniBuku Pencegahan Narkoba Sejak Usia Dini
Buku Pencegahan Narkoba Sejak Usia Dini
 
Buku Raih Prestasi Tanpa Narkoba
Buku Raih Prestasi Tanpa NarkobaBuku Raih Prestasi Tanpa Narkoba
Buku Raih Prestasi Tanpa Narkoba
 
Riset Kesehatan Dampak Penyalahgunaan Narkoba 2019
Riset Kesehatan Dampak Penyalahgunaan Narkoba 2019Riset Kesehatan Dampak Penyalahgunaan Narkoba 2019
Riset Kesehatan Dampak Penyalahgunaan Narkoba 2019
 
Pencegahan Bahaya Narkoba Di Lingkungan SMP Dan SMA
Pencegahan Bahaya Narkoba Di Lingkungan SMP Dan SMAPencegahan Bahaya Narkoba Di Lingkungan SMP Dan SMA
Pencegahan Bahaya Narkoba Di Lingkungan SMP Dan SMA
 
Buku Kita Butuh Bicara Hubungan Orang Tua Dan Anak
Buku Kita Butuh Bicara Hubungan Orang Tua Dan AnakBuku Kita Butuh Bicara Hubungan Orang Tua Dan Anak
Buku Kita Butuh Bicara Hubungan Orang Tua Dan Anak
 
Petunjuk Teknis Pelaksanaan Desa Bersih Narkoba
Petunjuk Teknis Pelaksanaan Desa Bersih NarkobaPetunjuk Teknis Pelaksanaan Desa Bersih Narkoba
Petunjuk Teknis Pelaksanaan Desa Bersih Narkoba
 
Buku Reflection Seni Berbicara Dengan Diri Sendiri
Buku Reflection Seni Berbicara Dengan Diri SendiriBuku Reflection Seni Berbicara Dengan Diri Sendiri
Buku Reflection Seni Berbicara Dengan Diri Sendiri
 

Último

FSB Advising Checklist - Orientation 2024
FSB Advising Checklist - Orientation 2024FSB Advising Checklist - Orientation 2024
FSB Advising Checklist - Orientation 2024Elizabeth Walsh
 
ICT role in 21st century education and it's challenges.
ICT role in 21st century education and it's challenges.ICT role in 21st century education and it's challenges.
ICT role in 21st century education and it's challenges.MaryamAhmad92
 
Food safety_Challenges food safety laboratories_.pdf
Food safety_Challenges food safety laboratories_.pdfFood safety_Challenges food safety laboratories_.pdf
Food safety_Challenges food safety laboratories_.pdfSherif Taha
 
Python Notes for mca i year students osmania university.docx
Python Notes for mca i year students osmania university.docxPython Notes for mca i year students osmania university.docx
Python Notes for mca i year students osmania university.docxRamakrishna Reddy Bijjam
 
ComPTIA Overview | Comptia Security+ Book SY0-701
ComPTIA Overview | Comptia Security+ Book SY0-701ComPTIA Overview | Comptia Security+ Book SY0-701
ComPTIA Overview | Comptia Security+ Book SY0-701bronxfugly43
 
1029 - Danh muc Sach Giao Khoa 10 . pdf
1029 -  Danh muc Sach Giao Khoa 10 . pdf1029 -  Danh muc Sach Giao Khoa 10 . pdf
1029 - Danh muc Sach Giao Khoa 10 . pdfQucHHunhnh
 
Activity 01 - Artificial Culture (1).pdf
Activity 01 - Artificial Culture (1).pdfActivity 01 - Artificial Culture (1).pdf
Activity 01 - Artificial Culture (1).pdfciinovamais
 
Unit-IV; Professional Sales Representative (PSR).pptx
Unit-IV; Professional Sales Representative (PSR).pptxUnit-IV; Professional Sales Representative (PSR).pptx
Unit-IV; Professional Sales Representative (PSR).pptxVishalSingh1417
 
Dyslexia AI Workshop for Slideshare.pptx
Dyslexia AI Workshop for Slideshare.pptxDyslexia AI Workshop for Slideshare.pptx
Dyslexia AI Workshop for Slideshare.pptxcallscotland1987
 
Kodo Millet PPT made by Ghanshyam bairwa college of Agriculture kumher bhara...
Kodo Millet  PPT made by Ghanshyam bairwa college of Agriculture kumher bhara...Kodo Millet  PPT made by Ghanshyam bairwa college of Agriculture kumher bhara...
Kodo Millet PPT made by Ghanshyam bairwa college of Agriculture kumher bhara...pradhanghanshyam7136
 
Graduate Outcomes Presentation Slides - English
Graduate Outcomes Presentation Slides - EnglishGraduate Outcomes Presentation Slides - English
Graduate Outcomes Presentation Slides - Englishneillewis46
 
How to Create and Manage Wizard in Odoo 17
How to Create and Manage Wizard in Odoo 17How to Create and Manage Wizard in Odoo 17
How to Create and Manage Wizard in Odoo 17Celine George
 
Key note speaker Neum_Admir Softic_ENG.pdf
Key note speaker Neum_Admir Softic_ENG.pdfKey note speaker Neum_Admir Softic_ENG.pdf
Key note speaker Neum_Admir Softic_ENG.pdfAdmir Softic
 
HMCS Max Bernays Pre-Deployment Brief (May 2024).pptx
HMCS Max Bernays Pre-Deployment Brief (May 2024).pptxHMCS Max Bernays Pre-Deployment Brief (May 2024).pptx
HMCS Max Bernays Pre-Deployment Brief (May 2024).pptxEsquimalt MFRC
 
Micro-Scholarship, What it is, How can it help me.pdf
Micro-Scholarship, What it is, How can it help me.pdfMicro-Scholarship, What it is, How can it help me.pdf
Micro-Scholarship, What it is, How can it help me.pdfPoh-Sun Goh
 
Towards a code of practice for AI in AT.pptx
Towards a code of practice for AI in AT.pptxTowards a code of practice for AI in AT.pptx
Towards a code of practice for AI in AT.pptxJisc
 
The basics of sentences session 3pptx.pptx
The basics of sentences session 3pptx.pptxThe basics of sentences session 3pptx.pptx
The basics of sentences session 3pptx.pptxheathfieldcps1
 
Salient Features of India constitution especially power and functions
Salient Features of India constitution especially power and functionsSalient Features of India constitution especially power and functions
Salient Features of India constitution especially power and functionsKarakKing
 
Vishram Singh - Textbook of Anatomy Upper Limb and Thorax.. Volume 1 (1).pdf
Vishram Singh - Textbook of Anatomy  Upper Limb and Thorax.. Volume 1 (1).pdfVishram Singh - Textbook of Anatomy  Upper Limb and Thorax.. Volume 1 (1).pdf
Vishram Singh - Textbook of Anatomy Upper Limb and Thorax.. Volume 1 (1).pdfssuserdda66b
 
Introduction to Nonprofit Accounting: The Basics
Introduction to Nonprofit Accounting: The BasicsIntroduction to Nonprofit Accounting: The Basics
Introduction to Nonprofit Accounting: The BasicsTechSoup
 

Último (20)

FSB Advising Checklist - Orientation 2024
FSB Advising Checklist - Orientation 2024FSB Advising Checklist - Orientation 2024
FSB Advising Checklist - Orientation 2024
 
ICT role in 21st century education and it's challenges.
ICT role in 21st century education and it's challenges.ICT role in 21st century education and it's challenges.
ICT role in 21st century education and it's challenges.
 
Food safety_Challenges food safety laboratories_.pdf
Food safety_Challenges food safety laboratories_.pdfFood safety_Challenges food safety laboratories_.pdf
Food safety_Challenges food safety laboratories_.pdf
 
Python Notes for mca i year students osmania university.docx
Python Notes for mca i year students osmania university.docxPython Notes for mca i year students osmania university.docx
Python Notes for mca i year students osmania university.docx
 
ComPTIA Overview | Comptia Security+ Book SY0-701
ComPTIA Overview | Comptia Security+ Book SY0-701ComPTIA Overview | Comptia Security+ Book SY0-701
ComPTIA Overview | Comptia Security+ Book SY0-701
 
1029 - Danh muc Sach Giao Khoa 10 . pdf
1029 -  Danh muc Sach Giao Khoa 10 . pdf1029 -  Danh muc Sach Giao Khoa 10 . pdf
1029 - Danh muc Sach Giao Khoa 10 . pdf
 
Activity 01 - Artificial Culture (1).pdf
Activity 01 - Artificial Culture (1).pdfActivity 01 - Artificial Culture (1).pdf
Activity 01 - Artificial Culture (1).pdf
 
Unit-IV; Professional Sales Representative (PSR).pptx
Unit-IV; Professional Sales Representative (PSR).pptxUnit-IV; Professional Sales Representative (PSR).pptx
Unit-IV; Professional Sales Representative (PSR).pptx
 
Dyslexia AI Workshop for Slideshare.pptx
Dyslexia AI Workshop for Slideshare.pptxDyslexia AI Workshop for Slideshare.pptx
Dyslexia AI Workshop for Slideshare.pptx
 
Kodo Millet PPT made by Ghanshyam bairwa college of Agriculture kumher bhara...
Kodo Millet  PPT made by Ghanshyam bairwa college of Agriculture kumher bhara...Kodo Millet  PPT made by Ghanshyam bairwa college of Agriculture kumher bhara...
Kodo Millet PPT made by Ghanshyam bairwa college of Agriculture kumher bhara...
 
Graduate Outcomes Presentation Slides - English
Graduate Outcomes Presentation Slides - EnglishGraduate Outcomes Presentation Slides - English
Graduate Outcomes Presentation Slides - English
 
How to Create and Manage Wizard in Odoo 17
How to Create and Manage Wizard in Odoo 17How to Create and Manage Wizard in Odoo 17
How to Create and Manage Wizard in Odoo 17
 
Key note speaker Neum_Admir Softic_ENG.pdf
Key note speaker Neum_Admir Softic_ENG.pdfKey note speaker Neum_Admir Softic_ENG.pdf
Key note speaker Neum_Admir Softic_ENG.pdf
 
HMCS Max Bernays Pre-Deployment Brief (May 2024).pptx
HMCS Max Bernays Pre-Deployment Brief (May 2024).pptxHMCS Max Bernays Pre-Deployment Brief (May 2024).pptx
HMCS Max Bernays Pre-Deployment Brief (May 2024).pptx
 
Micro-Scholarship, What it is, How can it help me.pdf
Micro-Scholarship, What it is, How can it help me.pdfMicro-Scholarship, What it is, How can it help me.pdf
Micro-Scholarship, What it is, How can it help me.pdf
 
Towards a code of practice for AI in AT.pptx
Towards a code of practice for AI in AT.pptxTowards a code of practice for AI in AT.pptx
Towards a code of practice for AI in AT.pptx
 
The basics of sentences session 3pptx.pptx
The basics of sentences session 3pptx.pptxThe basics of sentences session 3pptx.pptx
The basics of sentences session 3pptx.pptx
 
Salient Features of India constitution especially power and functions
Salient Features of India constitution especially power and functionsSalient Features of India constitution especially power and functions
Salient Features of India constitution especially power and functions
 
Vishram Singh - Textbook of Anatomy Upper Limb and Thorax.. Volume 1 (1).pdf
Vishram Singh - Textbook of Anatomy  Upper Limb and Thorax.. Volume 1 (1).pdfVishram Singh - Textbook of Anatomy  Upper Limb and Thorax.. Volume 1 (1).pdf
Vishram Singh - Textbook of Anatomy Upper Limb and Thorax.. Volume 1 (1).pdf
 
Introduction to Nonprofit Accounting: The Basics
Introduction to Nonprofit Accounting: The BasicsIntroduction to Nonprofit Accounting: The Basics
Introduction to Nonprofit Accounting: The Basics
 

Jurnal Data P4GN 2013 - Edisi 2014 - EN

  • 1. 1Journal of Data on the Prevention and Eradication of Drug Abuse and Illicit Trafficking (P4GN) Year 2013 Edition 2014 CHAPTER I INTRODUCTION 1. Drug Abuse and Illicit Trafficking at Global Level. The 2013 Annual Report issued by United Nations Office on Drugs and Crime (UNODC) stated that in 2011 an estimation of 167 to 315 million people take drugs the minimum of once in a year (equivalent to 3.6-6.9% of the world population between the age of 15-64 years). Among the narcotics, Cannabis (marihuana) is the most consumed drug in the world. The prevalence of abuse ranges from 2.9% - 4.3% per year among the world population between the age of 15-64 years. Legalization of cannabis has been applied in the the following countries: the States of New York and Colorado of the United States, Netherland, Germany (for personal use of 6 grams), Argentine, Cyprus (15 grams), Equador, Mexico (5 grams), Peru (8 grams), Switzerland (4 cigarettes), Belgium (3 grams), Brazil, Uruguay, Paraguay (10 grams), Colombia (20 grams) and Australia. The global abuse of Cocaine is estimated to range from 15%-19.3% yearly (prevalence of 0.3-0.4% per year). Meanwhile, a decrease was seen in the West and Central Europe related to the abuse and trafficking in cocaine, from 1.3% in 2010 to 1.2% in 2011; this decrease also occurred in North America, from 1.6% in 2010 to 1.5% in 2011. The highest prevalence of opiates abuse was reported in the regions of South- West Asia (1,2%), in particular the states of Afghanistan, Iran and Pakistan, Central Asia, South Europe (0.8%), North America (0.5%), and Central Africa (0.4%). Abuse of Amphetamine-Type Stimulants (ATS) including Ecstasy, has made a wide spread and increased all over the world, namely: Oceania (2.9%), North America (0,9%) and Europe (0.7%). Pakistan has become a country of emergency for the prevalence of ATS abuse, covering 0.1% of the total population. An increase is also seen in Oceania (2.1%), Australia, New Zealand, Central America and North America, respectively 1.3%, Africa (0.9%), and Asia (0.7%). UNODC reported that Afghanistan placed the highest rank in the production and cultivation of opium poppy in 2012 (74%). Cultivation of opium poppy increased by 15% in 2012; however, the production of opium in Myanmar decreased by 30%, or the equivalent of 5,000 tons compared to 2012. Meanwhile, Mexico is reported to be the llargest country of opium poppy in the continent of America. Known as the source of illicit trafficking in opium in the world, it is estimated that 93% of the world opium poppy cultivation is found in Afghanistan. Approximately 80% of the Afghanistan opium is smuggled through the countries of Iran and Pakistan to Central Asia.
  • 2. 2Journal of Data on the Prevention and Eradication of Drug Abuse and Illicit Trafficking (P4GN) Year 2013 Edition 2014 Every year an amount of 900 tons opium and 375 tons heroin, equivalent to US$ 65 billion leave Afghanistan to supply + 15 million drug abusers, causing the death of 100,000 people every year. The circulation of opium goes through the Balkan and Eurasia, including through China, India and Russia. 2. Drug Abuse and Illicit Trafficking at Regional Level. Data on drug abuse in the ASEAN Region could not be monitored in detail, but in general it depicts a rising trend in the abuse of ATS, enabling in the increase of illicit trafficking as the market demand rises. There is a significant progress related to drug trafficking in the ASEAN Region, which is marked by the uncovering of a number of drug cases in the respective countries: a. The arrest of an Iranian nationals in Indonesia, Thailand and the Philippines, in the smuggle of a large quantity of Methamphetamines, or known as Shabu b. The disclosure of a new method of cannabis cultivation in Japan (indoor system) by using a large number of pots. c. Disclosure of a group of Vietnamese criminals applying the cloning method in producing the same quality of cannabis plants, which was learned from Vietnamese criminals in Australia. d. Nigerian drug syndicates making use of couriers, mostly local women, remain a serious problem, although many of these syndicates have been uncovered. However, these syndicates frequently change their modus operandi. The worst, their actions may result in criminal acts conducted by local law enforcement apparatus, such as corruption for example. e. As the source of Ketamine production, India sends large quantities of Ketamine to countries in America and Europe, including to ASEAN countries. f. The smuggle of large quantities of cold tablets from South Korea to Thailand. 6 Kg of Pseudo-ephedrine can be extracted from 100,000 tablets, changing the function of this chemical substance to become an ingredient in the manufacture of shabu. g. In 2011 law enforcement agencies in Myanmar have seized 5.9 million methamphetamine tablets, this is an increase of 168% from 2.2 million tablets seized in the previous year. h. 2011 UNODC Asia and the Pacific Regional ATS Report, reports that in 2010 approx. 136 million methamphetamine tablets were seized in the regions of East Asia and South-East Asia. 98% of the total seized tablets were in three countries: China (58.4 million), Thailand (50.4 million), and Laos (24.5 million). A seizure was also made on 6.9 tons crystal methamphetamine in the same regions, and 61% of the total quantity seized was found in China (4.2 tons). Moreover, also in the same regions 1.7 million ecstasy tablets were seized. The largest seizures were made in China and Indonesia (94%).
  • 3. 3Journal of Data on the Prevention and Eradication of Drug Abuse and Illicit Trafficking (P4GN) Year 2013 Edition 2014 i. UNODC Asia and the Pacific Report, Global SMART Update 2012, reported that one-third of the global ATS and half of the global Methamphetamine seized originate from East Asia and South-East Asia regions. Large quantities of illicit ATS are produced in countries that were formerly transit countries for ATS. For example, Cambodia, Indonesia and Malaysia. Meanwhile, South Asia remains the target of organized syndicates for the source of ATS, in particular ephedrine and pseudoephedrine. j. The high market price of narcotics, and the increasing demand make the ASEAN region a target for the smuggle of narcotic chemicals and precursors of different types and packings. 3. Drug Abuse and Illicit Trafficiking at National Level. Results of The National Survey on the Development of Drug Abuse in Indonsia, conducted by BNN in coordination with University of Indonesia Health Research Center reveal that the prevalence of drug abuse has reached 2.23%, or approx.. 4.2 million of the total population (between the age 10 – 59). In 2015 the number of drug abusers is projected at + 2.8%, or an equivalent of + 5.1 – 5.6 million of the total population. The outcomes of a National Survey on Drug Abuse and Illicit Trafficking among Workers of Transportation Modes (Land, Sea and Air) in Indonesia conducted in 2013 by BNN in cooperation with Health Research Center, University of Indonesia, reveal that the prevalence of drug abuse in the past year (current user) indicates also a relative high rate (6.9%), while the highest prevelance was found among workers in the River, Lake and Water Crossings (9.7%) with the highest prevalence rate among operators of land transportation (7.6%). Meanwhile, the highest prevalence rates of the most abused drugs by transportation workers in the past year are Cannabis (4.9%), ATS (2.3%), Opiates, Tranquilizers, Hallucinogens and Inhalants below 1%. Among ATS abusers the most frequently drugs used are Exstasy and Shabu, indicating respectively a prevalence of 1.4% for Ecstasy and Shabu 1.4%. Katinon is also reported with a prevalence of 0.3%. Among the opiates, heroin abuse indicates a prevalence of 0.5%, morphine 0.4%, and opium 0.2%. Among the group of tranquilizers, Luminal (0.4%) and koplo/BK tablet (0,5%). Phenobarbital (barbiturates) with a prevalence of 0.1% is also detected among transportation workers in the past year. In the group of hallucinogens, the most frequently used are mushroom (0.3%), kecubung (purple trumpet shaped flowers) 0.3%. LSD is still in circulation (0.1%). Among ”over the counter” drugs the most abused is dextromethorphan (0.7%). ATS abuse (Ecstasy) is found among workers of all transportation modes, with the exception of railway transportation, with the highest prevalence of 4.1% among workers of ASDP (River, Lake and Water Crossings), Land Transportation (1.6%), and Sea Transportation (1.0%). Shabu is also much abused in the past year among ASDP workers (3.6%), land transportation (1.7%), and sea transportation (1.1%). Among workers of air transportation ATS abuse is relatively less compared to other modes of transportation, indicating respectively 0.7% for Ecstasy and Shabu 0.1%.
  • 4. 4Journal of Data on the Prevention and Eradication of Drug Abuse and Illicit Trafficking (P4GN) Year 2013 Edition 2014 Based on data of BNN Deputy of Rehabilitation a total of 6,111 drug abusers all over Indonesia had received treatment and rehabilitation in 2013. The majority belongs to the age group of 25-40 years (3,916). Based on data from T&R services the most drugs abused are heroin (1,243), shabu (1,649), cannabis (1,243), ecstasy ((282) and opiates (195). Based on classification of drug cases, the year 2013 indicates a decreasing trend for Psychotropic Substances, with a percentage of 6.77% from 1,729 cases in 2012 to 1,612 in 2013. The largest increase of cases is seen in the abuse of Other Addictive Substances, with a percentage of 60.48% from 7,917 cases in 2012 to 12,705 cases in 2013. The largest number of cases with a total of 21,267 is seen in the abuse of Narcotics. According to classification of suspects, Narcotics cases rank the highest, totalling 28,784 suspects. There is an increase of 13.73% compared to 2012. The number of suspects in the group of Psychotropic Substances decreased by 9.41% from 2,062 arrewsted in 2012 to 1,868 in 2013. Suspects in the group of Other Addictive Substances increased by 61.52% from 8,269 suspects in 2012 to 13,355 in 2013. Furthermore, related to seized evidence, 2013 showed an increase of 56,66% for the seizure of cannabis trees, from 341,395 in 2012 to 534,829 in 2013. A significant decrease is reported in the seizures of cannabis seeds with a percentage of 95.79%, from 284.91 grams in 2012 to 12 grams in 2013.
  • 5. 5Journal of Data on the Prevention and Eradication of Drug Abuse and Illicit Trafficking (P4GN) Year 2013 Edition 2014 CHAPTER II DATA ON THE PREVENTION AND ERADICATION OF DRUG ABUSE AND ILLICIT TRAFFICKING, 2013 1. Supply Reduction. a. Cases, Suspects and Evidence seized of Drug Crimes from National Police, Republic of Indonesia Table 1. Number of Drug Cases Based on Classification of Drugs, 2013 NO. CLASSIFICATION OF DRUGS TOTAL CASES 2013 1 2 3 1. Narcotics 21,119 2. Psychotropic Substances 1,612 3. Other Addictive Substances 12,705 TOTAL 35,436 Source : National Police, Reppublic of Indonesia, March 2014 Table 2. Total Number of Drug Suspects Based on Classification of Drugs, 2013 NO. CLASSIFICATION OF DRUGS TOTAL SUSPECTS 2013 1 2 3 1. Narcotics 28,543 2. Psychotropic Substances 1,868 3. Other Addictive Substances 13,356 TOTAL 43,767 Source : National Police, Republic of Indonesia, March 2014 Table 3. Total Number of Drug Suspects Based on Nationality, 2013 NO. NATIONALITY TOTAL SUSPECTS 2013 1 2 3 1. Domestic 43,640 2. Foreign 127 TOTAL 43,767 Source : National Police, Republic of Indonesia, March 2014
  • 6. 6Journal of Data on the Prevention and Eradication of Drug Abuse and Illicit Trafficking (P4GN) Year 2013 Edition 2014 Table 4. Total Number of Drug Suspects Based on Gender, 2013 NO. GENDER TOTAL SUSPECTS 2013 1 2 3 1. Male 39,511 2. Female 4,256 TOTAL 43,767 Source : National Police, Republic of Indonesia, March 2014 Table 5. Number of Drug Suspects Based on Age Group, 2013 NO. AGE GROUP TOTAL SUSPECTS 2013 1 2 3 1. <16 years 122 2. 16-19 years 2,377 3. 20-24 years 6,246 4. 25-29 years 16,167 5. > 30 years 18,855 TOTAL 43,767 Source : National Police, Republic of Indonesia, March 2014 Table 6. Number of Drug Suspects Based on Educational Background, 2013 NO. EDUDCATION TOTAL SUSPECTS 2013 1 2 3 1. Elementary 7,540 2. Junior High School 12,169 3. Senior High School 22,952 4. University 1,106 TOTAL 43,767 Source : National Police, Republic of Indonesia, March 2014 Table 7. Number of Drug Suspects Based on Occupation, 2013 NO. OCCUPATION TOTAL SUSPECTS 2013 1 2 3 1. Civil Servant 410 2. Police/Armed Forces 256 3. Private Sector 19,731 4. Entrepreneur 9,010 5. Farmer 2,107 6. Labor 4,944 7. University student 857 8. Student 1,121 9. Unemployed 5,331 TOTAL 43,767 Source : National Police, Republic of Indonesia , March 2014
  • 7. 7Journal of Data on the Prevention and Eradication of Drug Abuse and Illicit Trafficking (P4GN) Year 2013 Edition 2014 Table 8. Quantity of Seized Cannabis, 2013 NO. EVIDENCE TOTAL 2013 1 2 3 1. Cannabis Leaves (Gram) 17,763,959.76 2. Cannabis Trees 534,829 3. Cultivation Area (Ha) 119.9 4. Cannabis Seeds 12 5. Cannabis Seeds (Gram) 12 Source : National Police, Republic of Indonesia, March 2014 Table 9. Quantity of Seized Narcotics, 2013 NO. EVIDENCE TOTAL 2013 1 2 3 1. Heroin (Gram) 11,054.04 2. Cocaine (Gram) 2,035 3. Hashish (Gram) 2,067.68 4. Ecstasy (Tablet) 1,137,940 5. Ecstasy (Gram) 2,113.17 6. Shabu (Gram) 398,602.55 Source : National Police, Republic of Indonesia, March 2014 Table 10. Quantity of Seized Psychotropic Substances, 2013 NO. EVIDENCE TOTAL 2013 1 2 3 1. Benzodiazepine (Tablet) 460,806.75 2. Barbiturates (Tablet) 181 3. Barbiturates(Gram) 7,275.5 4. Ketamine (Gram) 4,661.51 5. Controlled Medicines (Tablet) 5,869,329.5 6. Controlled Medicines (Bottle) 7 Source : National Police, Republic of Indonesia, March 2014 Table 11. Quantity of Seized Other Addictive Substances, 2013 NO. EVIDENCE TOTAL 2013 1 2 3 1. Alcohol (Bottle) 148,161 2. Alcohol (Litre) 3,022,520.10 Source : National Police, Republic of Indonesia, March 2014
  • 8. 8Journal of Data on the Prevention and Eradication of Drug Abuse and Illicit Trafficking (P4GN) Year 2013 Edition 2014 b. Suspects and Seized Evidence of Narcotics and Precursor Cases, and Money Laundering, from National Narcotics Board (BNN) 1) Total Disclosures of Cases Related to Narcotics and Psychotropic Substances Table 12. Cases of Narcotics and Precursors, 2013 NO. CASE TOTAL CASES 2013 1 2 3 1. Narcotics and Precursors 150 2. Money Laundering 15 TOTAL 165 Source : Deputyof Eradication, BNN, March 2014 Table 13. Narcotics and Precursors Cases Based on Type of Narcotics, 2013 NO. TYPE OF CASE TOTAL CASES 2013 1 2 3 1. Shabu 132 2. Cannabis 3 3. Ecstasy 10 4. Heroin 1 5. Precursors 3 6. Methilone 1 TOTAL 150 Source : Deputy of Eradication, BNN, March 2014 Table 14. Total Cases of Narcotics and Precursors Based on Classification of Narcotics, 2013 NO. CLASSIFICATION TOTAL CASES 2013 1 2 3 1. Narcotics 148 2. Precursors 2 TOTAL 150 Source : Deputy of Eradication, BNN, March 2014
  • 9. 9Journal of Data on the Prevention and Eradication of Drug Abuse and Illicit Trafficking (P4GN) Year 2013 Edition 2014 Table 15. Total Cases of Narcotics and Precursors Based on Type of Offence, 2013 NO. TYPE OF OFFENCE TOTAL CASES 2013 1 2 3 1. Consumption 13 2. Distribution 135 3. Production 2 4. Cultivation - TOTAL 150 Source : Deputy of Eradication, BNN, March 2014 2) Total Number of Suspects of Narcotics, Psychotropic Substances and Money Laundering, 2013 Table 16. Number of Suspects of Narcotics and Precursors Based on Type of Narcotics, 2013 NO. TYPE OF NARCOTIC TOTAL SUSPECTS 2013 1 2 3 1. Shabu 217 2. Cannabis 3 3. Ecstasy 14 4. Heroin 2 5. Precursors 4 6. Methilone 1 TOTAL 245 Source : Deputy of Eradication, BNN, March 2014 Table 17. Total Suspects of Narcotics and Precursors Based on Classification, 2013 NO. CLASSIFICATION TOTAL SUSPECTS 2013 1 2 3 1. Narcotics and Precursors 245 2. Money Laundering 15 TOTAL 260 Source : Deputy of Eradication, BNN, March 2014
  • 10. 10Journal of Data on the Prevention and Eradication of Drug Abuse and Illicit Trafficking (P4GN) Year 2013 Edition 2014 Table 18. Total Suspects of Narcotics and Precursors Based on Type of Offence, 2013 NO. TYPE OF OFFENCE TOTAL SUSPECTS 2013 1 2 3 1. Consumption 18 2. Distribution 223 3. Production 4 4. Cultivation - TOTAL 245 Source : Deputy of Eradication, BNN, March 2014 Table 19. Total Suspects of Narcotics and Precursors Based on Nationality, 2013 NO. NATIONALITY TOTAL SUSPECTS 2013 1 2 3 1. Domestic 223 2. Foreign 22 TOTAL 245 Source : Deputy of Eradication, BNN, March 2014 Table 20. Total Suspects of Narcotics and Precursors Based on Gender, 2013 NO. GENDER DOMESTIC SUSPECTS 2013 FOREIGN SUSPECTS 2013 1 2 3 1. Male 187 17 2. Female 36 5 TOTAL 245 Source : Deputy of Eradication, BNN, March 2014 Table 21. Total Suspects of Narcotics and Precursors Based on Age Group, 2013 NO. AGE GROUP TOTAL SUSPECTS 2013 1 2 3 1. < 16 years - 2. 16-19 yrs 5 3. 20-24 yrs 23 4. 25-29 yrs 49 5. > 30 yrs 168 TOTAL 245 Source : Deputy of Eradication, BNN, March 2014
  • 11. 11Journal of Data on the Prevention and Eradication of Drug Abuse and Illicit Trafficking (P4GN) Year 2013 Edition 2014 Table 22. Total Suspects of Narcotics and Precursors Based on Educational Background, 2013 NO. EDUCATION TOTAL SUSPECTS 2013 1 2 3 1. Elementary 33 2. Junior High School 47 3. Senior High School 134 4. University 31 TOTAL 245 Source : Deputy of Eradication, BNN, March 2014 Table 23. Total Suspects of Narcotics and Precursors Based on Occupation, 2013 NO. OCCUPATION TOTAL SUSPECTS 2013 1 2 3 1. Swasta Private Sector 73 2. Unemployed 44 3. Labors 10 4. Farmers 1 5. Entrepreneurs 95 6. University students 13 7. Civil Servants 3 8. Police/Armed Forces 6 TOTAL 245 Source : Deputy of Eradication, BNN, March 2014 Table 24. Total Foreign Suspects Involved in Drug and Precursor Crimes, 2013 NO. NATIONALITY TOTAL SUSPECTS 2013 1 2 3 1. Nigeria 5 2. India 3 3. China 2 4. Germany 2 5. Pakistan 1 6. South Afrika 1 7. Thailand 1 8. Austria 1 9. Malaysia 1 10. Mali 1 11. Vietnam 1 12. Taiwan 1 13. England 1 14. Ivory Coast 1 TOTAL 22 Source : Deputy of Eradication, BNN, March 2014
  • 12. 12Journal of Data on the Prevention and Eradication of Drug Abuse and Illicit Trafficking (P4GN) Year 2013 Edition 2014 Table 25. Total Suspects in Money Laundering Based on Nationality, 2013 NO. SUSPECTS TOTAL SUSPECTS 2013 1 2 3 1. Domestic 15 2. Foreign 0 TOTAL 15 Source : Deputy of Eradication, BNN, March 2014 Table 26. Total Suspects in Money Laundering Based on Gender, 2013 NO. GENDER DOMESTIC 2013 FOREIGN 2013 1 2 3 1. Male 10 0 2. Female 5 0 TOTAL 15 Source : Deputy of Eradication, BNN, March 2014 Table 27. Total Suspects in Money Laundering Based on Age Group, 2013 NO. AGE GROUP TOTAL SUSPECTS 2013 1 2 3 1. < 16 years - 2. 16-19 years - 3. 20-24 years 1 4. 25-29 years 1 5. > 30 years 13 TOTAL 15 Source : Deputy of Eradication, BNN, March 2014 Table 28. Total Suspects in Money Laundering Based on Educational Background, 2013 NO. EDUCATION TOTAL SUSPECTS 2013 1 2 3 1. Elementary - 2. Junior High School 2 3. Senior High School 12 4. University 1 TOTAL 15 Source : Deputy of Eradication, BNN, March 2014
  • 13. 13Journal of Data on the Prevention and Eradication of Drug Abuse and Illicit Trafficking (P4GN) Year 2013 Edition 2014 Table 29. Total Suspects in Money Laundering Based on Occupation, 2013 NO. OCCUPATION TOTAL SUSPECTS 2013 1 2 3 1. Private Sector 3 2. Unemployed 5 3. Labor 1 4. Farmer - 5. Entrepreneur 6 6. University Student - 7. Civil Servant - 8. Police/Armed Forces - TOTAL 15 Source : Deputy of Eradication, BNN, March 2014 3) Total Quantity of Seized Evidence of Cases Related to Narcotics, Psychotropic Substances, and Money Laundering, 2013 Table 30. Total Seized Narcotic Evidence, 2013 NO. EVIDENCE TOTAL 2013 1 2 3 1. Crystalline Shabu 144,049.77 gram 2. Ecstasy 27,238 tablets 3. Liquid Shabu 13,620 ml 4. Shabu 85 tablets 5. Ecstasy (powder) 150.50 gram 6. Heroin 215.90 gram 7. Cannabis 13,182.00 gram 8. Methilon 7.4 gram 9. Methcatinone 30.5 gram 10. MDMA Powder 5.25 gram 11. Happy Five 588 tablets 12. Liquid Toluene 41,140 ml 13. Liquid HCL 1,030 ml 14. Liquid H2SO4 10.410 ml 15. Liquid Acetone 500 ml 16. LiquidEphedrine 20 ml 17. Ephedrine Tablets 938 tablet = 146.38 gram 18. Safrole 257,000 ml 19. Non-narcotic Tablets 172.40 gram Source : Deputy of Eradication, BNN, March 2014
  • 14. 14Journal of Data on the Prevention and Eradication of Drug Abuse and Illicit Trafficking (P4GN) Year 2013 Edition 2014 Table 31. Total Seized Evidence in Money Laundering, 2013 NO. EVIDENCE TOTAL PROCESS TOTAL 1 2 3 4 5 1. Vehicles 20 Units 2units 22 Units 2. Motor cycle 4 Units - 4 Units 3. House& Apartement 12 Units - 12 Units 4. Land 47 SHM - 47 SHM 5. Jewelry 45 Pieces - 45 Pieces 6. Cash Money Rp. 5,252,864,204 Rp. 81,835,000 Rp. 5,334,699,204 7. Bank Account Rp.25,176,571,918 Rp. 732,650,000 Rp.25,909,221,918 8. Goods Rp.17,892,500,000 Rp. 330,000,000 Rp.18,222,500,000 Source : Deputy of Eradication, BNN, March 2014 Table 32. Details of Seized Evidence in Money Laundering, 2013 NO. LKN SUSPECTS EVIDENCE RE- MARKS MONEY/BANK ACCOUNT (Rp.) GOODS 1 2 3 4 5 1. LKN/08-WTB/II/ 2013/BNN Moch. Azwar als Siwa 124.500.000 1 House 1 Piece lf Land & Building 2nd stage 2. LKN/23-WTB/II/ 2013/BNN Faisal 16.061.112.818 3 UnitsVehicles 19 UnitsLand & Buildings 5 PiecesGold Jewelry 1 Unit Gas Station Stage II 3. LKN/30-WTB/III/ 2013/BNN Andi Juanda 1.071.508.394 2 Pieces Land 1 Unit Vehicle 10 Pieces Jewelry Stage II 4. LKN/54-WTB/IV/ 2013/BNN Sodikin Lilik Hamidah - 15 UnitsLand & Buildings 13 UnitsVehicles 2 Units Motor cycles Stage II 5. LKN/57-WTB/IV/ 2013/BNN Midy 3.884.084.886 1 Unit Laptop 1 Unit CPU 2 Units Houses 2 UnitsVehicles 9 Pieces Jewelry Stage II 6. LKN/82-WTB/VI/ 2013/BNN Agung Adhyaksa 125.000.000 2 UnitsLand & Buildings Stage II 7. LKN/85-WTB/VI/ 2013/BNN Yudi Hasmir Siregar 4.650.450.000 1 Unit Vehicle 2 Units Cutting Machines Stage II 8. LKN/86-WTB/VI/ 2013/BNN Komariah als Ruwi als Vivian Unayah 228.500 Incl. foreign money not yet converted 1 Unit Laptop 9 UnitsSewing Machines Stage II 9. LKN/89-WTB/VI/ 2013/BNN Tias Tilawati als Natalia Trisna als Lila Edi Purwono als Paul 42.000 Incl. foreign money not yet converted 1 Unit Laptop Stage II
  • 15. 15Journal of Data on the Prevention and Eradication of Drug Abuse and Illicit Trafficking (P4GN) Year 2013 Edition 2014 1 2 3 4 5 10. LKN/92-WTB/ VII/2013/BNN Jeky als Alimim als Limeng als Jet li 2 UnitsHouse & Building 1 Unit Motorcycle Stage II 11. LKN/105-WTB/ VI/2013/BNN Irwindy als Erwin Bin Baserani 3.561.761.000 1 Unit Laptop 22 Pieces Jewelry 2 UnitsVehicles 1 Unit Motorcycle 12 UnitsLand & Buildings Stage II 12. LKN/108-WTB/ VII/2013/BNN Martunis als Tunis 814.485.000 330.000.000 Investi- gation process 13. LKN/89-WTB/ VI/2013/BNN Mulyono, Dkk 950.728.524 Stage II 14. LKN/87-WTB/X/ 2013/BNN Haryono Nitirahardjo als Supardjo Sastro als Herry Martin als Om Jukerto Investi- gation process 15. LKN/153-WTB/ XII/2013/BNN Tjeuw Anton Investi- gation process Source : Deputy of Eradication, BNN, March 2014 4) Disclosure of Outstanding Cases Data by BNN, 2013 Table 33. Total Outstanding Drug Cases, 2013 NO. UNIT CASE SUSPECT EVIDENCE RE- MARKS 1 2 3 4 5 6 1. BNN 1 1 7 bottles (10 ltr) liquid precursor Cannabis 3 gr 10 jerrycans(250 ltr) 2. BNN 1 6 Shabu 6.527,8 gr Ecstasy 47 tabs weight 15,9 gr, Ecstasy powder, 169,5 gr Shabu 0,8 gr Shabu 2 gr Ecstasy 14 tabs 3. BNN 1 2 House: 1 unit 6 units sewing/hemming machines 1 unit Honda Jazz vehicle Several ATM cards and bank account books 4. BNN 1 2 Shabu 5.018 gr 5. BNN 1 1 Shabu 2.002 gr 6. Riau 1 7 Shabu 3,8 kg 7. BNN 1 1 Shabu 2.558 gr 8. BNN 1 1 Shabu 5.716 gr 9. East Kalimantan 1 3 Shabu 4.069,3 gr 10. West Kalimantan 1 2 Shabu 5.109,1 gr Ecstasy 9.107 tabs
  • 16. 16Journal of Data on the Prevention and Eradication of Drug Abuse and Illicit Trafficking (P4GN) Year 2013 Edition 2014 1 2 3 4 5 6 11. East Java 1 2 Shabu 1.562,7 gr 12. North Sumatera 1 3 Shabu 2,1 kg Shabu seberat 1 kg Ekstasi 11.400 butir TOTAL 12 31 Source : Deputy of Eradication, BNN, March 2014 5) Illicit Drug Trafficking Routes from overseas into Indonesia, 2013. a) Land Routes. (1) Malaysia – Entikong – Sanggau (West Kalimantan). (2) Malaysia – Entikong – Pontianak. (3) Papua New Guinea – Jayapura. b) Air Routes. (1) South Africa –Manado. (2) South Africa – Singapore– Lombok. (3) Netherland– Jakarta. (4) Netherland– Malaysia – Aceh. (5) Bangladesh –Jakarta. (6) China –Jakarta. (7) China – Malaysia – Jakarta. (8) China – Malaysia – Aceh. (9) Doha – Denpasar. (10) Doha – Jakarta. (11) Dubai – Jakarta. (12) India – Jakarta. (13) India – Timor Leste. (14) India – Singapore – Manado. (15) India – Singapore – Medan. (16) Iran – Malaysia – Aceh. (17) New Delhi – Bangkok – Denpasar. (18) New Delhi – Kuala Lumpur – Denpasar. (19) Kuala Lumpur – Makassar. (20) Mali, Central Africa – Medan. (21) Malaysia – Aceh. (22) Malaysia – Aceh – Medan. (23) Malaysia – Medan. (24) Malaysia – Padang. (25) Malaysia – Batam. (26) Malaysia – Pekanbaru. (27) Malaysia – Jakarta. (28) Malaysia – Semarang. (29) Malaysia – Surabaya. (30) Malaysia – Madura. (31) Malaysia – Bali.
  • 17. 17Journal of Data on the Prevention and Eradication of Drug Abuse and Illicit Trafficking (P4GN) Year 2013 Edition 2014 (32) Malaysia – Tarakan (East Kalimantan). (33) Malaysia – Jakarta – Surabaya. (34) Malaysia – Pontianak. (35) Pakistan – Jakarta. (36) Singapore – Lombok. (37) Siberia – Jakarta – Banjarmasin. (38) Timor Leste – Indonesia. (39) Thailand – Jakarta. (40) Thailand – Denpasar. (41) Bangkok – Makassar. c) Sea Routes. (1) Portklang – Dumai. (2) Iran – Taiwan – Tanjung Priok. (3) Johor Baru – Tanjung Balai Karimun. (4) Malacca – Dumai. (5) Pasirgudang Malaysia – Batam. (6) Stulang Laut Malaysia – Batam. (7) Singapore – Batam. (8) Malacca – Bengkalis. (9) Malacca – Dumai. (10) Portklang – Dumai. (11) Malaysia – Batam. (12) Malaysia – Tanjung Pinang (Kepri) – Jakarta. (13) Malaysia – Dumai – Jakarta. (14) Malaysia – Balikpapan. (15) Malaysia – Jakarta. (16) Malaysia – Pekanbaru. (17) Malaysia – Batam – Pekanbaru – Pangkal Pinang. (18) Malaysia – Batam – Pelabuhan Tanjung Priok (Jakarta). (19) Malaysia – Medan – Merak – Jakarta. d) Domestic Routes. (1) Aceh – Bakauheni Seaport (Lampung) - Jakarta. (2) Aceh – Jambi – Surabaya. (3) Aceh – Medan – Bukittinggi. (4) Aceh – Pekanbaru. (5) Aceh – Palembang. (6) Aceh – Medan. (7) Aceh – Cianjur. (8) Aceh – Jakarta. (9) Aceh – Jakarta – Cirebon - Jember. (10) Medan – Jakarta – Kupang – Atambua – Dili. (11) Medan – Nusa Tenggara Barat. (12) Batam – Surabaya. (13) Batam – Tanjung Priok. (14) Palembang – Jakarta.
  • 18. 18Journal of Data on the Prevention and Eradication of Drug Abuse and Illicit Trafficking (P4GN) Year 2013 Edition 2014 (15) Jakarta – Makassar. (16) Jakarta – Balikpapan (Kalimantan Barat). (17) Jakarta – Bogor – Sukabumi. (18) Jakarta – Pekalongan (Jawa Tengah). (19) Jakarta – Surabaya. (20) Malang (East Java ) – Bali. (21) Tangerang – Bekasi. (22) Bandung – Cianjur. (23) Surabaya – Bali. (24) Surabaya – Batam. (25) Pontianak – Ketapang. (26) Ketapang – Pontianak. c. Destroyed Narcotic Evidence Seized by National Narcotics Board. Table 34. Narcotic Evidence in Powder Form 2013 NO. EVIDENCE TOTAL QUANTITY DESTROYED 2013 REMARKS 1 2 3 4 1. Shabu 130,106.61 Gram 2. Heroin 199.40 Gram 3. Ecstasy 142.30 Gram 4. Cannabis 12,913.10 Gram 5. Precursors 28.00 Gram 6. Tablet Ephdedrine 144.92 Gram TOTAL 143,534.33 Gram Source : Deputy of Eradication, BNN, March 2014 Table 35. Total Destroyed Narcotics Evidence (Tablets), 2013 NO. EVIDENCE TOTAL QUANTITY DESTROYED 2013 REMARKS 1 2 3 4 1. Ecstasy 26.546 Gram 2. Methamphetamine 75 Gram 3. Happy Five 578 Gram TOTAL 27.199 Gram Source : Deputy of Eradication, BNN, March 2014
  • 19. 19Journal of Data on the Prevention and Eradication of Drug Abuse and Illicit Trafficking (P4GN) Year 2013 Edition 2014 Table 36. Quantity of Liquid Narcotic Evidence, 2013 NO. EVIDENCE TOTAL EVIDENCE DESTROYED 2013 REMARKS 1 2 3 4 1. Liquid Precursor 322.885 Gram TOTAL 322.885 Gram Source : Deputy of Eradication, BNN, March 2014 d. Seizures and Ranking of Narcotic Evidence from Ministry of Finance RI 2013 Table 37. Total Seizures of Natural Narcotics Evidence at Airports, 2013 NO. EVIDENCE 2013 1 2 3 1. Cannabis (Gram) 7,59 2. Heroin (Gram) 372 3. Cocaine (Gram) 0 4. Hashish (Gram) 103,64 Source : Directorate General of Customs & Excise, Ministry of Finance RI, March 2014 Table 38. Total and Ranking of Seized Cannabis Leaves at Airports, 2013 NO. PROVINCE AIRPORT 2013 REMARKSTOTAL RANKING 1 2 3 4 5 6 1. Bali Ngurah Rai 7,59 1 Gram TOTAL 7,59 Gram Source : Directorate General of Customs & Excise, Ministry of Finance RI, March 2014 Table 39. Total and Ranking of Seized Heroin Evidence at Airports, 2013 NO. PROVINCE AIRPORT 2013 REMARKS TOTAL RANKING 1 2 3 4 5 6 1. Bali Ngurah Rai 372 1 Gram JUMLAH Gram Source : Directorate General of Customs & Excise, Ministry of Finance RI,March2014 Table 40. Total and Ranking of Seized Hashish at Airports, 2013 NO. PROVINCE AIRPORT 2013 REMARKS TOTAL RANKING 1 2 3 4 5 6 1. Bali Ngurah Rai 103.64 1 Gram TOTAL Gram Source : Directorate General of Customs & Excise, Ministry of Finance RI, March 2014
  • 20. 20Journal of Data on the Prevention and Eradication of Drug Abuse and Illicit Trafficking (P4GN) Year 2013 Edition 2014 Table 41. Total Synthetic Narcotics Seized at Airports, 2013 NO. EVIDENCE 2013 1 2 3 1. Ecstasy (Gram) 207.221,63 2. Shabu (Gram) 78.488,2 3. Methadone (ML) 40 4. Ketamine (Gram) 4.152,3 5. Xanax (Tabs) 8 Source : Directorate General of Customs & Excise, Ministry of Finance RI , March 2014 Table 42. Total and Ranking of Seized Ecstasy at Airports, 2013 NO. PROVINCE AIRPORT 2013 REMARKS TOTAL RANKING 1 2 3 4 5 6 1. Banten Soekarno Hatta 207,220 1 Gram 2. North Sumatera Polonia Medan 1.63 2 Gram TOTAL 207,221.63 Gram Source : Directorate General of Customs & Excise, Ministry of Finance RI, March 2014 Table 43. Total and Ranking of Seized Shabu at Airports, 2013 NO. PROVINCE AIRPORT 2013 REMARKS TOTAL RANKING 1 2 3 4 5 6 1. Banten Soekarno Hatta 31,914 1 Gram 2. Jawa Timur Juanda 15,276.20 2 Gram 3. Batam Hang Nadim 8,619 3 Gram 4. Bali Ngurah Rai 6,827 4 Gram 5. West Java Husein Sastranegara 3,875 5 Gram 6. North Sulawesi Samratulangi 3,667 6 Gram 7. Yogya Adi Sucipto 2,800 7 Gram 8. West Sumatra Minang Kabau 2,800 8 Gram 9. East Kalimantan Sepinggan Balikpapan 1,534 9 Gram 10. North Sumatra Polonia Medan 916 10 Gram 11. West Kalimantan Supadio Pontianak 260 11 Gram TOTAL 78,488 Gram Source : Directorate General of customs & Excise, Ministry of Finance RI, March 2014
  • 21. 21Journal of Data on the Prevention and Eradication of Drug Abuse and Illicit Trafficking (P4GN) Year 2013 Edition 2014 Table 44. Total Seized Heroin Evidence at Seaports, 2013 NO. PROVINCE SEAPORT 2013 REMARK STOTAL RANKING 1 2 3 4 5 6 1. Riau Islands Batam Center 623 1 Gram 2. Riau Balai Karimun 11.92 2 Gram TOTAL 635 Gram Source : Directorate General of Customs & Excise, Ministry of Finance RI, March 2014 Table 45. Total Ecstasy Seized at Seaports, 2013 NO. PROVINCE SEAPORT 2013 REMARK STOTAL RANKING 1 2 3 4 5 6 1. Riau Islands Batam Center 9.921 1 Butir TOTAL 9.921 Butir Source : Directorate General of Customs & Excise, Ministry of Finance RI, March 2013 Table 46. Total Shabu Evidence Seized at Airports, 2013 NO. PROVINCE SEAPORT 2013 REMAR REMAR KSTOTAL RANKING 1 2 3 4 5 6 1. North Sumatera 1. Teluk Nibung 724,60 3 Gram 2. Riau 1. Dumai 2.437,99 2 Gram 2. Setia Raja 450 4 Gram 3. Balai Karimun 1,12 5 Gram 3. Riau Isl, 1. Batam Centre 4.402 1 Gram TOTAL 8.015,71 Gram Source : Directorate General of Customs & Excise, Ministry of Finance RI, March 2013 Table 47. Total Cannabis Evidence Seized at Border Crossing, 2013 NO. PROVINCE BORDER CROSSING 2013 REMARK STOTAL RANKING 1 2 3 4 5 6 1. West Papua PPLB Skow Wutung 1.520 500 seeds 1 2. Riau Tanjung Balai Karimun 1,1 2 TOTAL 1.521,1 500 seeds Source : Directorate General of Customs & Excise, Ministry of Finance RI, March 2014
  • 22. 22Journal of Data on the Prevention and Eradication of Drug Abuse and Illicit Trafficking (P4GN) Year 2013 Edition 2014 Table 48. Total Shabu Evidence Seized at Border Crossings, 2013 NO. PROVINCE BORDER CROSSING 2013 REMARKS TOTAL RANKING 1 2 3 4 5 6 1. Riau Isl Batam Center 1,12 2 Gram 2. Riau Tanjung Balai Karimun 4.402 1 Gram TOTAL 4.403,12 Gram Source : Directorate General of Customs & Excise, Ministry of Finance RI, March 2014 Table 49. Total Narcotics Suspects Based on Nationality, 2013 NO. NATIONALITY TOTAL SUSPECTS 2013 1 2 3 1. Indonesia 133 2. Malasyia 32 3. Papua New Guinea 3 4. China 29 5. Nigeria 2 6. France 2 7. Philippines 3 8. Ukraina 1 9. Thailand 3 10. Iran 1 11. Chile 1 12. South Africa 2 13. Singapore 2 14. Taiwan 1 15. Belgium 1 16. India 7 17. Vietnam 3 18. Germany 2 19. Bangladesh 1 20. Austria 1 21. USA 1 22. Sweden 1 TOTAL 232 Source : Directorate General of Customs & Excise, Ministry of Finance RI, March 2014 Table 50. Total Narcotics suspects Based on Gender, 2013 NO. GENDER TOTAL SUSPECTS2013 1 2 3 1. Male 170 2. Female 62 TOTAL 232 Source : Directorate General of Customs & Excise, Ministry of Finance RI, March 2014
  • 23. 23Journal of Data on the Prevention and Eradication of Drug Abuse and Illicit Trafficking (P4GN) Year 2013 Edition 2014 e. Prisoners and Detainees of Drug Cases Throughout Indonesia in 2013, from Ministry of Justice and Human Rights, Republic of Indonesia Table 51. Total Number of Prisoners and Detainees of Narcotics Cases in Indonesia, by Province, 2013 NO. REGIONAL OFFICE TOTAL PRISONERS AND DETAINEES 2013 1 2 3 1. Aceh 1,706 2. North Sumatera 64 3. West Sumatera 1,149 4. Riau Island 1,209 5. Riau 2,689 6. Jambi 906 7. South Sumatera 2,275 8. Bangka Belitung 483 9. Lampung 1,715 10. Bengkulu 438 11. Banten 3,502 12. DKI Jakarta 10,026 13. West Java 7,111 14. DI Yogyakarta 319 15. Central Java 3,237 16. East Java 4,055 17. West Kalimantan 811 18. Central Kalimantan 688 19. South Kalimantan 3,249 20. East Kalimantan 1,592 21. North Sulawesi 64 22. Gorontalo 56 23. Central Sulawesi 342 24. South Sulawesi 1,125 25. West Sulawesi 78 26. Southeast Sulawesi 213 27. Bali 459 28. West Nusa Tenggara 375 29. East Nusa Tenggara 25 30. Maluku 87 31. North Maluku 70 32. West Papua 28 33. Papua 37 TOTAL 55,671 Source : Directorate General of Correctional Facilities, Ministry of Justice & Human Rights, March 2014 Note : Source of the data from 411 Technical Services Unit (UPT) in Indonesia
  • 24. 24Journal of Data on the Prevention and Eradication of Drug Abuse and Illicit Trafficking (P4GN) Year 2013 Edition 2014 Table 52. Total Number of Prisoners and Detainees of Drug Cases by Province, Based on Classification of Dealers and Users, 2013 NO. REGIONAL OFFICE DRUG CASES TOTALDEALER/ TRAFFICKER USER 1 2 3 4 5 1. Aceh 1,255 451 1,706 2. North Sumatera 3,250 2,302 5,552 3. West Sumatera 520 629 1,149 4. Riau Island 631 578 1,209 5. Riau 2,084 605 2,689 6. Jambi 635 271 906 7. South Sumatera 961 1,314 2,275 8. Bangka Belitung 396 87 483 9. Lampung 1,237 478 1,715 10. Bengkulu 324 114 438 11. Banten 1,475 2,027 3,502 12. DKI Jakarta 4,940 5,086 10,026 13. West Java 635 271 906 14. DI Yogyakarta 205 114 319 15. Central Java 2,281 956 3,237 16. East Java 853 3,202 4,055 17. West Kalimantan 251 560 811 18. Central Kalimantan 221 467 688 19. South Kalimantan 1,784 1,465 3,249 20. East Kalimantan 1,179 413 1,592 21. North Sulawesi 35 29 64 22. Gorontalo 0 56 56 23. Central Sulawesi 97 245 342 24. South Sulawesi 298 827 1,125 25. West Sulawesi 35 43 78 26. Southeast Sulawesi 100 113 213 27. Bali 211 248 459 28. West Nusa Tenggara 302 73 375 29. East Nusa Tenggara 1 24 25 30. Maluku 25 62 87 31. North Maluku 57 13 70 32. West Papua 15 22 37 33. Papua 1 24 25 TOTAL 30,132 25,539 55,671 Source : Directorate General of Correctional Facilities, Ministry of Justice & Human Rights, March 2014
  • 25. 25Journal of Data on the Prevention and Eradication of Drug Abuse and Illicit Trafficking (P4GN) Year 2013 Edition 2014 Table 53. Number of Prisoners and Detainees in Narcotics Prisons Throughout Indonesia, 2013 NO. TECHNICAL SERVICE UNIT REGI- ONAL OFFICE NUMBER OF CAPACITY % CAPACITY DETAI- NEES PRISO- NERS TOTAL 1 2 3 4 5 6 7 8 1. Lapas Kelas II A Narkotika Bandar Lampung Lampung 689 689 168 410 2. Lapas Kelas II A Narkotika Bandung West Java 581 544 1,125 448 251 3. Lapas Kelas II A Narkotika Cipinang DKI Jakarta 185 2,919 3,104 1,084 286 4. Lapas Kelas II A Narkotika Cirebon West Java 785 785 455 173 5. Lapas Kelas II A Narkotika Jayapura Papua 21 124 145 308 47 6. Lapas Kelas II A Narkotika Karang Intan S. Kali- mantan 730 730 300 243 7. Lapas Kelas II A Narkotika Lubuk Linggau S. Suma- tera 68 275 343 198 173 8. Lapas Kelas II A Narkotika Madiun East Java 0 0 200 0 9. Lapas Kelas II A Narkotika Nusakambangan Central Java 431 431 245 176 10. Lapas Kelas II A Narkotika Pamekasan East Java 0 0 1,250 0 11. Lapas Kelas II A Narkotika Pematang Siantar N. Suma- tera 1 20 21 420 5 12. Lapas Kelas II A Narkotika Sungguminasa S. Sulawesi 1 601 602 368 164 13. Lapas Kelas II A Narkotika Tanjung Pinang Riau Island 22 22 200 11 14. Lapas Kelas II A Narkotika Yogyakarta DI Yogya- karta 30 229 259 474 55 15. Lapas Kelas III Narkotika Kasongan C. Kali- mantan 7 7 240 3 16. Lapas Kelas III Narkotika Langkat N. Suma- tera 49 49 1,500 3 17. Lapas Kelas III Narkotika Langsa Aceh 1 131 132 800 17 18. Lapas Kelas III Narkotika Muara Sabak Jambi 64 64 160 40 19. Lapas Kelas III Narkotika Pangkal Pinang Babel 236 236 168 140 20. Lapas Kelas III Narkotika Samarinda E. Kali- mantan 500 500 339 147 TOTAL 888 8,356 9,244 9,730 Source : Directorate General of Correctional Facilities, Ministry of Justice & Human Rights, March 2014
  • 26. 26Journal of Data on the Prevention and Eradication of Drug Abuse and Illicit Trafficking (P4GN) Year 2013 Edition 2014 f. Detainees of Narcotic Cases throughout Indonesia in 2013, from BNN Table 54. Total Number of Detainees of Narcotic Cases at National Narcotics Board, Based on Nationality, 2013 NO. NATIONALITY TOTAL DETAINEES 2013 1 2 3 1. Indonesia 223 2. Malaysia 1 3. Nigeria 5 4. India 3 5. China 2 6. Taiwan 1 7. Vietnam 1 8. English 1 9. Mali 1 10. South Africa 1 11. Ivory Coast 1 12. German 2 13. Pakistan 1 14. Austria 1 15. Thailand 1 TOTAL 245 Source : Deputy of Eradication, BNN, March 2014 Table 55. Total Number of Detainees of Narcotic Cases at National Narcotics Board Based on Gender, 2013 NO. GENDER TOTAL DETAINEES 2013 1 2 3 1. Male 199 2. Female 46 TOTAL 245 Source : Deputy of Eradication, BNN, March 2014 Table 56. Total Number of Detainees of Narcotic Cases Based on Age Group, 2013 NO. AGE GROUP TOTAL DETAINEES 2013 1 2 4 1. < 16 Years 0 2. 16 – 20 Years 8 3. 21 – 25 Years 31 4. 26 – 30 Years 51 5. 31 – 35 Years 56 6. 36 – 40 Years 40 7. 41 – 45 Years 30 8. 46 – 50 Years 20 9. > 50 Years 9 TOTAL 245 Source : Deputy of Eradication, BNN, March 2014
  • 27. 27Journal of Data on the Prevention and Eradication of Drug Abuse and Illicit Trafficking (P4GN) Year 2013 Edition 2014 g. Number of Prosecutions and Death Verdicts for Foreign and Domestic Nationals for Cases of Narcotic and Psychotropic Substances in 2013, by General Attorney Office, Republic of Indonesia Table 57. Total Number of Prosecutions for Narcotics and Psychotropic Sustances Cases by Province, 2013 NO. PROVINCE TOTAL PROSECUTIONS TOTAL NARCOTICS PSYCHOTROPICS 1 2 3 4 5 1. Aceh 380 1 381 2. Nort Sumatera 2,562 227 2,789 3. West Sumatera 302 11 313 4. Riau 436 2 438 5. Riau Island 187 6 193 6. Jambi 136 0 136 7. South Sumatera 877 1 878 8. Bengkulu 160 0 160 9. Lampung 360 0 360 10. Bangka Belitung 183 11 194 11. Banten 0 0 0 12. DKI Jakarta 2,599 99 2,698 13. West Java 1,138 35 1,173 14. Central Java 431 21 452 15. DI Yogyakarta 140 13 153 16. East Java 1,187 81 1,268 17. West Kalimantan 266 8 274 18. South Kalimantan 579 0 579 19. East Kalimantan 584 31 615 20. Central Kalimantan 143 0 143 21. Bali 58 0 58 22. West Nusa Tenggara 87 15 102 23. East Nusa Tenggara 19 0 19 24. South Sulawesi 159 15 174 25. West Sulawesi 0 0 0 26. Southeast Sulawesi 68 0 68 27. Central Sulawesi 18 0 18 28. North Sulawesi 47 1 48 29. Gorontalo 18 0 18 30. Maluku 19 1 20 31. North Maluku 33 0 33 32. Papua 20 0 20 33. West Papua 0 0 0 TOTAL 13,196 579 13,775 Source : General Attorney Office, Republic of Indonesia, March 2014
  • 28. 28Journal of Data on the Prevention and Eradication of Drug Abuse and Illicit Trafficking (P4GN) Year 2013 Edition 2014 Table 58. Number of Death Verdicts for Foreign and Domestic Nationals for Cases of Narcotic and Psychotropic Substances in 2013 NO. LEGAL ACTION TOTAL REMAKS 1 2 3 4 1. Judicial review and pardon denied 0 2. Not yet take a stand 25 3. Judicial review denied 6 4. Pardon granted, changed to life imprisonment 3 5. First pardon process 8 6. Second petition for pardon 2 7. Judicial review process 18 8. Judicial review granted 9 9. Convicted person passed away 5 10. Already executed 7 11. Decision on the cassation turned to life imprisonment 1 12. Still waiting for the verdict of the high court appeal 5 TOTAL 89 Source : General Attorney Office, Republic of Indonesia, March 2014 h. Results of Tested Evidence from Crimes on Narcotics, Psychotropic Substances and other Addictive Substances in 2013, from the Office of Drugs and Food Control Table 59. Total Results of Laboratory-tested Narcotics Evidence by Province, 2013 NO. REGIONAL OFFICE/ OFFICE TO- TAL SAM- PLE TEST RESULTS TO- TAL H E R O I N C O D E I N E C A N A B I S MET- AM- PE- TA- MINE AM- PHE TA- MI- NE SUL- FATE M D M A NEG A- TIVE DRU G 1 2 3 4 5 7 8 9 10 11 12 1. BBPOM Jakarta 2. BBPOM Banda Aceh 11 10 1 11 3. BBPOM Lampung 63 1 36 21 1 2 1 62 4. BBPOM Bandung 632 1 1 498 98 2 3 603 5. BBPOM Banjarmasin 413 1 365 22 23 411 6. BBPOM Denpasar 3 1 2 3 7. BBPOM Jayapura 74 56 16 1 73 8. BBPOM Makassar 9. BBPOM Manado 10. BBPOM Mataram 141 54 81 3 3 141 11. BBPOM Medan 12. BBPOM Padang 13. BBPOM Palembang 14. BBPOM Pekanbaru 286 66 201 14 4 285
  • 29. 29Journal of Data on the Prevention and Eradication of Drug Abuse and Illicit Trafficking (P4GN) Year 2013 Edition 2014 1 2 3 4 5 7 8 9 10 11 12 15 BBPOM Pontianak 367 16 280 44 25 365 16 BBPOM Samarinda 15 10 10 17 BBPOM Semarang 18 BBPOM Surabaya 19 BBPOM Yogyakarta 5 1 1 20 BPOM Ambon 42 21 21 42 21 BPOM Bengkulu 200 100 95 1 4 200 22 BPOM Jambi 23 4 13 6 23 23 BPOM Gorontalo 14 4 10 14 24 BPOM Kendari 25 BPOM Kupang 26 BPOM Palangkaraya 19 8 6 3 17 27 BPOM Palu 92 2 67 1 1 71 T O T A L 2.400 3 1 879 1284 1 95 69 2.332 Source : National Food & Drugs Control Agency, March 2014 Table 60. Total Results of Laboratory-tested Psychotropic Substances Evidence from Crimes by Province, 2013 NO. REGIONAL OFFICE/ OFFICE TEST RESULTS TO- TAL ALPRA- ZOLAM DIAZE- PAM CLO- NA- ZEPAM NIME- TAZE- PAM NITRA- ZEPAM NEGA- TIVE 1 2 3 4 5 6 7 8 9 1 BBPOM Jakarta 2 BBPOM Banda Aceh 3 BBPOM Lampung 4 BBPOM Bandung 17 1 5 23 5 BBPOM Banjarmasin 6 BBPOM Denpasar 7 BBPOM Jayapura 8 BBPOM Makassar 9 BBPOM Manado 10 BBPOM Mataram 11 BBPOM Medan 12 BBPOM Padang 13 BBPOM Palembang 14 BBPOM Pekanbaru 15 BBPOM Pontianak 1 1 2 16 BBPOM Samarinda 17 BBPOM Semarang 18 BBPOM Surabaya 19 BBPOM Yogyakarta 1 2 1 4 20 BPOM Ambon 21 BPOM Bengkulu 22 BPOM Jambi 23 BPOM Gorontalo 24 BPOM Kendari 25 BPOM Kupang 26 BPOM Palangkaraya 1 1 27 BPOM Palu T O T A L 18 3 1 1 5 2 30 Source : National Food & Drugs Control Agency, March 2014
  • 30. 30Journal of Data on the Prevention and Eradication of Drug Abuse and Illicit Trafficking (P4GN) Year 2013 Edition 2014 Table 61. Total Results of Laboratory-tested Evidence of Other Addictive Substances from Crimes by Province, 2013 NO. REGIONAL OFFICE/ OFFICE TEST RESULTS TTL P A R A C E T A M O L P S E U D O E P H E D R I N E E P H E D R I N E C H L O R O Q U I N C A F F E I N E T R I H E X Y P H E N I D I L DEX- TRO- MET- HOR- FAN HBR C A R I S O P R O D O L T R A M A D O L K E T A M I N E 1 2 3 4 5 6 7 8 9 10 11 12 13 1 BBPOM Jakarta 2 BBPOM Banda Aceh 3 BBPOM Bandar Lampung 1 1 4 BBPOM Bandung 6 6 5 BBPOM Banjarmasin 1 1 2 6 BBPOM Denpasar 7 BBPOM Jayapura 1 1 8 BBPOM Makassar 9 BBPOM Manado 10 BBPOM Mataram 11 BBPOM Medan 12 BBPOM Padang 13 BBPOM Palembang 14 BBPOM Pekanbaru 1 1 15 BBPOM Pontianak 16 BBPOM Samarinda 5 5 17 BBPOM Semarang 18 BBPOM Surabaya 19 BBPOM Yogyakarta 20 BPOM Ambon 21 BPOM Bengkulu 22 BPOM Jambi 23 BPOM Gorontalo 24 BPOM Kendari 25 BPOM Kupang 26 BPOM Palangkaraya 1 1 27 BPOM Palu 20 1 21 T O T A L 2 1 2 25 7 1 38 Source : National Food & Drugs Control Agency, March 2014
  • 31. 31Journal of Data on the Prevention and Eradication of Drug Abuse and Illicit Trafficking (P4GN) Year 2013 Edition 2014 i. Recommendations for Non Pharmaceutical Precursors issued in 2013, by BNN Table 62. Recommendations for Non-Pharmaceutical Precursors, 2013 NO. COMPANY RECOMENDATION PRECURSOR IMPORT 1 2 3 4 5 1. PT. Halim Sakti Pratama lmportation Approval Letter Potassium Permanganate BP 2000 60 MT (3 FCL) Changing of General Importer Identification Number 2. PT. EDF System Integration lmportation Approval Letter Methyl Ethyl Ketone 3.000 litre 3. PT. AKR Niaga Indonesia Appointment of Importers Limited lmportation Approval Letter Sulfuric Acid 99.500 MT 4. PT. Anugerah Inti Artha lmportation Approval Letter Potassium Permanganate 120.000 kg 5. PT. Jatika Nusa Extension of Appointment of Importers Limited lmportation Approval Letter Potassium Permanganate 140.000 kg Piperonal 3.000 kg Phenyl Acetic Acid 1.000 kg Potassium Permanganate BP 2000 80.000 kg 6. PT. Mulya Adhi Paramita lmportation Approval Letter Acetone 6.300 MT & 4.000 litre Methyl Ethyl Ketone 6.500 MT & 3.500 litre Toluene 30.000 MT & 15.000 litre Extension of Appointment of Importers Limited 7. PT. Multiredjeki Kita lmportation Approval Letter Hydrochloric Acid 7.500 litre Sulphuric Acid 5.500 litre Ethyl Ether 1.200 litre Toluene 2.816 litre Ether 1.200 litre Acetone 4.600 litre 8. PT. Sinarkimia Utama lmportation Approval Letter Hydrochloric Acid 1.000 gallon Potassium Permanganate 40 MT 9. PT. AIK MOH Chemicals Indonesia lmportation Approval Letter Acetone 62 ton Toluene 48 ton Methyl Ethyl Ketone 46 ton Hydrochloric Acid 52 ton Sulphuric Acid 49 ton Appointment of Importers Limited 10. PT. PKG Lautan Indonesia lmportation Approval Letter Toluene 12.300 ton Aceton 4.000 ton Methyl Ethyl Ketone 4.000 ton
  • 32. 32Journal of Data on the Prevention and Eradication of Drug Abuse and Illicit Trafficking (P4GN) Year 2013 Edition 2014 1 2 3 4 5 11. PT. Indonesian Acids Industry Pre-Export Notification Sulfuric Acid 38% - 39% 42,72 MT (2 FCL) Export Approval Letter Sulfuric Acid 42,72 MT (2 FCL 20’) Export Approval Letter Sulphuric Acid 98% 24 MT (1 FCL 20’) Pre-Export Notification Sulphuric Acid 38%-39% 109,44 MT (5 FCL 20’) 12. PT. Sari Sarana Kimiatama Appointment of Importers Limited lmportation Approval Letter Acetone 300 liter & 300 MT MEK 2.000 liter & 2.000 MT Toluene 6.000 liter & 6.000 MT 13. PT. Printechnindo Raya Utama Extension of Appointment of Importers Limited lmportation Approval Letter MEK 34.600 litre 14. PT. Itochu Indonesia lmportation Approval Letter Toluene 18.000 ton & 25.500 litre MEK 6.000 ton & 1.400 litre Acetone 6.000 ton & 17.800 litre Asetat Anhidrida 900 litre Dietil Eter 19.590 litre & 40 ton Asam Klorida 140.000 litre & 4.400 ampule Asam Fenilasetat 120 kg Piperidina 24 kg & 40 litre Kalium Permanganate 1.330 kg & 280 litre & 1.430 ampule Asam Sulfat 36.110 litre & 2.300 ampule Extension of Appointment of Importers Limited 15. PT. Nagase Impor Ekspor Indonesia lmportation Approval Letter Hydrochloric Acid 3.200 kg 16. PT. Samchem Prasandha Extension of Appointment of Importers Limited lmportation Approval Letter Acetone 800 MT Toluene 1.500 MT MEK 1.550 MT 17. PT. Prochem Tritama lmportation Approval Letter Hydrochloric Acid 92.876,91 kg Sulphuric Acid 76.385 kg Acetone 25.920 kg Toluene 4.680 kg MEK 400 kg 18. PT. Praganusa lmportation Approval Letter Toluene 1.440 kg 19. PT. Fanindo Chiptronic lmportation Approval Letter Acetone 1.240 litre MEK 2.300 litre Toluene 32.400 litre Sulfuric Acid 40 liter & 4.000 20. PT. Arta Palu Export Approval Letter Sassafras Oil 17.200 kg Pre-Export Notification Sassafaras Oil 90% 17.200 kg Export Approval Letter Sassafras Oil (safrole content min 90%) 17.200 kg Pre-Export Notification Sassafras Oil (safrole content min 90%) 17.200 kg
  • 33. 33Journal of Data on the Prevention and Eradication of Drug Abuse and Illicit Trafficking (P4GN) Year 2013 Edition 2014 1 2 3 4 5 21. PT. Udaya Anugerah Abadi lmportation Approval Letter Toluene 6.000 MT Methyl Ethyl Ketone 2.000 MT Acetone 1.000 MT Extension of Appointment of Importers Limited 22. PT. Rukun Persada Makmur lmportation Approval Letter Potassium Permanganate 40 ton & 60 MT Extension of Appointment of Importers Limited 23. PT. Elang Kurnia Sakti lmportation Approval Letter Sulphuric Acid 58.140 kg Hydrochloric Acid 58.695 kg 24. PT. Indochemical Citra Kimia Extension of Appointment of Importers Limited lmportation Approval Letter Toluene 48.000 MT Methyl Ethyl Ketone 15.000 MT Acetone 6.000 MT 25. PT. Karunia Jasindo lmportation Approval Letter Hydrochloric Acid 1.500 litre Potassium Permangante litre Acetone 6.000 litre Acetic Anhydride 400 litre Diethyl Ether 2.000 litre MEK 100 litre Sulfuric Acid 2.000 litre Toluene 1.200 litre 26. PT. Indofa Utama Multi Core lmportation Approval Letter Hydrochloric Acid 7.500 litre Sulphuric Acid 1.500 litre Toluene 300 litre 27. PT. Multi Eka Chemicalindo Extension of Appointment of Importers Limited lmportation Approval Letter Hydrochloric Acid 3.750 litre Sulphuric Acid 1.000 litre 28. PT. Wilmar Chemical Indonesia Appointment of Importers Limited 29. PT. Synergi Multi Daya Pratama Appointment of Importers Limited 30. PT. Makro Jaya Appointment of Importers Limited lmportation Approval Letter Methyl Ethyl Ketone 1.140 litre Acetone 440 litre 31. PT. Merck, Tbk. Exportation Approval Letter Diethyl Ether 8.500 litre Acetone 10.000 litre 32. PT. Sinar Berkat Anugrah lmportation Approval Letter Potassium Permanganate 40.000 kg Extension of Appointment of Importers Limited 33. PT. Marga Cipta Selaras Appointment of Importers Limited Source : Directorate of Psychotropics Substance and Precursors BNN, March 2014
  • 34. 34Journal of Data on the Prevention and Eradication of Drug Abuse and Illicit Trafficking (P4GN) Year 2013 Edition 2014 j. Results of Laboratory-tested Drug Samples in 2013, and NPS List and its Derivateves in Indonesia from BNN Table 63. Total Results of Tested Samples at BNN Drug Laboratory, 2013 NO. MONTH NARKOTICS PSYCHOTROPIC NEGATIVE PRECURSOR TOTAL RAW MATE- RIAL URINE RAW MATE- RIAL URINE RAW MATE- RIAL URINE RAW MATE- RIAL URINE 1 2 3 4 5 6 7 8 9 10 11 1. January 1,310 124 8 - 27 518 - - 1,987 2. Pebruary 1,153 114 3 - 43 28 1 - 1,342 3. March 115 106 4 - 55 34 - - 314 4. April 1,479 168 13 - 48 52 - - 1,760 5. May 1,231 155 8 - 42 50 - - 1,486 6. June 1,541 158 20 - 134 55 - - 1,908 7. July 1,463 137 6 - 95 29 55 - 1,785 8. Augst 672 122 9 - 21 65 - - 889 9. September 1,302 129 10 - 48 45 - - 1,534 10. October 1,458 141 18 - 66 58 - - 1,741 11. November 1,375 134 3 - 48 162 6 - 1,728 12. December 942 153 4 - 30 36 1 - 1,166 TOTAL 14,041 1,641 106 0 657 1,132 63 0 17,640 Source : Center for Drug Testing Laboratory BNN, March 2014 Table 64. NPS List and its Derivatives in Indonesia. NO. IUPAC NAME EFFECTS COMMON NAME TYPE RE- MARKS 1 2 3 4 5 6 1. 2-methylamino-1-(3,4- methylenedioxyphenyl)propan-1- one Stimulan, halusinongen, insomnia and Sympathomimetic Methylone (MDMC) Cathinone Derivative 2. (RS)-2-methylamino-1-(4- methylpenhyl)propan-1-one Stimulan, Increasing heart rate and harmful Mephedrone (4- MMC) Cathinone Derivative 3. (±)-1-phenyl-2- (methylamino)pentan-1-one Psychostimulant Pentedrone Cathinone Derivative 4. (RS)-2-ethylamino-1-(4- methylphenyl)propan-1-one Stmulant with teh effect of empathogenic 4-MEC Cathinone Derivative 5. (RS)-1-(benzo[d][1,3]dioxol-5-yl)-2- (pyrrolidin-1-yl)pentan-1-one euphoria, stmulan, effect aphrodisiac and effect empathogenic MDPV Cathinone Derivative 6. (RS)-2-ethylamino-1-phenyl- propan-1-one Psychostimulant Ethcathinone (N- ethylcathinone) Cathinone Derivative 7. (RS)-1-(4-methylphenyl)-2-(1- pyrrolidinyl)-1-hexanone Psychostimulant MPHP Cathinone Derivative 8. Catha edulis mengandung cathinone dan cathine Psychostimulant Khat Plant containing Cathinone dan Cathine Cathinone and Cathine
  • 35. 35Journal of Data on the Prevention and Eradication of Drug Abuse and Illicit Trafficking (P4GN) Year 2013 Edition 2014 1 2 3 4 5 6 9. (1-pentyl-1H-indol-3-yl)-1- naphthalenyl-methanone Halusinogen, effect cannabinoid and toxic JWH-018 Syntetic cannabinoid 10. (1-(5-fluoropentyl)-1H-indol-3- yl)2,2,3,3-tetramethylcyclopropyl)- methanone Halusinogen, effect cannabinoid and toxic XLR-11 Syntetic cannabinoid 11. 5-fluoroAKB48 Halusinogen, effect cannabinoid andtoxic 5-fluoro AKB 48 Syntetic cannabinoid 12. MAM2201 Halusinogen, effect cannabinoid and toxic MAM 2201 Syntetic cannabinoid 13. N,N-2-dimethyl-1-phenylpropan-2- amine Stimulan, lower than the effect of methamphetamine DMA (Dimethylam- phetamine) Phenethylamine Derivative 14. 5-(2-aminopropyl)benzofuran Stimulan, empathogenic 5-APB Phenethylamine Derivative 15. 6-(2-aminopropyl)benzofuran Euphoria 6-APB Phenethylamine Derivative 16. 1-(4-methoxyphenyl)-N-methyl- propan-2-amine Stimulan, halusinongen, insomnia and Sympathomimetic PMMA Phenethylamine Derivative 17. 2-(4-Bromo-2,5- dimethoxyphenyl)ethanamine Hallusinogen 2C-B Phenethylamine Derivative 18. 1-(4-chloro-2,5-dimethoxy- phenyl)propan-2-amine Euphoria, archetypal psychedelic DOC Phenethylamine Derivative 19. 2-(4-Iodo-2,5-dimethoxyphenyl)-N- [(2- methoxypehyl)methyl]ethanamine Stimulan, halusinogen, and Toxic 25I-NBOMe Phenethylamine Derivative 20. 2-(4-Bromo-2,5-dimethoxyphenyl)- N-[(2- methoxypehyl)methyl]ethanamine Stimulan, halusinogen, and Toxic 25B-NBOMe Phenethylamine Derivative 21. 2-(4-Chloro-2,5-dimethoxyphenyl)- N-[(2-methoxypehyl)methyl]etha- nemine Stimulan, halusinogen, and Toxic 25C-NBOMe Phenethylamine Derivative 22. 1-benzofuran-4-ylpropan-2-amine Stimulan, halusinogen, and Toxic 4 APB Phenethylamine Derivative 23. 1-Benzylpiperazine Euphoria, Increasing heart rate, dilated pupils, and Toxic BZP Piperazine Derivative 24. 1-(3-Chlorophenyl)piperazine Euphoria, Increasing heart rate, dilated pupils, and Toxic mCPP Piperazine Derivative 25. 1-(3- Trifluoromethylphenyl)piperazine Euphoria, Increasing heart rate, dilated pupils, and Toxic TFMPP Piperazine Derivative 26. 2-(1H-indol-3-yl)-1-methyl- ethylamine Euphoria, empathy, psychedelic, stimulan, dan anxiety αMT Tryptamine Derivative 27. Mitragyna speciosa mengandung mitragynine dan speciogynine Opiat and cocaine like effect Kratom containing mitragynine and speciogynine Plant / Pollent 28. 2-(2-chlorophenyl)2- (methylamino)cyclohexan-1-one Hallusination, euphoria, psychotomymetic Ketamine Ketamine 29. (RS)2-(3-methoxyphenyl)-2- (ethylamino)cyclohexanone Halusinasi, euphoria, psychotomymetic Methoxetamin Ketamin Derivative Source : Center for Drug Testing Laboratory BNN, March 2014
  • 36. 36Journal of Data on the Prevention and Eradication of Drug Abuse and Illicit Trafficking (P4GN) Year 2013 Edition 2014 2. Demand Reduction. a. Results of BNN National Survey on Drug Abuse and Illicit Trafficking in the Sector of Transportation, 2013. 1) Methodology. a) Study Design. The study applies the cross-sectional approach targeting workers of transportation modes. Data collection is carried out through the qualitative and quantitative method. b) Study Location. Conducted in 23 provinces with the province capital as the main study location, considering that the central offices of transportation are located in the center of the city. For example, airways companies, Railway company, shipping companies, general transportation, taxi companies, etc. Purposive selection is made on provinces based on the mapping of transportation modes (land and sea transportation). The mapping shows that several transportation are available at each province. The selected provices are: Aceh, North Sumatera, West Sumatera, South Sumatera, Riau, Lampung, Ruiau Isands, Banten, Jakarta, West Java, Central Java, East Java, Bali, West Kalimantan, Central Kalimantan, East Kalimantan, North Sulawesi, South Sulawesi, S.E. Sulawesi, West Nusatenggara (NTB), Maluku and Papua. c) Population and Number of Samples The sector of land transportation accomodates thelargest amount of worker population, approx. 6,010,042 of a total 8,056,307 workers in the whole sector of transportation (BPS 2010). Air transportation absorbs 1,046,607, sea transportation 721,261, and ASDP (Water, Lake and Water Crossing) 211,205, and the railway company has the smallest number of workers, namely, 67,131. From these data a proportion is made for the respective sub-sectorsin order to accomplish their representation, and be able to assume the following probability:
  • 37. 37Journal of Data on the Prevention and Eradication of Drug Abuse and Illicit Trafficking (P4GN) Year 2013 Edition 2014 Table 65. Estimated Proportion of Transportation Workers LAND TRANSPORTATION TRANSPORTASI LAUT OTHERS INTER- CITY TRANS PORTA TION CITY TRANS PORTA TION KERETA API ASDP: FERRY/ RIVER CROSSING NATIONAL SHIPPING (PASSENG ERS) NATIONAL SHIPPING (GOODS) Estimated worker population 75% 5% 1% 9% 10 % Sub-sector assumed estimation 35% 40% 3% 3% 4,5% 4,5% 10% The number of study samples is based on the Lemeshow formula, and the data from the Study on Drug abuse workers in 2012, by using the following formula: With this statitiscal assumption: 1). Estimation of one proportion with 95% trust, 19% reliability, design effect (deff); 2). Based on this calculation the established number of samples in each sector of transportation is 315 respondents. The survey was able to collect data from more than 10,000 target respondents and its realization at the end of the survey, as is shown in the table below: Table 66. Target and Realization of the Survey at the Sector of Transportation LAND ASDP (CROSSING) RAILWAY SEA Target 7.590 352 352 920 Realization 7.628 341 386 896 2) Results. a) Characteristic. The majority of respondents are above the age of 30 years (76%), with an average of 37, although this varies in the different modes of transportation. An average of a younger age is found in the air and railway transportation modes. The majority of respondents are married and live with the family, or relative. Domination of male workers is truly felt in the sector of transportation, as most of the respondents are males (97%). From the aspect of education, almost all respondents are from secondary education, the largest proportion among railway workers. Respondents with a higher education are found in the air and sea transportation. 2 2 2/1 )1( d PPz n    X deff (design effect)
  • 38. 38Journal of Data on the Prevention and Eradication of Drug Abuse and Illicit Trafficking (P4GN) Year 2013 Edition 2014 Table 67. Respondent’s Characteristic VARIABLE SEA LAND ASDP (CROSSING) RAILWAY N 896 7628 341 386 Age (years) Mean 39 38 38 31 Median 39 37 37 27 SD 10 9 11 10 < 30 19,6 19,6 26,3 59,5 ≥ 30 80,4 80,4 73,7 40,5 Gender Male 98,4 99,5 100 98,2 Female 1,6 0,5 1,8 Education No response 0,1 0,2 0,5 No education/not finished elementary 1,3 7,0 8,8 0,8 Passed Elementary/equivalent 4,1 11,8 12,9 1,8 Passed Junior High/equivalent 6,8 30,1 20,2 6,7 Passed Senior High/equivalent 39,8 47,3 41,9 79,0 Passed Academy/Higher education/PT 47,8 3,6 16,1 11,1 Marital Status No response 0,2 0,0 0,3 Not married/single 12,8 11,3 16,7 39,6 Married 85,2 86,7 81,8 60,1 Widow/widower 0,7 0,4 0,3 Divorced 1,1 1,3 0,9 Living together 0,1 0,3 b) Drug Abuse PRevalence The prevalence of drug abuse is measured by applying 3 approaches of drug use: lifetime (ever used), pastyearand past month (current user). This report focuses on the past year use, since this gives an illustration of the present drug abuse situation. The prevalence of current user indicates a potential drug abuser high addiction with compulsion of routine drug consumption.
  • 39. 39Journal of Data on the Prevention and Eradication of Drug Abuse and Illicit Trafficking (P4GN) Year 2013 Edition 2014 (1) Drug Abuse Prevalence Based on Lifetime Use (Ever used) The lifetime drug abuse prevalence among workers is relatively high (18.9%), or 1 of 5 workers has at least taken a drug once in his/her lifetime. This rate is the highest among workers of land transportation, 20% and 19%, while the lowest rate is among workers of railway transportation (5.75%). Table 68. Lifetime, Past Year and Past Month Drug Abuse Prevalence VARIABLE SEA LAND ASDP (CROSSI NG) RAIL- WAY TOTAL Lifetime 16,2 20,1 16,1 5,7 18,9 Past Year 5,4 7,6 9,7 0,8 6,9 Past Month 1,0 2,9 4,7 0,0 2,5 Likewise with past month (current user) drug abuse prevalence that shows a relatively high rate (6.9%), with the highest prevalence rate of 9.7% among workers of ASDP (Crossings) and 7.6% among workers of land transportation. Past month prevalence of drug abuse is detected in all modes of transportation except railway. This condition indicates that there are still workers who routinely take the drug in their daily work. A prevalence of 2.5% is found in all modes of transportation, indicating the highest for ASDP and land transportation. Based on the age group of respondents, the lifetime drug abuse prevalence is higher among the group below 30 (20%) compared to above 30 (18%). The highest prevalence rate is concentrated in the group with and higher education (the minimum of diploma or higher), indicating a prevalence of 19.5% in both groups. Based on marital status, drug abuse prevalence is higher among the divorced group (27.5%), compared to the single and married groups, respectively 22% and 18%.
  • 40. 40Journal of Data on the Prevention and Eradication of Drug Abuse and Illicit Trafficking (P4GN) Year 2013 Edition 2014 Apparently, income of a worker also has an influence on drug abuse. Among respondents with a higher income drug abuse prevalence is also higher. Respondents with an income of more than Rp 10 million have a greater proportion (23%) compared to those with less earnings, below Rp. 10 million. This survey also discovered that workers with different status show variable prevalence. Temporary workers indicate a higher percentage of prevalence (20%) than permanent workers (17%). The pattern of drug prevalence in the past year is not much different to lifetime abuse. Based on age group, the percentage of past year drug abuse is greater in the group below 30 (8.7%), and above 30 (6.2%).This pattern is somewhat different for lifetime abuse in the group with educational background. A higher rate is seen among the group of secondary education (7.4%), while the group with lower education (< Elementary) 6.2%, and the group with higher education (D1) 5%. Based on marital status the rate is higher among the singles/not married (9.7%), and married (6.2%). Most interesting is the group without marital status, but live together. They tend to have a higher prevalence rate of drug abuse. However, since the samples are relatively small in number, it is not possible to make a generalization. Likewise with lifetime drug abuse among loose workers, or who have no permanent job. They have a higher prevalence for past year drug abuse (9.1%) than workers with permanent jobs or contracted. From the aspect of earnings, prevalence is different lifetime drug abuse. Respondents with lower earnings tend to have a higher rate of prevalence. (2) Drug Abuse Based on the Level of Drug Dependency Table 69. Drug Abuse Prevalence Based on the Level of Dependency (Experimental use, Regular use, Non-IDU, IDU) DRUG DEPENDENCY SEA LAND ASDP (CROSSING) RAILWAY TOTAL Experimental 4,13 4,61 6,16 0,78 4,36 Regular 1,23 2,43 2,93 0,00 2,03 Non-IDU 0,00 0,46 0,59 0,00 0,38 IDU 0,00 0,12 0,00 0,00 0,09
  • 41. 41Journal of Data on the Prevention and Eradication of Drug Abuse and Illicit Trafficking (P4GN) Year 2013 Edition 2014 Based on the level of dependency, drug abuse prevalence indicates the number of experimental drug use, or those who are in a condition of dependency, either for recreational purposes or due to addiction. The prevalence rate for experimental use is 4.4% in all modes of transportation, the highest (6.2%) is reported among workers of ASDP (Crossings), land transportation (4.6%) and sea transportation (4.6%). Prevalence rate of 2.3% for regular use indicates the routine use of drug for recreational purposes as well as to ease their dependency/addiction. Regular drug abuse is found at all modes of transportation except railway, the highest prevalence among ASDP and land transportation. IDUs are also reported among workers of land and ASDP transportation. 3) History of Drug Abuse a) First Drug Abused The first drug abused among worker respondents of transportation is quite variable, from cannabis/marihuana, ecstasy, nipam, and shabu. The prevalence of first time drug use (cannabis) is the highest (11.94%), followed by ecstasy (1.32%), shabu and all its kinds (0,91%), koplo pill and all its kinds (0.50%), nipam (0.27%) and dextro (0.77%). Cannabis and ecstasy have become very common as the first drug, that may indicate the easy acquisition of both these drugs. The prevalence of first use drugs according to the transport modes, pattern of drugs use does not have a big difference with the prevalence of the first drugsuseaccording to the types of drugs. Types of drugs: marijuana, ecstacy, shabu and methamphetamine are popular among the first use level according to the transportation modes. Marijuana is the highest number (13.1%) used by the land transport mode workers, followed by the sea transportation mode workers (9.8%). While ecstacy is more popular among the group of ASDP workers (2.0%), the inland transportation mode workers (1.4%) and sea transportation mode workers (1.2%). The other type of drugs that popular for the first use is shabu, it has the highest prevalence among the land transportation workers (1.14%) and ASDP transportation workers (0.9%).
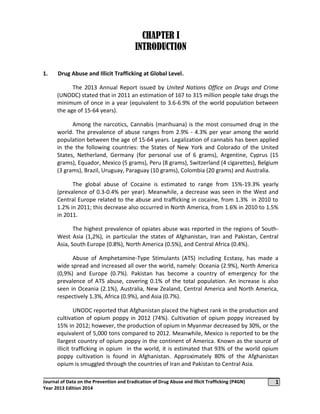
  • 42. 42Journal of Data on the Prevention and Eradication of Drug Abuse and Illicit Trafficking (P4GN) Year 2013 Edition 2014 11,7 0,8 15,8 1,2 10,1 0 3,9 0,3 0 2 4 6 8 10 12 14 16 18 Ganja Hasish (getah ganja) Laut Darat ASDP Kereta api 1 4,3 1,2 3,4 0,7 4,9 0,7 5,2 0 8,9 0 7,1 0,3 1,3 0,3 0,8 0 2 4 6 8 10 Laut Darat ASDP Kereta api 0 0,1 0,2 0,3 0,4 0,5 0,6 0,7 0,8 0,9 1 Luminal,fenobarbital, (barbiturat) Nipam Pilkoplo, Rohypnol,mogadon Valium Xanax,Camlet/calmlet (alprazolam) Dumolid Kokain Ketamin Laut Darat ASDP Kereta api The first use of opiates such as heroin, putau, morphine and opium, was also reported among workers of transportation, generally, the prevalence is relatively low, below 0.1%. The highest was detected in the use of codein, 0.8%. The use of opiates is found in all modes of transportation, in exception of railway. The highest prevalence is reported for codein among workers of land transportation (0.4%) and morphine among ASDP workers (0.29%), sea transportation (0.11%), while heroin was only found in the ASDP transportation (0.04%). Other drugs that are used as the first drug are tranquillizers: koplo pill, BK, mogadon, valium, rohipnol, dumolit and Xanax. The highest prevalence among these drugs is respectively for koplo pill (0.50%), nipam (0.27%). The prevalence of other drugs in this groups is below 0.1%, valium (0.08%), dumolid (0.03%), and Xanax/camlet (0.02%). 0 0,2 0,4 0,6 0,8 1 1,2 1,4 1,6 1,8 Laut Darat ASDP Kereta api Figure 1. First abuse of Cannabis Figure 2. First Abuse of ATS Figure 4. First Abuse of TranquillizersFigure 3. First Abuse of Opiates Cannabis Hashish Sea Land Railway Sea Land Railway Sea Land Railway Sea Land Railway
  • 43. 43Journal of Data on the Prevention and Eradication of Drug Abuse and Illicit Trafficking (P4GN) Year 2013 Edition 2014 This survey also shows the prevalence in the use of over-the- counter drugs, e.g. drugs for head ache relief, cough syrups, and analgesics. The use of these medicines becomes the drug abuse when used excessively, mixing the drug with alcoholic drinks or soda drinks with the purpose to become intoxicated, or fly. The most drug used in excess in this groupare medicines for head ache relief (1.18%), mixed with soda drinks (0.59%) among ASDP workers, and dextromethorphan (0.93%) among land transportation workers. b) Age of First time Drug Use The first age of drug use among transportation workers is the average of 20 years (median 20 years, Elementary 5 years). From the aspect of age for the first drug use, the majority (95%) had the first drug at the age of <30 years. Some (47%) are < 20 years, and another part (48%) between 20 – 29 years. This indicates a condition that the first drug use is done at an early age. In the sea transportation sector almost half portion of the workers (47%) consume drugs between 20-29 years, likewise with ASDP workers (46%). Among workers in the area of land transportation, the proportion of first time drug abuse is somewhat the same in the group below 20 years (47%) and between 20-29 years (48%). In the railway sector the majority of workers (80%) take drugs <20 years. Table 70. Distribution of Respondents Based on Age for First time Drug Abuse VARIABLE SEA LAND ASDP RAILWAY TOTAL N Age group < 20 36,1 46,9 42,0 80,0 47,1 20 – 29 56,3 48,2 52,0 20,0 47,6 30 – 39 5,9 4,0 6,0 4,3 ≥ 40 1,7 0,9 0,9 Mean 21 20 19 17 20 Median 20 20 20 17 20 SD 5 5 7 3 5
  • 44. 44Journal of Data on the Prevention and Eradication of Drug Abuse and Illicit Trafficking (P4GN) Year 2013 Edition 2014 c) First Time Drug Abuse This study also shows that first time drug abuse is done before entering the working world than after. The prevalence of drug abuse after having a job is half the proportion than drug taking before becoming a worker. The prevalence of transportation workers before having a job is approx.. 11%, while drug taking after having a job is 6%. The prevalence of drug abuse based on transportation mode does not differ so much. However, the rate of drug abuse before work among land transportation workers (12%) is higher than the three other modes of transportation. The high prevalence rate of the first drug taking after having a job is of much concern. From the aspect of transportation mode, the prevalence rate among ASDP workers is the highest (8%), followed by land transportation (7%), and sea transportation (5%). Based on lifetime drug abuse the proportion of drug taking before having work reaches 64%, while the remaining 36% starts drug taking after entering the working world. This condition suggests that illicit drug trafficking is present among the workers of transportation, or there is a tendency of drug use within a particular mode of transportation. The qualitative study indicates that drug taking is influenced by fellow workers of one profession, but generally not from the same company. It is assumed that fellow workers with the same profession from other regions have much influence in the initial drug taking for reasons to relieve boredom and weariness. The lowest prevalence rate is reported among railway workers, since no one is reported taking drugs after entering the working environment. Table 71. Distribution of Respondents Based on First Time Drug use (Before of After Working) Based on Transportation Mode VARIABLE SEA LAND CROSSING RAILWAY TOTAL N Before entering the working world 8.9 11.7 7.3 4.1 10.9 After entering the working world 4.6 6.9 7.9 0.0 6.1 Never use a substance/drug 82.8 80.2 80.6 94.3 79.8 No response 3.7 1.1 4.1 1.6 3.2
  • 45. 45Journal of Data on the Prevention and Eradication of Drug Abuse and Illicit Trafficking (P4GN) Year 2013 Edition 2014 d) Drug Abuse Based on Type of Drug (Lifetime Drug Use) Lifetime drug abuse indicates a variation of different types of drugs consumed by transportation workers, although only once in a lifetime. The prevalence based on the type of drug shows that cannabis/ganja remains the most consumed (14.6%), in particular dried cannabis. The next is ATS, which are ecstasy, shabu, cathinone and amphetamines, with a prevalence rate of 7%. The third in rank are tranquillizers (2.3%) followed by opiates and hallucinogens (2.1%), inhalants (1.1%) and over-the-counter drugs, e.g. drugs for headache relief and dextro (2%). In the lifetime use for cannabis, the workers in the transportation mode the prevalence rate of workers in the sector of land transportation who take cannabis is the highest (16%), followed by sea transportation (12%), Crossings/ASDP (10%), and the lowest among railway workers (3.4%). In this group some workers have ever consumed hashish, indicating a prevalence of 1.2%. Based on mode of transportation, land transportation 1.2% and sea transportation 0.8%. The prevalence rate of opiates lifetime use among land transportation workers is (2%), sea (1.7%), ASDP (1.2%) and railway (0.8%). The most frequent drug used in the group of opiates is heroin (putau) 1.6%, morphine (1.1%), opium and codein respectively (0.7^) and (0.6%). Lifetime use for ATS is the highest among workers of ASDP (12.4%), followed by and transportation (7.4%), sea transportation (6%), and the lowest railway workers (2%). Ecstasy and shabu in the ATS group are the most frequently used, with a prevalence of respectively 4.9% and 4.6%. The prevalence for ecstasy is the highest in the ASDP sector(8.9%), then land transportation (4.9%). The highest prevalence rate for shabu is also found in the sector of ASDP (7.1%), followed by land transportation (5.2%). e) Drugs of Past Year Abuse Past Year drug abuse illustrates the many kinds of drugs consumed and circulating among transportation workers and the . The survey indicates that almost all kinds of drugs predicted being consumed by the community are apparently also consumed in the past year by transportation workers, although not in all modes of transportation.
  • 46. 46Journal of Data on the Prevention and Eradication of Drug Abuse and Illicit Trafficking (P4GN) Year 2013 Edition 2014 The most consumed drug by transportation workers in the past year is cannabis, with a prevalence of 4.9%. The use os ATS is also quite high, showing a prevalence of 2.3%. The prevalence for opiates, tranquillizers, hallucinogens and inhalants is below 1%. However these drugs belong to dangerous drugs. Among ATS the most consumed are ecstasy and shabu, with a prevalence of 1.4% for both drugs. Cathinone is also used with a prevalence of 0.3%. In the group of opiates, heroin (0.5%), morphine (0.4%) and opium (0.2%). Tranquillizers: luminal (0.4%), koplo/BK (0.5%), and phenobarbital (barbiturate) 0.1%. In the group of hallucinogens, the most consumed are mushroom (0.3%), kecubung (0.3%), another is LSD (0.1%), still in circulation. Among over-the- counter drugs, the most frequently used is dextromethorphan (0.7%). Past year drug abuse based on the transportation modeshows a quite high rate i8n s certain mode. The majority of sorkers in the sector of land transportation take cannabis with a prevalence of (5.7%), followed by ASDP workers (4.1%), and sea transportation (3.9%). Past year opiates abuse, in particular heroin, is also found among ASDP and land transportation, railway and sea transportation with a prevalence of consecutively (0.6%), (0.5%), (0.3%) and 0.1%). The abuse of ATS (ecstasy) is found in all modes of transportation with the exception of railway. The prevalence is respectively for ASDP the highest (4.1%), land (1.6%), and sea (1.6%). Consumption of shabu is also seen in the past year among workers os ASDP (3.6%), land (1.7%) and sea (1.1%) Consumption of tranquillizers is not evenly spread in all modes. The most consumed are koplo pill/BK, valium and nipam in the ASDP mode. Valium in all modes except railway, while koplo pill and nipam in ASDP, land and sea transportation. In the group of hallucinogens, mushroom is used among workers of land and sea transportation. Over-the-counter drugs in all modes except in the railway transportation.
  • 47. 47Journal of Data on the Prevention and Eradication of Drug Abuse and Illicit Trafficking (P4GN) Year 2013 Edition 2014 f) Frequency of Drug Abuse Some concerns were much discussed in relation with drug abuse in the modes of transportation, in particular on the time, quantity and frequency of drug abuse among the workers. The impact of drug abuse before or during work certainly influences the workers’ performance and concentration in doing their task. The prevalence of frequency in the consumption of drugs among transportation workers is classified into always, frequently and rarely. The majority of workers admit having consumed drugs eithr before, during and outside work hours. The frequency of drug abuse based on the mode of transportation indicates that workers who always take drugs before work the prevalence is (0.2%), and reported in the land and sea transportation. Those reporting frequently before work (0.5%) are in all modes of transportation, except Railways. A higher prevalence is reported for rarely before work (3.7%). A similar pattern is seen for drug abuse outside work hours, but generally the prevalence shows a higher rate. Repondents reporting always has a prevalence of (0.2%), detected in land and sea transportation. While those reporting frequently (1.7%) are in all transportation modes except Railways. The prevalence for those reporting rarely is relatively higher (4.7%), als9o reported in all transportation modes except Railways. Workers reporting taking drugs during work activites has a lower prevalence than those taking drug before or outside work hours. Workers reporting “frequently” and “always” take drugs during work are detected in the land and sea transportation, with a prevalence of respectively (0.1%) and (0.3%), while those reporting : rarely” (2.6%) are in all modes of transportation, except Railways. 4) Risk Behavior : Smoking, Drinking and Unsafe Sex A number of risk behaviors are also explored in the study, such as smoking, drinking and unsafe sex. The prevalence of smoking among transportation workers is very high at all times of consumption, lifetime, past year and past month. It can be said that all workers have ever smoked (85%). Related to drug abuse, drug abusers have a somewhat higher rate of prevalence (95%) than non-drug abuser (82%). In other words, smoking is very closely related with the life of smoking workers, particularly with drug abusers.
  • 48. 48Journal of Data on the Prevention and Eradication of Drug Abuse and Illicit Trafficking (P4GN) Year 2013 Edition 2014 The prevalence of drinking among transportation workers is quite high, but its rate varies according to the time of consumption: lifetime, past year and past month. More than half the portion of respondents reported having at least ever taken alcohol in their lifetime (58%), a lower rate for those who reported past year consumption (41%), and past month drinking (23%). A higher prevalence of drinking is seen among drug abusers (95%), than among non-drug abusers, (52%) for lifetime, while past year drinking covers two-third of the number of drug abusers (68%) compared to non-drug abusers (36%). This condition illustrates that drinking behavior is closely related to drug abuse behavior. Lastly, unsafe sex. It can happen when this is done between non- permanent sex partners (husband/wife), and no use of condoms. The prevalence of sex with non-=permanent partners (husband/wife) is wuite high, with boy/girld friend (21%), with intimate friend (8%), acquaintance (6%), and sex worker (12%). The use of condoms during intercourse with non-permanent partners is relatively low, the prevalence of condom use with sex workers (8%), with boy/girl friend (11%), with a friend (5%), and acquaintance (3%). It can be said that unsaf sex behavior among transportation workers is relatively high. Other data confirm the consistent use of condoms with a sex partner is very low, indicating only a prevalence of (3%). 5) Understanding and Attitude Related to Smoking, Drinking and Drug Abuse a) Understanding on Drugs Understanding of drugs covers types of drug one has ever heard, effect of drug abuse, for example risk of injecting and HIV/AIDS, addiction, problem in managing the dose of drugs, and drugs destroys the brain and nerves. From 29 drugs circulating, respondents can only mention about 7 kinds of drugs. Related to understanding the effect of drugs respondents have relatively a good knowledge, except about the effect of the problem in managing the drug dose. The majority of respondents know that injecting has the the risk of HIV/AIDS infection (90%), drugs cause dependency/ addiction (87%), and drugs ruin the nerves (95%). The number of repondents who understand at least three effects of drug abuse is quite high (85%), Generally, the understanding of drug abusers on drugs and their effects is better than the non-drug abusers.
  • 49. 49Journal of Data on the Prevention and Eradication of Drug Abuse and Illicit Trafficking (P4GN) Year 2013 Edition 2014 Table 72. Knowledge on Drugs Based on the Substance ever Heard and Effect of Drug Abuse SEA LAND ASDP/ CROSSING RAILWAYS DA NDA DA NDA DA NDA DA NDA N 145 751 1,534 6,094 55 286 22 364 Total Substances ever heard Mean 10.0 7.9 8.3 5.9 8.1 5.8 9.9 8.6 Median 10.0 7.0 7.0 5.0 7.0 5.0 9.5 9.0 Minimum 0.0 0.0 0.0 0.0 1.0 0.0 1.0 0.0 Maximum 27.0 29.0 29.0 29.0 22.0 21.0 21.0 29.0 Effects of Drug Abuse know IDU has great risk for HIV/AIDS 90.3 79.2 81.9 73.8 78.2 71.7 86.4 80.2 Know the risk of addiction/ dependency 86.9 71.8 77.2 72.3 80.0 73.8 72.7 82.4 Know the problem of managing the dose of drugs 60.0 53.1 62.4 56.3 52.7 58.0 45.5 54.4 Know drugs ruin nerves/brain 95.2 83.5 87.3 82.4 83.6 79.0 86.4 89.0 Know≥ 3 effects of drug abuse 84.8 69.5 74.1 66.8 74.5 67.8 68.2 75.5 Note : DA = Drug Abuser NDA = Non-Drug Abuser b) Attitude Related to Smoking, Drinking, Drugs. The survey tries to explore the respondent’s attitude against the attitude of smoking, drinking and drug abuse. The survey shows that the attitude towards the three elements is generally positive as the majority of respondents showed an attitude against the variable as stated. The majority of respondents (90-96%) are against drinking 4-5 times/week, experiment with smoking cannabis, routinely smoke cannabis, experiment with heroin, occasionally take heroin, routinely take heroin, experiment with ecstasy, occasionally take ecstasy, and routinely take ecstasy. A greater tolerance is seen among respondents towards smoking than drinking and drugs, 1 out of 5 respondents agree with smoking 12-20 cigarettes per day. More Many non-drug abusers show an attitude against all variables than drug abusers. Table 73. Attitude of Disagreement Against Attitude to Smoking. Drinking and Drug Abuse. SEA LAND ASDP RAILWAYS DA NDA DA NDA DA NDA DA NDA N 145 751 1,534 6,094 55 286 22 364 Smoking 12-20 cigts/day 70.3 86.3 70.3 80.4 70.9 81.1 72.7 84.3 Drinking 4-5 times/week 87.6 93.2 84.6 92.9 89.1 94.1 90.9 95.9 Experiment with cannabis smoking 91.0 97.5 89.4 97.4 89.1 96.9 95.5 98.1 Occasionally smoke cannabis 92.4 96.9 91.3 97.9 92.7 96.5 95.5 98.6 Routinely smoke cannabis 96.6 97.5 95.0 98.2 92.7 96.5 90.9 98.6 Experiment with heroin 97.2 97.3 95.0 98.1 94.5 96.9 95.5 98.4 Occasionally take heroin 96.6 97.1 95.6 98.1 94.5 96.9 95.5 98.6 Routinely take heroin 97.2 97.3 96.1 98.2 94.5 97.2 95.5 98.6 Experiment with ecstasy 95.9 96.8 93.9 98.1 94.5 96.9 95.5 98.4 Occasionally take ecstasy 96.6 96.8 94.7 98.2 94.5 96.9 95.5 98.6 Routinely take ecstasy 97.2 96.9 96.0 98.0 94.5 96.2 95.5 98.6 Note : DA = Drug Abuser NDA = Non-Drug Abuser
  • 50. 50Journal of Data on the Prevention and Eradication of Drug Abuse and Illicit Trafficking (P4GN) Year 2013 Edition 2014 6) Respondent’s knowledge on the Access to Drugs in the Work Environment, a) Respondent’s Knowledge on the Access to Drugs. A large portion (58.5%) of respondents stated not knowing of an access to drugs in the work environment. Among all drug abusers a great portion know the access to drugs. 5% of respondents know and stated in getting quite easily even very easy to get drug within the work environment (1.7%). The statement of the avaibility of access with the work place is present in all modes of transportation except Railway. The survey shows that there is indication of drug trafficking in the transportation modes. Drug abusers know better whethter there is access to drugs in the work place. 13.6% of drug abusers respondents in the transportation modes stated quite easy to obtain druts in the work place. Respondents in ASDP are the largest of knowing that access for drugs is present in the work place. The percentage of those indicating access to drugs outside the work place is greater than access to drugs in the work place. 8.4% of respondents stated the access to drugs outside the workplace is quite easy. and some respondents even stated to get drugs very easily in the work environment (3.2%). Drug abusers know better about the access in getting drugs than non-drug abusers. Table 74. Prevalence of Respondent’s Knowledge on the Access to Drugs Within and Outside the Workplace SEA LAND ASDP RAILWAYS DA NDA DA NDA DA NDA DA NDA N 145 751 1,534 6,094 55 286 22 364 Access to drugs in the Workplace Very difficult 31.0 17.8 25.9 24.2 30.9 22.7 9.1 13.2 Quite difficult 13.1 4.4 22.0 11.0 12.7 5.9 0.0 3.8 Quite easy 9.0 0.9 14.8 3.6 16.4 2.1 4.5 0.0 Very easy 1.4 0.5 2.9 1.8 7.3 0.7 0.0 0.0 Unknown 44.8 75.6 34.1 59.1 32.7 67.5 86.4 82.1 No response 0.7 0.7 0.3 0.3 0.0 1.0 0.0 0.8 Access to drugs within the living environment: Very difficult 15.9 10.5 18.1 17.8 14.5 17.1 9.1 6.9 Quite difficult 17.2 5.3 21.8 10.4 14.5 7.0 0.0 4.7 Quite easy 15.2 3.2 19.3 6.2 21.8 3.1 13.6 3.3 Very easy 6.2 1.2 6.1 2.8 9.1 1.0 0.0 0.0 Unknown 44.8 79.2 34.4 62.5 40.0 70.3 77.3 84.3 No response 0.7 0.5 0.3 0.3 0.0 1.4 0.0 0.8 DA : Lifetime Drug Abuser NDA : Non Drug Abuser
  • 51. 51Journal of Data on the Prevention and Eradication of Drug Abuse and Illicit Trafficking (P4GN) Year 2013 Edition 2014 7) Inducing to Take Drugs. This survey indicates that workers in all modes of transportation are prone to drug abuse. 17.9% of all respondents in the transportation modes admit being offered to take drugs. Drug abusers are more frequently induced to take drugs, however workers in the sector of sea, land and ASDP are more vulnerable to inducement. Most of the people offering drugs are generally friends in the workplace, outside the dwelling place, and within the dwelling environment. The largest percentage of people offering drugs are friends witnin the dwelling environment (13.8%), friends in the workplace (9.1%), and outside the workplace (6.9%). It is known from the survey that many respondents mentioned drug traffickers are those who offer drugs. 4.5% - 11.7% of drug abuse respondents from all modes of transportation admit being offered drugs by a trafficker. Even passengers (1.8%) offered drugs to respondents. Schools/campus, rented houses/rooms, work place, in the street, discotheque/pub/karaoke, dwelling place, friend’s house, bus terminal/ station, hotel/motel/guesthouse are the places much mentioned by respondents being offered drugs. The most frequent places are friend’s house, workplace and discotheque/pub and karaoke (6.9%; 5.8%; and 5.3%). Table 75. Respondent’s Experience in the Offer to Drugs VARIABLE SEA LAND ASDP RAILWAYS DA NDA DA NDA DA NDA DA NDA N 145 751 1,534 6,094 55 286 22 364 Was ever offered drugs 42.8 6.7 53.1 12.8 43.6 9.1 31.8 2.7 Source of the offer Relative 0.7 0.7 1.7 0.4 7.3 0.3 0.0 0.0 Younger/older brother/sister 0.7 0.1 0.7 0.1 7.3 0.3 0.0 0.0 Parents 0.0 0.1 0.3 0.1 1.8 0.0 0.0 0.0 Boy/girl friend/partner/husband/ wife 1.4 0.1 1.5 0.2 7.3 0.3 0.0 0.0 Fellow worker 24.1 3.2 29.2 5.3 29.1 3.1 4.5 1.1 Outside work friend 20.0 2.7 22.2 3.6 32.7 2.4 22.7 2.7 Friend in the dwelling environment 33.1 5.6 42.1 8.5 56.4 7.3 27.3 3.0 Passenger 5.5 0.9 4.8 1.2 5.5 1.4 0.0 1.1 Dealer/trafficker 11.7 1.2 8.0 1.3 10.9 0.0 4.5 0.8 Others…… 2.8 0.1 4.1 0.6 5.5 0.3 0.0 0.3 Place of offer School/campus 9.7 1.1 7.1 0.8 1.8 0.3 13.6 0.5 Board/leased room/house 8.3 1.1 5.3 0.9 5.5 1.0 0.0 0.8 Workplace 15.9 2.3 19.4 3.4 25.5 2.1 4.5 0.5 Alley 7.6 2.0 14.9 2.7 16.4 2.4 18.2 0.8 Discotheque/pub/ karaoke 24.1 2.9 15.7 2.1 20.0 2.4 9.1 0.5 Own house 2.8 0.4 4.2 0.5 14.5 1.4 0.0 0.0 Friend’s house 22.8 2.7 23.5 3.4 25.5 1.4 9.1 2.2 Vehicle 6.2 0.9 5.3 1.1 10.9 1.0 0.0 0.0 Terminal/station 7.6 1.3 16.0 3.0 7.3 2.1 0.0 0.5 Hotel/lodging 5.5 0.9 3.7 0.5 3.6 0.7 0.0 0.5 Others…… 2.8 0.3 6.0 1.4 7.3 0.7 0.0 0.5
  • 52. 52Journal of Data on the Prevention and Eradication of Drug Abuse and Illicit Trafficking (P4GN) Year 2013 Edition 2014 8) Exposure to P4GB Program. a) Prevalence of Respondents having ever Heard of P4GN Program. Almost half the total of respndents (47.8%) from all transportation modes admit having heard information or have seen matters related to P4GN in the workplace. There is no distinct difference between drug users and non-drug users. This indicates that information related to drug has reached workers in all modes of transportation. Communication channels employed by agencies or companies in forwarding matters related to P4GN are very variable from banners, posters, advertisement boards on drug abuse, information, socialization on drug abuse, internal orders, and drug counseling. Respondents’ reponses indicate that the most mentioned are banners, posters or advertisement boards (82.2%), further also mentioned is information activities and order within the agency of company (48.9% and 44.8%). There is no great distinction seen in relation with communication channels among the respective transportation modes. Table 76. Distribution of Respondents having heard of P4GN Programs Based on Transportation VARIABLE SEA LAND ASDP RAILWAYS DA NDA DA NDA DA NDA DA NDA N 145 751 1,534 6,094 55 286 22 364 Have once received information related to P4GN in the work place 66.2 63.0 49.5 40.8 50.9 48.6 72.7 58.0 Information channels in the work place Banners. posters. advertisement boards on drug abuse 72.9 81.0 84.5 82.3 89.3 82.7 87.5 76.3 Information and socialization on drugs 71.9 58.1 38.2 40.6 35.7 48.9 68.8 63.0 Internal order. guidelines or sanctions on drug abuse 63.5 56.9 34.0 33.3 32.1 51.1 50.0 72.5 Counseling for drug prevention and handling of drugs 30.2 25.2 11.1 11.0 14.3 14.4 18.8 22.3 A similar information is acquired from the qualitative study that many informants are still unknown of the activities done in relation with P4GN activities. As was informed by a group of drivers who admitted they never knew of any activities/program on P4GN from any agency including the owner of the company.
  • 53. 53Journal of Data on the Prevention and Eradication of Drug Abuse and Illicit Trafficking (P4GN) Year 2013 Edition 2014 Likewise the informationacquired by stakeholders in the province stating that there are not many P4GN activities for workers in the transportation sector in his region. Even P4GN activities in their own environment are minimum. “There are no special activities (on P4GN)” (Manager for Sea and Air matters. Transportation Office, Banten). The reasons put forward because there are no guidelines from their superior or no budget available or they are not interested because it is not their problem or they are not profitable for the company. Some of the informants of the survey evaluate that the activities as well as the handling of drugs have not achieved the maximum result. as not all apparatus are involved and sanction for traffickers and drug abusers are controversial. Likewise the number of law enforcement is not proportional with the total population and drug traffickers for the control of drug circulation. b) Information of P4GN The most information source mentioned by respondents on the prevention and eradication of drug abuse are television, printing media (newspaper, and magazine), and other printing media like posters, billboards, banners and brochures (90.3%; 60.4%; and 49.3%). Only a few respondents (13.4%) mentioned their company as the source of information on P4GN. Likewise only 10.3% of respondents mentioned BNNP/BNNK. The agency directly involved with the transportation mode, Office of Transportation, wa only mentioned by 5.0% respondents. There is no distinct difference in percentage between drug users and non-drug users when asked about P4GN source of information. Likewise in the percentage among respondents in each transportation mode. It is much regretted that only a very few respondents mentioned their workplace, BNNP/BNNK and Office of Transportation as the source of P4GN information.
  • 54. 54Journal of Data on the Prevention and Eradication of Drug Abuse and Illicit Trafficking (P4GN) Year 2013 Edition 2014 Table 77. Distribution of Respondents Who Have Ever Received P4GN Information From The Transportation Mode Source of Information VARIABLE SEA LAND ASDP RAILWAYS DU NDU DU NDU DU NDU DU NDU N Source of information, types of drugs and dangers of drug abuse Television 92,4 93,1 92,2 90,1 90,9 88,8 100,0 94,0 Radio 40,7 39,4 37,1 31,3 23,6 28,0 59,1 40,9 Printing Media 69,0 61,0 61,2 57,3 54,5 58,4 72,7 72,8 Posters/billboard/banner/ brochures 55,9 47,3 52,8 46,7 50,9 34,3 54,5 59,6 Sticker/pamphlet/Handouts 42,1 31,7 28,4 24,2 23,6 21,3 45,5 38,2 Friends in the workplace 29,7 22,4 21,2 15,2 18,2 12,9 40,9 24,2 Friends outside the workplace 26,9 16,6 18,3 12,3 18,2 10,5 40,9 21,7 Relative/ family member 29,0 20,1 14,6 9,7 16,4 8,7 36,4 27,5 Religious Leader 35,2 25,7 19,5 14,3 16,4 12,9 54,5 32,7 Company in the workpace 27,6 20,6 9,1 8,1 9,1 15,4 22,7 33,0 BNN/BNNP/BNNK 25,5 16,2 9,7 6,1 5,5 7,3 36,4 19,8 Police 26,9 21,3 19,4 13,7 7,3 9,4 36,4 29,1 Hospoital 26,9 17,7 12,6 7,8 9,1 7,7 31,8 29,1 Community Health Center 17,9 12,5 9,6 5,8 5,5 5,2 31,8 19,8 Ministry of Transportation/Office of Transporttation 11,7 8,3 2,6 2,4 5,5 3,5 27,3 10,2 NGO 9,0 7,1 3,0 2,4 3,6 2,8 13,6 9,6 Others 2,1 1,3 1,6 1,1 1,8 2,4 0,0 2,2 c) Involvement in P4GN Activities. The survey also questioned respondent’s involvement in P4GN. 7.2% admitted being directly involved in the P4GN activities. The P4GN Program hopes that the more people become directly involved in P4GN activities, particularly become cadres or a task force in their respective workplace. The survey indicates that this expectation has not yet been fulfilled. Respondentsonly attended lectures/information, discussion/interactive dialogue, drug simulation, films/entertainment, trainings for cadres of a drug task force, and members of a drug task force. The most attended by respondents among these activities are information, and being involved in discussions/dialogues (9.7% and 3.1%).
  • 55. 55Journal of Data on the Prevention and Eradication of Drug Abuse and Illicit Trafficking (P4GN) Year 2013 Edition 2014 Table 78. Distribution of Involvement in P4GN Programs Based on the Source of Information In the Transportation Mode. VARIABLE SEA LAND ASDP RAILWAYS P BP P BP P BP P BP N =all 145 751 1534 6094 55 286 22 364 Involved in P4GN 21.4 20.1 10.2 7.4 16.4 12.6 40.9 18.7 N respondents involved 31 151 157 452 9 36 9 68 Information source Lectures/Information 74.2 82.8 79.0 86.3 77.8 91.7 66.7 76.5 Discussion/interactive dialogue 22.6 23.8 23.6 20.6 11.1 8.3 11.1 20.6 Drug simulation 19.4 21.2 12.7 11.5 11.1 2.8 0.0 11.8 Films/entertainment 32.3 19.9 15.9 12.4 11.1 16.7 44.4 36.8 Training for cadres of drug task force 19.4 8.6 5.7 4.6 0.0 8.3 22.2 5.9 Drug Task force 9.7 4.0 3.2 1.8 0.0 2.8 0.0 2.9 Others 0.0 2.0 0.0 2.2 11.1 2.8 11.1 4.4 One interesting example of drug prevention activities combined with land greening/reforestation was conducted by a company in East Java. This activity may be an example for companies or government agencies in implementing P4GN activities. “... As I was never involved, but was told by friends. Usually there are campaigns. I once heard, but I was not involved, in connection with the International Anti Drug Day, there was a program in mangrove planting” (Manager, East Java Shipping Company). Another interesting example is the collaboration between BNNP and a company in the prevention of drugs by printing 5,000 stickers to be placed on buses and other strategic places to be read by many people. “From us only support what is been planned by government and the relationship shape we distributed by making stickers that there is an obligation on the stickers regarding to suggestion such as do not use drugs more less during 2 years...,” (Indept Interview of PO Sulsel Bus Manajer).
  • 56. 56Journal of Data on the Prevention and Eradication of Drug Abuse and Illicit Trafficking (P4GN) Year 2013 Edition 2014 “We don’t have organization so we just an ordinary company. Nevertheless we support government in this case National Narcotic Board (BNN) by distributing stickers that socialized the risk of the drugs use and they distributed everywhere, thati is our support. “Yes supporting means our shape kepedulian to government in this case BNN in giving information to society about the risk of drugs use. This is just a support by giving and making the stickers and it is enough great amount sir if I am not mistaken it is 5000 pieces and that is just from PO.liman its self and give them to the BNN for distributing to society and sticking on the our buses and or other public places..,“ (Indept Interview of PO Sulsel Bus Manager). The survey did not find special regulations that manage drug abuse in the company, except in the airline companies. These regulations are usually included in the work order, or in the employee’s pocket book. Airline companies employ this regulation on the basis of international statutes. Regulations on drug abuse are seldom found within the companies as this is not regarded as a crucial problem. Companies and government agencies do not execute P4GN activities as it is not their duty, since they do not obtain any profit in doing these activites. Moreover, no funds available, not yet thought about, no guidelines, or waiting for guidelines from the management. 9) Quality of Life Related to Work. This study distinguishes the group of non-drug use, ever-used (lifetime), and past year use (current users). In the group of non-drug use the average total score of the quality of liferelated to their work is more than 80 in all sectors. The highest score is found in the sector of sea transportation, while the lowest in the land transportation. Likewise in the group of ever used (lifetime) that shows more or less the same indication. In the group of current users (past year use) in the sector of railways, this phenomenon is somewhat highest compared to lifetime use, namely 84:85. However, overall, among the three groups current users (past year use) have relatively a lower quality of life related to their work compared to lifetime and non-drug use.