
Recomendados
Recomendados
Mais conteúdo relacionado
Semelhante a Food PPT.pptx
Semelhante a Food PPT.pptx (20)
Último
Último (20)
Food PPT.pptx
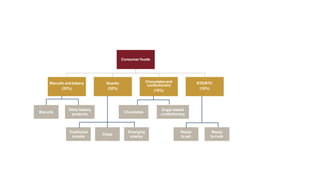
- 1. Consumer foods Biscuits and bakery (33%) Snacks (32%) Chocolates and confectionery (18%) RTE/RTC (16%) Biscuits Other bakery products Chocolates Sugar-based confectionery Ready to cook Ready to eat Emerging snacks Chips Traditional snacks
- 2. Consumer foods Biscuits and bakery (33%) Snacks (32%) Chocolates and confectionery (18%) RTE/RTC (16%) Biscuits Other bakery products Chocolates Sugar-based confectionery Ready to cook Ready to eat Emerging snacks Chips Traditional snacks Consumer Foods
- 3. Snacks FY22E-408 billion 17% Chips 14% 14% 15% 14% 15% 15% Traditional snacks 16% 12% 13% 13% FY 22 FY 23 FY 24 FY 22 FY 23 FY 24 FY 22 FY 23 FY 24 24% 22% 18% 17% 20% 20% 20% 14% FY 22 FY 23 FY 24 Chocolates 12% 12% 14% 13% Hard boiled candies 13% 15% 14% 14% FY 22 FY 23 FY 24 FY 22 FY 23 FY 24 FY 22 FY 23 FY 24 FY 22 FY 23 FY 24 FY 22 FY 23 FY 24 Chocolatesand confectionery FY22E-263 billion RTC/RTE FY22E— 228 billion 26% 17% 18% 17% 17% 22% 21% 17%
- 4. 24% 22% 18% 17% 20% 20% 20% 14% Emerging snacks Traditional snacks FY 22 FY 23 FY 24 17% Chips 14% 14% 15% 14% 15% 15% % FY 22 FY 23 FY 24 Chocolates 12% 12% 14% 13% FY 22 FY 23 FY 24 FY 22 FY 23 FY 24 FY 22 FY 23 FY 24 FY 22 FY 23 FY 24 FY 22 FY 23 FY 24 FY 22 FY 23 FY 24 E T R / C T R s k c a n S Chocolates FY22E-263 billion RTC/RTE FY22E—228 billion 16% 12% 13% 13% 26% 17% 18% 22% 21% 17% 17% 17% Snacks FY22E-408 billion Heat & Eat Instant Noodles Sauces & Spreads Pasta
- 5. Category FY22 gVolume gRealization Traditional snacks 8% 8% Chips 9% 8% Emerging snacks 8% 7% Chocolates 7% 5% Hard boiled candies 8% 5% Heat & eat 14% 10% Instant noodles 8% 6% Sauces and spreads 12% 6% Pasta 14% 10%
- 6. Commodity FY21 FY22 FY23P Key ingredient for Rationale for FY23 Wheat -3% 5% 3% Biscuits, bread, cakes, RTE/RTC We expect prices to rise on account of rising export opportunity due to the Ukraine crisis, but the government can curb exports Maize 4% 21% 6% Snacks, RTC/RTE Maize prices expected to remain strong on account of rising exports Sugar 0% 6% 10% Biscuits, chocolates, RTE/RTC Prices expected to increase in fiscal 2023, due to diversion of sugarcane towards ethanol production and a pick-up in industrial demand Butter 2% 4% 7% Biscuits. chocolates Higher fodder prices will lead to an increase in milk procurement and higher butter prices in fiscal 2023 Palm oil 23% 36% -5% Snacks, RTE/RTC As the supply crunch in sunflower oil normalises due to the Ukraine crisis, prices are expected to fall Potato -12% -40% 3% Snacks We expect to see an uptick in prices in fiscal 2023. due to waterlogging Cocoa 2% 5% 4% Chocolates Prices to remain strong into fiscal 2023, with depreciating rupee due to the Ukraine crisis Milk -3% 16% 3% Biscuits, chocolates High fodder cost will drive milk prices in fiscal 2023
- 7. Source: Company reports, industry, CRISIL Research 235 343 386 423 468 518 132 219 234 263 298 339 188 324 352 408 463 528 157 190 228 270 321 625 69 1,043 1,163 1,322 1,499 1,707 FY16 FY20 FY23P FY24P (Rs billion) RTE/RTC FY21 Snacks FY22E Chocolates and confectioneries Bakery products Packaged foods 12% 13-15% 12-14% 13-15% Source: Company reports, industry, CRISIL Research 235 343 386 423 468 518 132 219 234 263 298 339 188 324 352 408 463 528 157 190 228 270 321 625 69 1,043 1,163 1,322 1,499 1,707 FY16 FY20 FY23P FY24P (Rs billion) RTE/RTC FY21 Snacks FY22E Chocolates and confectioneries Bakery products Packaged foods 12% 13-15% 12-14% 13-15%
- 8. Source: Company reports, industry, CRISIL Research 235 343 386 423 468 518 132 219 234 263 298 339 188 324 352 408 463 528 157 190 228 270 321 625 69 1,043 1,163 1,322 1,499 1,707 FY16 FY20 FY23P FY24P (INR Bn) RTE/RTC FY21 FY22E Chocolates and confectioneries Bakery products Packaged foods 13-15% 12-14% 13-15% Snacks
- 9. 96 108 121 136 24 28 33 39 63 78 95 116 3.1 3.8 5 6 Heat & Eat Pasta FY21 FY22E Sauces and Spreads FY23P FY24P Instant noodles 50 92 100 134 130 147 39 81 87 102 116 133 75 151 165 249 216 190 FY16 FY20 Emerging snacks FY22E FY24P (Rs billion) FY21 Chips FY23P Traditional snacks (INR Bn) (INR Bn)
- 10. 77 140 149 167 187 214 42 79 85 96 110 126 FY22E FY24P (INR Bn) FY16 FY20 FY21 Sugar based candies Source: Company reports, industry FY23P Chocolates 62- 65% 12- 14% 5-7% 12- 13% FY21 Others 3-4% Chocolates ~64% Sugar Confectionary ~36% Market Share (INR Bn)
- 11. 15.3% 11.6% 12.3% 11.3% 13.1% 13.7% 13.2% 11.0% 11.7% 15.5% 15.3% 16.8% 16.0% 16.0% 13.0% 12.0% FY16 FY17 FY18 Bread and Bakery FY19 FY20 Snacks FY24P FY21 FY22E FY23P Chocolates and confectionary RTE/RTC
- 12. Increase Sales Increase Distribution Increase Product Range Pricing Incremental Demand Bigger share on the shelves Higher Penetration New Channels (Ecom) New Markets/Regions New Product Launches New Varities in existing brands New Brands Discount Policy Pushing Custormers towards premium products Pushing Large size packages Covering the Entire Needs Pyramid Find New Customers