SlideShare uma empresa Scribd logo
1 de 4
Baixar para ler offline
The Real Estate Report
While the median price for single-family, re-sale
homes rose for the fourth month in a row, year-
over-year, in September, it has been down month-
over-month for the past two months. The median
price for condos/townhomes fell year-over-year last
month, and it has been lower than the month
before three of the past five months.
Sales, meanwhile, have been anemic. Home sales,
compared to the year before, have been lower
eleven of the past fourteen months. Home sales
have been lower than the month before four
months in a row. While condo sales have been
higher than the year before the last two months,
they have also been lower than the month before
four months in a row. Year-to-date, home sales are
down 7.0% and condo/townhome sales are off
4.3%.
The sales price to list price ratio for homes, which
is a good indicator of demand, while still over
100%, has gone from being over 110% for most of
last year to under 110% for most of this year.
The ratio for condos/townhomes spent much of
2015 north of 105%. This year it has been south of
105%.
SCAMMERS POSING AS YOUR REAL ESTATE AGENT
I was reading this article in Money Magazine and
decided to share it with you.
There’s a scam afoot, or, shall we say, a-wire that
prospective homebuyers may want to be on the
lookout for, and it happens like this: You’re nosing
around the real estate market — maybe even close
to buying a house or piece of property. And then
you get a message from your real estate agent
urging you to wire money to secure the deal.
As you might have guessed, a scammer is
spoofing your real estate agent’s account and is
waiting for your money.
HOW A SCAMMER FINDS THEIR TARGET
Hackers snatch passwords when people log into
free Wi-Fi networks or click on things like those
cute-puppy emails. They search your inbox or your
real estate agent’s inbox for any messages related
to real estate transactions. Once they find you’re in
the process of buying a home, they’ll send a fake
message from your agent or attorney, title
representative (or other trusted source), alerting
you to new money wiring instructions to a
fraudulent account. Once your money is wired, it’s
likely gone for good.
To read the full article, click on this link:
http://time.com/money/4481906/real-estate-scam/
Hill & Company
1880 Lombard Street
San, Francisco 94123
Fax: (415) 202-1686
Cell: (415) 819-2663
AnnieWilliamsSF@gmail.com
http://www.anniewilliamshomes.com
DRE #01393923
Annie Williams
Annie Williams | Fax: (415) 202-1686 | AnnieWilliamsSF@gmail.com
Market Moderating
Local Market Trends October/November 2016San Francisco
Sep 16 Aug 16 Sep 15
Home Sales: 164 186 164
Median Price: 1,219,375$ 1,257,500$ 1,155,000$
Average Price: 1,513,969$ 1,546,587$ 1,390,736$
SP/LP: 108.6% 108.4% 117.1%
Days on Market: 39 33 27
Sep 16 Aug 16 Sep 15
Condo Sales: 216 242 180
Median Price: 1,016,250$ 1,057,500$ 1,045,000$
Average Price: 1,210,253$ 1,202,026$ 1,168,669$
SP/LP: 103.6% 102.3% 107.4%
Days on Market: 40 47 34
(Lofts/Tow nhomes/TIC)
Trends at a Glance
(Single-family Homes)
Homes: detached
YTD Peak % Trough % Peak Trough
3-month 35% 36% 104% Apr-15 Feb-12
12-month 35% 41% 84% Apr-15 Mar-12
Homes: attached
3-month 24% 33% 73% Apr-15 Jan-12
12-month 31% 44% 73% Apr-15 Jan-12
San Francisco Price Differences
from January 2014 & Peak & Trough
-25.0
-20.0
-15.0
-10.0
-5.0
0.0
5.0
10.0
15.0
20.0
25.0
0
6
M M J S N 0
7
M M J S N 0
8
M M J S N 0
9
M M J S N 1
0
M M J S N 1
1
M M J S N 1
2
M M J S N 1
3
M M J S N 1
4
M M J S N 1
5
M M J S N 1
6
M M J S
San Francisco Homes: Sales Momentum
Sales Pricing © 2016 rereport.com
PLENTY OF ECONOMIC UPSIDE AVAILABLE
September 2, 2016 -- The final estimate for Gross Do-
mestic Product growth in the second quarter was a
little bit better than the initial estimates, but it's hard
to get very excited about 1.4 percent growth. That
said, that period now came to a close some three
months ago, and most indications point to a much
faster pace of growth in the third quarter.
How much faster is a matter of conjecture at the
moment, and even the initial estimates won't come
along for another month. To be fair, just about any-
thing will be faster than what we've seen in the last
three quarters -- 0.9 percent, 0.8 percent and now
1.4 percent. If growth has picked up recently, as Fed
Chair Janet Yellen remarked after the close of the
September 21 Fed meeting, this strengthens the
case for a move by the central bank before too much
more time has passed.
At least by one reckoning, a model run by the Fed-
eral Reserve Bank of Atlanta, the current run rate for
GDP is about 2.4 percent -- pretty gaudy, relative to
where we've been, if not exactly stellar. However,
after holding a run rate in the mid-three percent
range for much of the Summer, the trend here has
been softening since the beginning of September,
suggesting there's not much momentum to push
growth in the fourth quarter, at least to start with...
and late in the fourth quarter is when the Fed is most
likely to make a move. With such a backdrop, it's little
wonder that Ms. Yellen said this week that there is
"no fixed timetable" for lifting interest rates.
Probably due to seasonal effects and very likely the
result of few desirable homes to buy, home sales
have eased of late. We learned last week that sales
of existing homes (the largest part of the market)
edged downward in August to 5.33 million annualized
units, and this week we learned that sales of new
homes stepped back by 7.6 percent in August, dip-
ping to a 609,000 annualized rate of sale. In both
cases, available stockpiled of unsold homes came in
at 4.6 months of supply, but that's still rather below
optimal levels of about 6 months. As well, it may be
that the homes that are available are mismatched
relative to the needs of the consumers in the market,
making more connections between buyer and seller
difficult.
In a murky economic and political climate, where can
interest rates go? The oh-so-minor buildup in interest
rates in advance of the Fed meeting bled away for
much of this week, but there was a rebound in under-
lying Treasuries as we closed the week and that is
more than sufficient to stop the small decline and
even kick mortgage rates back up a little bit. Whether
they move higher (and certainly how much) will de-
pend upon the first-week-of-the-month onslaught of
vital economic reports.
2 Local Market Trends | San Francisco |
Mortgage Rate Outlook
The chart above shows the National
monthly average for 30-year fixed rate mort-
gages as compiled by HSH.com. The aver-
age includes mortgages of all sizes, includ-
ing conforming, "expanded conforming,"
and jumbo.
October/November 2016
3.0% 4.0% 5.0% 6.0% 7.0% 8.0%
01-08
07-08
01-09
07-09
01-10
07-10
01-11
07-11
01-12
07-12
01-13
07-13
01-14
07-14
01-15
07-15
01-16
07-16
30-Year Fixed Mortgage Rates
Unit
Median Average Sales DOM SP/LP Median Average Sales Median Average Sales
San Francisco 1,219,375$ 1,513,969$ 164 39 108.6% 5.6% 8.9% 0.0% -3.0% -2.1% -11.8%
D1: Northwest 1,820,000$ 2,034,585$ 13 46 106.6% 16.7% 25.7% -13.3% 1.4% 2.1% -7.1%
D2: Central West 1,210,000$ 1,342,554$ 28 32 112.1% 0.8% 8.5% -22.2% -5.5% 2.7% -20.0%
D3: Southwest 820,000$ 964,634$ 11 33 110.6% -10.4% -5.3% 0.0% -2.4% 16.0% -31.3%
D4: Twin Peaks 1,462,000$ 1,448,049$ 28 39 110.0% -1.2% -13.5% 64.7% 1.6% -7.0% 0.0%
D5: Central 1,998,750$ 2,208,865$ 19 27 110.3% -5.0% 6.5% 18.8% -8.1% -3.4% -17.4%
D6: Central North 2,585,000$ 2,585,000$ 2 28 100.5% 25.0% 25.0% 0.0% 6.6% 2.7% -66.7%
D7: North 4,600,000$ 5,120,000$ 5 17 98.7% -18.2% -9.0% 150.0% 48.8% 50.8% -28.6%
D8: Northeast -$ -$ 0 0 0.0% n/a n/a n/a n/a n/a n/a
D9: Central East 1,350,000$ 1,411,200$ 20 64 109.1% -3.1% -26.6% 11.1% -5.6% -1.6% -13.0%
D10: Southeast 830,000$ 845,553$ 38 41 111.2% 3.8% 4.7% -29.6% -0.4% -1.9% -7.3%
September Sales Statistics
(Single-family Homes)
Prices Yearly Change Monthly Change
0
50
100
150
200
250
300
350
$300
$500
$700
$900
$1,100
$1,300
$1,500
$1,700
$1,900
0
9
M M J S N 1
0
M M J S N 1
1
M M J S N 1
2
M M J S N 1
3
M M J S N 1
4
M M J S N 1
5
M M J S N 1
6
M M J S
San Francisco Homes: Sold Prices & Unit Sales
(3-month moving average — $000's)
Ave Med Units © 2016 rereport.com
Table Definitions
_______________
Median Price
The price at which 50% of prices
were higher and 50% were lower.
Average Price
Add all prices and divide by the
number of sales.
SP/LP
Sales price to list price ratio or the
price paid for the property divided
by the asking price.
DOI
Days of Inventory, or how many
days it would take to sell all the
property for sale at the current rate
of sales.
Pend
Property under contract to sell that
hasn’t closed escrow.
Inven
Number pf properties actively for
sale as of the last day of the month.
Local Market Trends | San Francisco | 3October/November 2016
-40.0%
-30.0%
-20.0%
-10.0%
0.0%
10.0%
20.0%
30.0%
40.0%
50.0%
0
9
M M J S N 1
0
M M J S N 1
1
M M J S N 1
2
M M J S N 1
3
M M J S N 1
4
M M J S N 1
5
M M J S N 1
6
M M J S
San Francisco Homes: Year-Over-Year Median SalesPrice Change
© 2016 rereport.com
0
10
20
30
40
50
60
70
80
90
0
9
A J O 1
0
A J O 1
1
A J O 1
2
A J O 1
3
A J O 1
4
A J O 1
5
A J O 1
6
A J
San Francisco Homes: Days on Market
© 2016 rereport.com
0
50
100
150
200
250
300
350
$300
$500
$700
$900
$1,100
$1,300
$1,500
0
9
M M J S N 1
0
M M J S N 1
1
M M J S N 1
2
M M J S N 1
3
M M J S N 1
4
M M J S N 1
5
M M J S N 1
6
M M J S
San Francisco Condos: Sold Prices & Unit Sales
(3-month moving average — $000's)
Ave Med Units © 2016 rereport.com
Unit
Median Average Sales DOM SP/LP Median Average Sales Median Average Sales
San Francisco 1,016,250$ 1,210,253$ 216 40 103.6% -2.8% 3.6% 20.0% -3.9% 0.7% -10.7%
D1: Northwest 1,200,000$ 1,555,778$ 9 45 100.3% 23.1% 53.4% 80.0% 4.6% 38.9% -35.7%
D2: Central West 1,055,000$ 1,055,286$ 7 60 106.4% 46.0% 23.4% 75.0% 6.6% 6.6% 250.0%
D3: Southwest 1,093,003$ 1,040,571$ 5 32 109.2% 32.5% 26.2% 25.0% -0.5% 4.8% -28.6%
D4: Twin Peaks 777,500$ 777,500$ 2 72 103.1% 178.4% 178.4% 100.0% 14.3% 14.3% 100.0%
D5: Central 1,275,000$ 1,360,406$ 29 30 109.5% -5.6% 1.1% 0.0% 6.3% 1.0% -29.3%
D6: Central North 925,254$ 1,012,833$ 28 26 104.4% -24.5% -13.6% 47.4% 2.8% 11.1% 33.3%
D7: North 1,350,000$ 2,058,262$ 21 39 101.4% -17.3% 11.6% 50.0% -8.5% 4.7% -32.3%
D8: Northeast 917,000$ 1,362,650$ 30 36 102.6% 10.5% 21.7% -3.2% 2.0% 31.7% -23.1%
D9: Central East 965,000$ 1,010,165$ 75 46 102.2% -5.4% -7.6% 11.9% -1.0% -5.8% -7.4%
D10: Southeast 590,000$ 550,625$ 8 44 104.7% 16.0% 6.8% 100.0% -10.3% -16.0% 100.0%
September Sales Statistics
(Condos/TICs/Co-ops/Lofts)
Prices Yearly Change Monthly Change
THE REAL ESTATE REPORT
San Francisco
This Real Estate Report is published and copyrighted by http://rereport.com.
Information contained herein is deemed accurate and correct, but no warranty is implied or given.
Annie Williams
Hill & Company
1880 Lombard Street
San, Francisco 94123
Go online to see the full report with the district by district breakdown: http://rereport.com/sf/aw/
-50.0
-40.0
-30.0
-20.0
-10.0
0.0
10.0
20.0
30.0
40.0
0
6
M M J S N 0
7
M M J S N 0
8
M M J S N 0
9
M M J S N 1
0
M M J S N 1
1
M M J S N 1
2
M M J S N 1
3
M M J S N 1
4
M M J S N 1
5
M M J S N 1
6
M M J S
San Francisco Condos/Lofts: SalesMomentum
Sales Pricing © 2016 rereport.com
-30.0%
-20.0%
-10.0%
0.0%
10.0%
20.0%
30.0%
40.0%
0
9
M M J S N 1
0
M M J S N 1
1
M M J S N 1
2
M M J S N 1
3
M M J S N 1
4
M M J S N 1
5
M M J S N 1
6
M M J S
San Francisco Condos/Lofts: Year-Over-Year Median Sales Price Change
© 2016 rereport.com

Mais conteúdo relacionado

Mais de Annie Williams

Annie Williams Real Estate Report - December 2023
Annie Williams Real Estate Report - December 2023Annie Williams Real Estate Report - December 2023
Annie Williams Real Estate Report - December 2023Annie Williams
 
Annie Williams Real Estate Report-September 2023-9.pdf
Annie Williams Real Estate Report-September 2023-9.pdfAnnie Williams Real Estate Report-September 2023-9.pdf
Annie Williams Real Estate Report-September 2023-9.pdfAnnie Williams
 
Annie Williams Real Estate Report - August 2023
Annie Williams Real Estate Report - August 2023Annie Williams Real Estate Report - August 2023
Annie Williams Real Estate Report - August 2023Annie Williams
 
Annie Williams Real Estate Report-July 2023
Annie Williams Real Estate Report-July 2023Annie Williams Real Estate Report-July 2023
Annie Williams Real Estate Report-July 2023Annie Williams
 
Annie Williams Real Estate Report-June 2023
Annie Williams Real Estate Report-June 2023Annie Williams Real Estate Report-June 2023
Annie Williams Real Estate Report-June 2023Annie Williams
 
Annie Williams Real Estate Report-May 2023
Annie Williams Real Estate Report-May 2023Annie Williams Real Estate Report-May 2023
Annie Williams Real Estate Report-May 2023Annie Williams
 
Annie Williams Real Estate Report - April 2023
Annie Williams Real Estate Report - April 2023Annie Williams Real Estate Report - April 2023
Annie Williams Real Estate Report - April 2023Annie Williams
 
Annie Williams Real Estate Report - Feb 2023
Annie Williams Real Estate Report - Feb 2023Annie Williams Real Estate Report - Feb 2023
Annie Williams Real Estate Report - Feb 2023Annie Williams
 
Annie Williams Real Estate Report, Nov 2022
Annie Williams Real Estate Report, Nov 2022Annie Williams Real Estate Report, Nov 2022
Annie Williams Real Estate Report, Nov 2022Annie Williams
 
Annie Williams Real Estate Report - October 2022
Annie Williams Real Estate Report - October 2022Annie Williams Real Estate Report - October 2022
Annie Williams Real Estate Report - October 2022Annie Williams
 
Annie Williams Real Estate Report - March 2022
Annie Williams Real Estate Report - March 2022Annie Williams Real Estate Report - March 2022
Annie Williams Real Estate Report - March 2022Annie Williams
 
Annie Williams Real Estate Report - February 2022
Annie Williams Real Estate Report - February 2022Annie Williams Real Estate Report - February 2022
Annie Williams Real Estate Report - February 2022Annie Williams
 
Annie Williams Real Estate Report - December 2021
Annie Williams Real Estate Report - December 2021Annie Williams Real Estate Report - December 2021
Annie Williams Real Estate Report - December 2021Annie Williams
 
Annie Williams Real Estate Report - November 2021
Annie Williams Real Estate Report - November 2021Annie Williams Real Estate Report - November 2021
Annie Williams Real Estate Report - November 2021Annie Williams
 
Annie Williams Real Estate Report - October 2021
Annie Williams Real Estate Report - October 2021Annie Williams Real Estate Report - October 2021
Annie Williams Real Estate Report - October 2021Annie Williams
 
Annie Williams Real Estate Report - September 2021
Annie Williams Real Estate Report - September 2021Annie Williams Real Estate Report - September 2021
Annie Williams Real Estate Report - September 2021Annie Williams
 
Annie Williams Real Estate Report - August 2021
Annie Williams Real Estate Report - August 2021Annie Williams Real Estate Report - August 2021
Annie Williams Real Estate Report - August 2021Annie Williams
 
Annie Williams Real Estate Report - March 2021
Annie Williams Real Estate Report - March 2021Annie Williams Real Estate Report - March 2021
Annie Williams Real Estate Report - March 2021Annie Williams
 
Annie Williams Real Estate Report - February 2021
Annie Williams Real Estate Report - February 2021Annie Williams Real Estate Report - February 2021
Annie Williams Real Estate Report - February 2021Annie Williams
 
Annie Williams - San Francisco Demographics - Household Expenditures
Annie Williams - San Francisco Demographics - Household ExpendituresAnnie Williams - San Francisco Demographics - Household Expenditures
Annie Williams - San Francisco Demographics - Household ExpendituresAnnie Williams
 

Mais de Annie Williams (20)

Annie Williams Real Estate Report - December 2023
Annie Williams Real Estate Report - December 2023Annie Williams Real Estate Report - December 2023
Annie Williams Real Estate Report - December 2023
 
Annie Williams Real Estate Report-September 2023-9.pdf
Annie Williams Real Estate Report-September 2023-9.pdfAnnie Williams Real Estate Report-September 2023-9.pdf
Annie Williams Real Estate Report-September 2023-9.pdf
 
Annie Williams Real Estate Report - August 2023
Annie Williams Real Estate Report - August 2023Annie Williams Real Estate Report - August 2023
Annie Williams Real Estate Report - August 2023
 
Annie Williams Real Estate Report-July 2023
Annie Williams Real Estate Report-July 2023Annie Williams Real Estate Report-July 2023
Annie Williams Real Estate Report-July 2023
 
Annie Williams Real Estate Report-June 2023
Annie Williams Real Estate Report-June 2023Annie Williams Real Estate Report-June 2023
Annie Williams Real Estate Report-June 2023
 
Annie Williams Real Estate Report-May 2023
Annie Williams Real Estate Report-May 2023Annie Williams Real Estate Report-May 2023
Annie Williams Real Estate Report-May 2023
 
Annie Williams Real Estate Report - April 2023
Annie Williams Real Estate Report - April 2023Annie Williams Real Estate Report - April 2023
Annie Williams Real Estate Report - April 2023
 
Annie Williams Real Estate Report - Feb 2023
Annie Williams Real Estate Report - Feb 2023Annie Williams Real Estate Report - Feb 2023
Annie Williams Real Estate Report - Feb 2023
 
Annie Williams Real Estate Report, Nov 2022
Annie Williams Real Estate Report, Nov 2022Annie Williams Real Estate Report, Nov 2022
Annie Williams Real Estate Report, Nov 2022
 
Annie Williams Real Estate Report - October 2022
Annie Williams Real Estate Report - October 2022Annie Williams Real Estate Report - October 2022
Annie Williams Real Estate Report - October 2022
 
Annie Williams Real Estate Report - March 2022
Annie Williams Real Estate Report - March 2022Annie Williams Real Estate Report - March 2022
Annie Williams Real Estate Report - March 2022
 
Annie Williams Real Estate Report - February 2022
Annie Williams Real Estate Report - February 2022Annie Williams Real Estate Report - February 2022
Annie Williams Real Estate Report - February 2022
 
Annie Williams Real Estate Report - December 2021
Annie Williams Real Estate Report - December 2021Annie Williams Real Estate Report - December 2021
Annie Williams Real Estate Report - December 2021
 
Annie Williams Real Estate Report - November 2021
Annie Williams Real Estate Report - November 2021Annie Williams Real Estate Report - November 2021
Annie Williams Real Estate Report - November 2021
 
Annie Williams Real Estate Report - October 2021
Annie Williams Real Estate Report - October 2021Annie Williams Real Estate Report - October 2021
Annie Williams Real Estate Report - October 2021
 
Annie Williams Real Estate Report - September 2021
Annie Williams Real Estate Report - September 2021Annie Williams Real Estate Report - September 2021
Annie Williams Real Estate Report - September 2021
 
Annie Williams Real Estate Report - August 2021
Annie Williams Real Estate Report - August 2021Annie Williams Real Estate Report - August 2021
Annie Williams Real Estate Report - August 2021
 
Annie Williams Real Estate Report - March 2021
Annie Williams Real Estate Report - March 2021Annie Williams Real Estate Report - March 2021
Annie Williams Real Estate Report - March 2021
 
Annie Williams Real Estate Report - February 2021
Annie Williams Real Estate Report - February 2021Annie Williams Real Estate Report - February 2021
Annie Williams Real Estate Report - February 2021
 
Annie Williams - San Francisco Demographics - Household Expenditures
Annie Williams - San Francisco Demographics - Household ExpendituresAnnie Williams - San Francisco Demographics - Household Expenditures
Annie Williams - San Francisco Demographics - Household Expenditures
 

Último

9990771857 Call Girls in Dwarka Sector 7 Delhi (Call Girls) Delhi
9990771857 Call Girls in Dwarka Sector 7 Delhi (Call Girls) Delhi9990771857 Call Girls in Dwarka Sector 7 Delhi (Call Girls) Delhi
9990771857 Call Girls in Dwarka Sector 7 Delhi (Call Girls) Delhidelhimodel235
 
9990771857 Call Girls Dwarka Sector 9 Delhi (Call Girls ) Delhi
9990771857 Call Girls Dwarka Sector 9 Delhi (Call Girls ) Delhi9990771857 Call Girls Dwarka Sector 9 Delhi (Call Girls ) Delhi
9990771857 Call Girls Dwarka Sector 9 Delhi (Call Girls ) Delhidelhimodel235
 
2k Shot Call girls Karol Bagh Delhi 9205541914
2k Shot Call girls Karol Bagh Delhi 92055419142k Shot Call girls Karol Bagh Delhi 9205541914
2k Shot Call girls Karol Bagh Delhi 9205541914Delhi Call girls
 
Purva Soukhyam in Guduvancheri Chennai.pdf
Purva Soukhyam in Guduvancheri Chennai.pdfPurva Soukhyam in Guduvancheri Chennai.pdf
Purva Soukhyam in Guduvancheri Chennai.pdfpritika141199
 
SVN Live 5.6.24 Weekly Property Broadcast
SVN Live 5.6.24 Weekly Property BroadcastSVN Live 5.6.24 Weekly Property Broadcast
SVN Live 5.6.24 Weekly Property BroadcastSVN International Corp.
 
Properties for Sale in Istanbul with Schools and Parks | Antalya Development
Properties for Sale in Istanbul with Schools and Parks | Antalya DevelopmentProperties for Sale in Istanbul with Schools and Parks | Antalya Development
Properties for Sale in Istanbul with Schools and Parks | Antalya DevelopmentAntalya Development
 
Girls in Kalyanpuri }Delhi↫8447779280↬Escort Service. In Delhi NCR
Girls in Kalyanpuri }Delhi↫8447779280↬Escort Service. In Delhi NCRGirls in Kalyanpuri }Delhi↫8447779280↬Escort Service. In Delhi NCR
Girls in Kalyanpuri }Delhi↫8447779280↬Escort Service. In Delhi NCRasmaqueen5
 
Kohinoor Hinjewadi Phase 2 Pune E-Brochure.pdf
Kohinoor Hinjewadi Phase 2 Pune  E-Brochure.pdfKohinoor Hinjewadi Phase 2 Pune  E-Brochure.pdf
Kohinoor Hinjewadi Phase 2 Pune E-Brochure.pdfManishSaxena95
 
9990771857 Call Girls in Dwarka Sector 6 Delhi (Call Girls) Delhi
9990771857 Call Girls in Dwarka Sector 6 Delhi (Call Girls) Delhi9990771857 Call Girls in Dwarka Sector 6 Delhi (Call Girls) Delhi
9990771857 Call Girls in Dwarka Sector 6 Delhi (Call Girls) Delhidelhimodel235
 
Greater Vancouver Realtors Statistics Package April 2024
Greater Vancouver Realtors Statistics Package April 2024Greater Vancouver Realtors Statistics Package April 2024
Greater Vancouver Realtors Statistics Package April 2024VickyAulakh1
 
Best Deal Virtual Space in Satya The Hive Tata Zudio 750 Sqft 1.89 Cr All inc...
Best Deal Virtual Space in Satya The Hive Tata Zudio 750 Sqft 1.89 Cr All inc...Best Deal Virtual Space in Satya The Hive Tata Zudio 750 Sqft 1.89 Cr All inc...
Best Deal Virtual Space in Satya The Hive Tata Zudio 750 Sqft 1.89 Cr All inc...ApartmentWala1
 
Maha Mauka Squarefeet Brochure |Maha Mauka Squarefeet PDF Brochure|
Maha Mauka Squarefeet Brochure |Maha Mauka Squarefeet PDF Brochure|Maha Mauka Squarefeet Brochure |Maha Mauka Squarefeet PDF Brochure|
Maha Mauka Squarefeet Brochure |Maha Mauka Squarefeet PDF Brochure|AkshayJoshi575980
 
Call Girls In Mayur Vihar Delhi ☆↫8447779280 ❤Escorts Service In Delhi
Call Girls In Mayur Vihar Delhi ☆↫8447779280 ❤Escorts Service In DelhiCall Girls In Mayur Vihar Delhi ☆↫8447779280 ❤Escorts Service In Delhi
Call Girls In Mayur Vihar Delhi ☆↫8447779280 ❤Escorts Service In Delhiasmaqueen5
 
M3M 129 E Brochure Noida Expressway, Sector 129, Noida
M3M 129 E Brochure Noida Expressway, Sector 129, NoidaM3M 129 E Brochure Noida Expressway, Sector 129, Noida
M3M 129 E Brochure Noida Expressway, Sector 129, Noidasarak0han45400
 
2k Shots ≽ 9205541914 ≼ Call Girls In Sainik Farm (Delhi)
2k Shots ≽ 9205541914 ≼ Call Girls In Sainik Farm (Delhi)2k Shots ≽ 9205541914 ≼ Call Girls In Sainik Farm (Delhi)
2k Shots ≽ 9205541914 ≼ Call Girls In Sainik Farm (Delhi)Delhi Call girls
 
M3M The Line Brochure - Premium Investment Opportunity for Commercial Ventures
M3M The Line Brochure - Premium Investment Opportunity for Commercial VenturesM3M The Line Brochure - Premium Investment Opportunity for Commercial Ventures
M3M The Line Brochure - Premium Investment Opportunity for Commercial Venturessheltercareglobal
 
Premium Villa Projects in Sarjapur Road Bengaluru
Premium Villa Projects in Sarjapur Road BengaluruPremium Villa Projects in Sarjapur Road Bengaluru
Premium Villa Projects in Sarjapur Road BengaluruShivaSeo3
 
Low Rate ↬Call Girls in Trilokpuri Delhi ↫8447779280}Escorts Service In Delhi
Low Rate ↬Call Girls in Trilokpuri Delhi ↫8447779280}Escorts Service In DelhiLow Rate ↬Call Girls in Trilokpuri Delhi ↫8447779280}Escorts Service In Delhi
Low Rate ↬Call Girls in Trilokpuri Delhi ↫8447779280}Escorts Service In Delhiasmaqueen5
 
9990771857 Call Girls in Dwarka Sector 1 Delhi (Call Girls) Delhi
9990771857 Call Girls in Dwarka Sector 1 Delhi (Call Girls) Delhi9990771857 Call Girls in Dwarka Sector 1 Delhi (Call Girls) Delhi
9990771857 Call Girls in Dwarka Sector 1 Delhi (Call Girls) Delhidelhimodel235
 
Call Girls In Laxmi Nagar Delhi +91-8447779280! !Best Woman Seeking Man Escor...
Call Girls In Laxmi Nagar Delhi +91-8447779280! !Best Woman Seeking Man Escor...Call Girls In Laxmi Nagar Delhi +91-8447779280! !Best Woman Seeking Man Escor...
Call Girls In Laxmi Nagar Delhi +91-8447779280! !Best Woman Seeking Man Escor...asmaqueen5
 

Último (20)

9990771857 Call Girls in Dwarka Sector 7 Delhi (Call Girls) Delhi
9990771857 Call Girls in Dwarka Sector 7 Delhi (Call Girls) Delhi9990771857 Call Girls in Dwarka Sector 7 Delhi (Call Girls) Delhi
9990771857 Call Girls in Dwarka Sector 7 Delhi (Call Girls) Delhi
 
9990771857 Call Girls Dwarka Sector 9 Delhi (Call Girls ) Delhi
9990771857 Call Girls Dwarka Sector 9 Delhi (Call Girls ) Delhi9990771857 Call Girls Dwarka Sector 9 Delhi (Call Girls ) Delhi
9990771857 Call Girls Dwarka Sector 9 Delhi (Call Girls ) Delhi
 
2k Shot Call girls Karol Bagh Delhi 9205541914
2k Shot Call girls Karol Bagh Delhi 92055419142k Shot Call girls Karol Bagh Delhi 9205541914
2k Shot Call girls Karol Bagh Delhi 9205541914
 
Purva Soukhyam in Guduvancheri Chennai.pdf
Purva Soukhyam in Guduvancheri Chennai.pdfPurva Soukhyam in Guduvancheri Chennai.pdf
Purva Soukhyam in Guduvancheri Chennai.pdf
 
SVN Live 5.6.24 Weekly Property Broadcast
SVN Live 5.6.24 Weekly Property BroadcastSVN Live 5.6.24 Weekly Property Broadcast
SVN Live 5.6.24 Weekly Property Broadcast
 
Properties for Sale in Istanbul with Schools and Parks | Antalya Development
Properties for Sale in Istanbul with Schools and Parks | Antalya DevelopmentProperties for Sale in Istanbul with Schools and Parks | Antalya Development
Properties for Sale in Istanbul with Schools and Parks | Antalya Development
 
Girls in Kalyanpuri }Delhi↫8447779280↬Escort Service. In Delhi NCR
Girls in Kalyanpuri }Delhi↫8447779280↬Escort Service. In Delhi NCRGirls in Kalyanpuri }Delhi↫8447779280↬Escort Service. In Delhi NCR
Girls in Kalyanpuri }Delhi↫8447779280↬Escort Service. In Delhi NCR
 
Kohinoor Hinjewadi Phase 2 Pune E-Brochure.pdf
Kohinoor Hinjewadi Phase 2 Pune  E-Brochure.pdfKohinoor Hinjewadi Phase 2 Pune  E-Brochure.pdf
Kohinoor Hinjewadi Phase 2 Pune E-Brochure.pdf
 
9990771857 Call Girls in Dwarka Sector 6 Delhi (Call Girls) Delhi
9990771857 Call Girls in Dwarka Sector 6 Delhi (Call Girls) Delhi9990771857 Call Girls in Dwarka Sector 6 Delhi (Call Girls) Delhi
9990771857 Call Girls in Dwarka Sector 6 Delhi (Call Girls) Delhi
 
Greater Vancouver Realtors Statistics Package April 2024
Greater Vancouver Realtors Statistics Package April 2024Greater Vancouver Realtors Statistics Package April 2024
Greater Vancouver Realtors Statistics Package April 2024
 
Best Deal Virtual Space in Satya The Hive Tata Zudio 750 Sqft 1.89 Cr All inc...
Best Deal Virtual Space in Satya The Hive Tata Zudio 750 Sqft 1.89 Cr All inc...Best Deal Virtual Space in Satya The Hive Tata Zudio 750 Sqft 1.89 Cr All inc...
Best Deal Virtual Space in Satya The Hive Tata Zudio 750 Sqft 1.89 Cr All inc...
 
Maha Mauka Squarefeet Brochure |Maha Mauka Squarefeet PDF Brochure|
Maha Mauka Squarefeet Brochure |Maha Mauka Squarefeet PDF Brochure|Maha Mauka Squarefeet Brochure |Maha Mauka Squarefeet PDF Brochure|
Maha Mauka Squarefeet Brochure |Maha Mauka Squarefeet PDF Brochure|
 
Call Girls In Mayur Vihar Delhi ☆↫8447779280 ❤Escorts Service In Delhi
Call Girls In Mayur Vihar Delhi ☆↫8447779280 ❤Escorts Service In DelhiCall Girls In Mayur Vihar Delhi ☆↫8447779280 ❤Escorts Service In Delhi
Call Girls In Mayur Vihar Delhi ☆↫8447779280 ❤Escorts Service In Delhi
 
M3M 129 E Brochure Noida Expressway, Sector 129, Noida
M3M 129 E Brochure Noida Expressway, Sector 129, NoidaM3M 129 E Brochure Noida Expressway, Sector 129, Noida
M3M 129 E Brochure Noida Expressway, Sector 129, Noida
 
2k Shots ≽ 9205541914 ≼ Call Girls In Sainik Farm (Delhi)
2k Shots ≽ 9205541914 ≼ Call Girls In Sainik Farm (Delhi)2k Shots ≽ 9205541914 ≼ Call Girls In Sainik Farm (Delhi)
2k Shots ≽ 9205541914 ≼ Call Girls In Sainik Farm (Delhi)
 
M3M The Line Brochure - Premium Investment Opportunity for Commercial Ventures
M3M The Line Brochure - Premium Investment Opportunity for Commercial VenturesM3M The Line Brochure - Premium Investment Opportunity for Commercial Ventures
M3M The Line Brochure - Premium Investment Opportunity for Commercial Ventures
 
Premium Villa Projects in Sarjapur Road Bengaluru
Premium Villa Projects in Sarjapur Road BengaluruPremium Villa Projects in Sarjapur Road Bengaluru
Premium Villa Projects in Sarjapur Road Bengaluru
 
Low Rate ↬Call Girls in Trilokpuri Delhi ↫8447779280}Escorts Service In Delhi
Low Rate ↬Call Girls in Trilokpuri Delhi ↫8447779280}Escorts Service In DelhiLow Rate ↬Call Girls in Trilokpuri Delhi ↫8447779280}Escorts Service In Delhi
Low Rate ↬Call Girls in Trilokpuri Delhi ↫8447779280}Escorts Service In Delhi
 
9990771857 Call Girls in Dwarka Sector 1 Delhi (Call Girls) Delhi
9990771857 Call Girls in Dwarka Sector 1 Delhi (Call Girls) Delhi9990771857 Call Girls in Dwarka Sector 1 Delhi (Call Girls) Delhi
9990771857 Call Girls in Dwarka Sector 1 Delhi (Call Girls) Delhi
 
Call Girls In Laxmi Nagar Delhi +91-8447779280! !Best Woman Seeking Man Escor...
Call Girls In Laxmi Nagar Delhi +91-8447779280! !Best Woman Seeking Man Escor...Call Girls In Laxmi Nagar Delhi +91-8447779280! !Best Woman Seeking Man Escor...
Call Girls In Laxmi Nagar Delhi +91-8447779280! !Best Woman Seeking Man Escor...
 

Annie Williams Real Estate Report Oct-Nov 2016

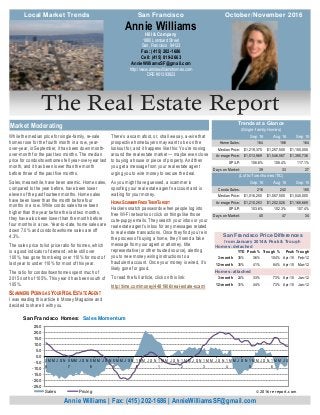
  • 1. The Real Estate Report While the median price for single-family, re-sale homes rose for the fourth month in a row, year- over-year, in September, it has been down month- over-month for the past two months. The median price for condos/townhomes fell year-over-year last month, and it has been lower than the month before three of the past five months. Sales, meanwhile, have been anemic. Home sales, compared to the year before, have been lower eleven of the past fourteen months. Home sales have been lower than the month before four months in a row. While condo sales have been higher than the year before the last two months, they have also been lower than the month before four months in a row. Year-to-date, home sales are down 7.0% and condo/townhome sales are off 4.3%. The sales price to list price ratio for homes, which is a good indicator of demand, while still over 100%, has gone from being over 110% for most of last year to under 110% for most of this year. The ratio for condos/townhomes spent much of 2015 north of 105%. This year it has been south of 105%. SCAMMERS POSING AS YOUR REAL ESTATE AGENT I was reading this article in Money Magazine and decided to share it with you. There’s a scam afoot, or, shall we say, a-wire that prospective homebuyers may want to be on the lookout for, and it happens like this: You’re nosing around the real estate market — maybe even close to buying a house or piece of property. And then you get a message from your real estate agent urging you to wire money to secure the deal. As you might have guessed, a scammer is spoofing your real estate agent’s account and is waiting for your money. HOW A SCAMMER FINDS THEIR TARGET Hackers snatch passwords when people log into free Wi-Fi networks or click on things like those cute-puppy emails. They search your inbox or your real estate agent’s inbox for any messages related to real estate transactions. Once they find you’re in the process of buying a home, they’ll send a fake message from your agent or attorney, title representative (or other trusted source), alerting you to new money wiring instructions to a fraudulent account. Once your money is wired, it’s likely gone for good. To read the full article, click on this link: http://time.com/money/4481906/real-estate-scam/ Hill & Company 1880 Lombard Street San, Francisco 94123 Fax: (415) 202-1686 Cell: (415) 819-2663 AnnieWilliamsSF@gmail.com http://www.anniewilliamshomes.com DRE #01393923 Annie Williams Annie Williams | Fax: (415) 202-1686 | AnnieWilliamsSF@gmail.com Market Moderating Local Market Trends October/November 2016San Francisco Sep 16 Aug 16 Sep 15 Home Sales: 164 186 164 Median Price: 1,219,375$ 1,257,500$ 1,155,000$ Average Price: 1,513,969$ 1,546,587$ 1,390,736$ SP/LP: 108.6% 108.4% 117.1% Days on Market: 39 33 27 Sep 16 Aug 16 Sep 15 Condo Sales: 216 242 180 Median Price: 1,016,250$ 1,057,500$ 1,045,000$ Average Price: 1,210,253$ 1,202,026$ 1,168,669$ SP/LP: 103.6% 102.3% 107.4% Days on Market: 40 47 34 (Lofts/Tow nhomes/TIC) Trends at a Glance (Single-family Homes) Homes: detached YTD Peak % Trough % Peak Trough 3-month 35% 36% 104% Apr-15 Feb-12 12-month 35% 41% 84% Apr-15 Mar-12 Homes: attached 3-month 24% 33% 73% Apr-15 Jan-12 12-month 31% 44% 73% Apr-15 Jan-12 San Francisco Price Differences from January 2014 & Peak & Trough -25.0 -20.0 -15.0 -10.0 -5.0 0.0 5.0 10.0 15.0 20.0 25.0 0 6 M M J S N 0 7 M M J S N 0 8 M M J S N 0 9 M M J S N 1 0 M M J S N 1 1 M M J S N 1 2 M M J S N 1 3 M M J S N 1 4 M M J S N 1 5 M M J S N 1 6 M M J S San Francisco Homes: Sales Momentum Sales Pricing © 2016 rereport.com
  • 2. PLENTY OF ECONOMIC UPSIDE AVAILABLE September 2, 2016 -- The final estimate for Gross Do- mestic Product growth in the second quarter was a little bit better than the initial estimates, but it's hard to get very excited about 1.4 percent growth. That said, that period now came to a close some three months ago, and most indications point to a much faster pace of growth in the third quarter. How much faster is a matter of conjecture at the moment, and even the initial estimates won't come along for another month. To be fair, just about any- thing will be faster than what we've seen in the last three quarters -- 0.9 percent, 0.8 percent and now 1.4 percent. If growth has picked up recently, as Fed Chair Janet Yellen remarked after the close of the September 21 Fed meeting, this strengthens the case for a move by the central bank before too much more time has passed. At least by one reckoning, a model run by the Fed- eral Reserve Bank of Atlanta, the current run rate for GDP is about 2.4 percent -- pretty gaudy, relative to where we've been, if not exactly stellar. However, after holding a run rate in the mid-three percent range for much of the Summer, the trend here has been softening since the beginning of September, suggesting there's not much momentum to push growth in the fourth quarter, at least to start with... and late in the fourth quarter is when the Fed is most likely to make a move. With such a backdrop, it's little wonder that Ms. Yellen said this week that there is "no fixed timetable" for lifting interest rates. Probably due to seasonal effects and very likely the result of few desirable homes to buy, home sales have eased of late. We learned last week that sales of existing homes (the largest part of the market) edged downward in August to 5.33 million annualized units, and this week we learned that sales of new homes stepped back by 7.6 percent in August, dip- ping to a 609,000 annualized rate of sale. In both cases, available stockpiled of unsold homes came in at 4.6 months of supply, but that's still rather below optimal levels of about 6 months. As well, it may be that the homes that are available are mismatched relative to the needs of the consumers in the market, making more connections between buyer and seller difficult. In a murky economic and political climate, where can interest rates go? The oh-so-minor buildup in interest rates in advance of the Fed meeting bled away for much of this week, but there was a rebound in under- lying Treasuries as we closed the week and that is more than sufficient to stop the small decline and even kick mortgage rates back up a little bit. Whether they move higher (and certainly how much) will de- pend upon the first-week-of-the-month onslaught of vital economic reports. 2 Local Market Trends | San Francisco | Mortgage Rate Outlook The chart above shows the National monthly average for 30-year fixed rate mort- gages as compiled by HSH.com. The aver- age includes mortgages of all sizes, includ- ing conforming, "expanded conforming," and jumbo. October/November 2016 3.0% 4.0% 5.0% 6.0% 7.0% 8.0% 01-08 07-08 01-09 07-09 01-10 07-10 01-11 07-11 01-12 07-12 01-13 07-13 01-14 07-14 01-15 07-15 01-16 07-16 30-Year Fixed Mortgage Rates Unit Median Average Sales DOM SP/LP Median Average Sales Median Average Sales San Francisco 1,219,375$ 1,513,969$ 164 39 108.6% 5.6% 8.9% 0.0% -3.0% -2.1% -11.8% D1: Northwest 1,820,000$ 2,034,585$ 13 46 106.6% 16.7% 25.7% -13.3% 1.4% 2.1% -7.1% D2: Central West 1,210,000$ 1,342,554$ 28 32 112.1% 0.8% 8.5% -22.2% -5.5% 2.7% -20.0% D3: Southwest 820,000$ 964,634$ 11 33 110.6% -10.4% -5.3% 0.0% -2.4% 16.0% -31.3% D4: Twin Peaks 1,462,000$ 1,448,049$ 28 39 110.0% -1.2% -13.5% 64.7% 1.6% -7.0% 0.0% D5: Central 1,998,750$ 2,208,865$ 19 27 110.3% -5.0% 6.5% 18.8% -8.1% -3.4% -17.4% D6: Central North 2,585,000$ 2,585,000$ 2 28 100.5% 25.0% 25.0% 0.0% 6.6% 2.7% -66.7% D7: North 4,600,000$ 5,120,000$ 5 17 98.7% -18.2% -9.0% 150.0% 48.8% 50.8% -28.6% D8: Northeast -$ -$ 0 0 0.0% n/a n/a n/a n/a n/a n/a D9: Central East 1,350,000$ 1,411,200$ 20 64 109.1% -3.1% -26.6% 11.1% -5.6% -1.6% -13.0% D10: Southeast 830,000$ 845,553$ 38 41 111.2% 3.8% 4.7% -29.6% -0.4% -1.9% -7.3% September Sales Statistics (Single-family Homes) Prices Yearly Change Monthly Change 0 50 100 150 200 250 300 350 $300 $500 $700 $900 $1,100 $1,300 $1,500 $1,700 $1,900 0 9 M M J S N 1 0 M M J S N 1 1 M M J S N 1 2 M M J S N 1 3 M M J S N 1 4 M M J S N 1 5 M M J S N 1 6 M M J S San Francisco Homes: Sold Prices & Unit Sales (3-month moving average — $000's) Ave Med Units © 2016 rereport.com
  • 3. Table Definitions _______________ Median Price The price at which 50% of prices were higher and 50% were lower. Average Price Add all prices and divide by the number of sales. SP/LP Sales price to list price ratio or the price paid for the property divided by the asking price. DOI Days of Inventory, or how many days it would take to sell all the property for sale at the current rate of sales. Pend Property under contract to sell that hasn’t closed escrow. Inven Number pf properties actively for sale as of the last day of the month. Local Market Trends | San Francisco | 3October/November 2016 -40.0% -30.0% -20.0% -10.0% 0.0% 10.0% 20.0% 30.0% 40.0% 50.0% 0 9 M M J S N 1 0 M M J S N 1 1 M M J S N 1 2 M M J S N 1 3 M M J S N 1 4 M M J S N 1 5 M M J S N 1 6 M M J S San Francisco Homes: Year-Over-Year Median SalesPrice Change © 2016 rereport.com 0 10 20 30 40 50 60 70 80 90 0 9 A J O 1 0 A J O 1 1 A J O 1 2 A J O 1 3 A J O 1 4 A J O 1 5 A J O 1 6 A J San Francisco Homes: Days on Market © 2016 rereport.com 0 50 100 150 200 250 300 350 $300 $500 $700 $900 $1,100 $1,300 $1,500 0 9 M M J S N 1 0 M M J S N 1 1 M M J S N 1 2 M M J S N 1 3 M M J S N 1 4 M M J S N 1 5 M M J S N 1 6 M M J S San Francisco Condos: Sold Prices & Unit Sales (3-month moving average — $000's) Ave Med Units © 2016 rereport.com Unit Median Average Sales DOM SP/LP Median Average Sales Median Average Sales San Francisco 1,016,250$ 1,210,253$ 216 40 103.6% -2.8% 3.6% 20.0% -3.9% 0.7% -10.7% D1: Northwest 1,200,000$ 1,555,778$ 9 45 100.3% 23.1% 53.4% 80.0% 4.6% 38.9% -35.7% D2: Central West 1,055,000$ 1,055,286$ 7 60 106.4% 46.0% 23.4% 75.0% 6.6% 6.6% 250.0% D3: Southwest 1,093,003$ 1,040,571$ 5 32 109.2% 32.5% 26.2% 25.0% -0.5% 4.8% -28.6% D4: Twin Peaks 777,500$ 777,500$ 2 72 103.1% 178.4% 178.4% 100.0% 14.3% 14.3% 100.0% D5: Central 1,275,000$ 1,360,406$ 29 30 109.5% -5.6% 1.1% 0.0% 6.3% 1.0% -29.3% D6: Central North 925,254$ 1,012,833$ 28 26 104.4% -24.5% -13.6% 47.4% 2.8% 11.1% 33.3% D7: North 1,350,000$ 2,058,262$ 21 39 101.4% -17.3% 11.6% 50.0% -8.5% 4.7% -32.3% D8: Northeast 917,000$ 1,362,650$ 30 36 102.6% 10.5% 21.7% -3.2% 2.0% 31.7% -23.1% D9: Central East 965,000$ 1,010,165$ 75 46 102.2% -5.4% -7.6% 11.9% -1.0% -5.8% -7.4% D10: Southeast 590,000$ 550,625$ 8 44 104.7% 16.0% 6.8% 100.0% -10.3% -16.0% 100.0% September Sales Statistics (Condos/TICs/Co-ops/Lofts) Prices Yearly Change Monthly Change
  • 4. THE REAL ESTATE REPORT San Francisco This Real Estate Report is published and copyrighted by http://rereport.com. Information contained herein is deemed accurate and correct, but no warranty is implied or given. Annie Williams Hill & Company 1880 Lombard Street San, Francisco 94123 Go online to see the full report with the district by district breakdown: http://rereport.com/sf/aw/ -50.0 -40.0 -30.0 -20.0 -10.0 0.0 10.0 20.0 30.0 40.0 0 6 M M J S N 0 7 M M J S N 0 8 M M J S N 0 9 M M J S N 1 0 M M J S N 1 1 M M J S N 1 2 M M J S N 1 3 M M J S N 1 4 M M J S N 1 5 M M J S N 1 6 M M J S San Francisco Condos/Lofts: SalesMomentum Sales Pricing © 2016 rereport.com -30.0% -20.0% -10.0% 0.0% 10.0% 20.0% 30.0% 40.0% 0 9 M M J S N 1 0 M M J S N 1 1 M M J S N 1 2 M M J S N 1 3 M M J S N 1 4 M M J S N 1 5 M M J S N 1 6 M M J S San Francisco Condos/Lofts: Year-Over-Year Median Sales Price Change © 2016 rereport.com