SlideShare a Scribd company logo
1 of 4
Download to read offline
The Real Estate Report
below 100%?
After reaching record highs in October,
with the average price going over
$2,000,000 for the first time ever, prices
for single-family, re-sale homes backed
off in November.
The average price for homes fell 10.8%
from October, while the median price was
off 3.5%.
Of note, both the average and median
price of homes were up compared to last
November: 4.5% and 5.9% respectively.
Attached homes, condos, townhouses
and lofts, on the other hand, were down
both month-over-month and year-over-
year.
Detached home sales fell 11.2% from
October, but were up 7.6% year-over-
year.
Attached home sales gained 17.1% from
October, and were up 25.1% compared to
last November.
The sales price to list price ratio continues
to moderate, but is still over 100%,
indicating a continuing sellers’ market.
The ratio for detached homes was
104.9% last month. The peak was 122%
reached in April 2000!
The ratio for attached homes was
104.6%. The peak was 117.2% set,
again, in April 2000.
Prices continue rising due to a shortage of
inventory. There are many projects on the
books, but many of them are rentals.
The San Francisco Business Times has
reported there are 2,485 for sale units
scheduled for completion this year. Next
year, they forecast 2,050 for sale units will
be completed.
These will put a small bump in the
inventory levels, but will it be enough to
bring the sales price to list price ratio
Hill & Company
1880 Lombard Street
San, Francisco 94123
Fax: (415) 202-1686
Cell: (415) 819-2663
AnnieWilliamsSF@gmail.com
http://www.anniewilliamshomes.com
DRE #01393923
Annie Williams
Annie Williams | Fax: (415) 202-1686 | AnnieWilliamsSF@gmail.com
Property Prices Retreat in November
Local Market Trends December 2016San Francisco
Nov 16 Oct 16 Nov 15
Home Sales: 198 223 184
Median Price: 1,360,500$ 1,410,000$ 1,285,000$
Average Price: 1,797,869$ 2,015,222$ 1,720,012$
SP/LP: 104.9% 105.9% 109.3%
Days on Market: 37 27 27
Nov 16 Oct 16 Nov 15
Condo Sales: 254 217 203
Median Price: 1,044,500$ 1,140,000$ 1,125,000$
Average Price: 1,139,606$ 1,268,647$ 1,264,079$
SP/LP: 104.6% 103.4% 106.3%
Days on Market: 39 35 35
(Lofts/Tow nhomes/TIC)
Trends at a Glance
(Single-family Homes)
-25.0
-20.0
-15.0
-10.0
-5.0
0.0
5.0
10.0
15.0
20.0
25.0
0
6
MM J S N 0
7
MM J S N 0
8
M M J S N 0
9
M M J S N 1
0
M M J S N 1
1
M M J S N 1
2
MM J S N 1
3
MM J S N 1
4
MM J S N 1
5
MM J S N 1
6
M M J S N
San Francisco Homes: Sales Momentum
Sales Pricing © 2016 rereport.com
By: Lisa Johnson Mandell
You’ve finally found it: a home you’re swooning over
and dying to own. From the exposed ceiling beams to
the hardwood floors, this feels like the place. So
what’s next? Don’t just stand there dumbstruck; it’s
time to dig deeper and ask questions—and not just
the kind that randomly pop into your head, either.
You need to hit all of the necessary topics head-on,
and some of them are not so obvious.
But you’re in luck: We’ve pulled together a checklist
of some of the most important initial questions to ask
when buying a home:
What is the home’s sales history?
When was the last time the house sold, and how
much did the current owners pay for it? This is es-
sential intel, and you don’t even have to ask the
seller or your real estate agent about it, because it’s
posted on every MLS listing. All you have to do is
scroll down to find it. But make sure you know it.
When buying a home, the previous sale price will
give you a sense of what the sellers might expect you
to pay—but keep in mind that a home’s true market
value is based more on what comparable homes are
selling for now rather than what it went for in the past,
says Los Angeles Realtor® Jennifer Niman of Berk-
shire Hathaway HomeServices. Sales history will
also show you whether the home’s price has been
trending up or down over time, which can help you
hone your negotiating stance.
Did the sellers make any major renovations or
additions?
If they’ve overhauled the kitchen, added a bedroom,
or finished the basement, you’ll want to know that—
and, ideally, see receipts from contractors to get a
sense of what they paid for these upgrades.
In general, this will give you a ballpark notion of how
much money they’ve sunk into the home—and what
they hope to get out. That said, don’t assume you
have to fork over as much cash as they put in; home
improvements generally reap only a 64% return on
average. And that return on investment varies widely
based on which renovation is done.
How much are the property taxes?
Property tax history is also typically available right on
the listing detail page. If you can’t find it, ask the
seller. You’ll want to find out what previous owners
paid, but understand that the property tax, since it’s
based on a percentage of the value of the house, will
(Continued on page 4)
Annie Williams
Hill & Company
Fax: (415) 202-1686
AnnieWilliamsSF@gmail.com
2 Local Market Trends | San Francisco |
10 Essential Questions To Ask When Buying A Home (That You May Have Missed)
The chart above shows the National
monthly average for 30-year fixed rate mort-
gages as compiled by HSH.com. The aver-
age includes mortgages of all sizes, includ-
ing conforming, "expanded conforming,"
and jumbo.
December 2016
3.0% 4.0% 5.0% 6.0% 7.0% 8.0%
01-08
07-08
01-09
07-09
01-10
07-10
01-11
07-11
01-12
07-12
01-13
07-13
01-14
07-14
01-15
07-15
01-16
07-16
30-Year Fixed Mortgage Rates
0
50
100
150
200
250
300
350
$300
$500
$700
$900
$1,100
$1,300
$1,500
$1,700
$1,900
0
9
M M J S N 1
0
M M J S N 1
1
M M J S N 1
2
M M J S N 1
3
M M J S N 1
4
M M J S N 1
5
M M J S N 1
6
M M J S N
San Francisco Homes: Sold Prices & Unit Sales
(3-month moving average — $000's)
Ave Med Units © 2016 rereport.com
Unit
Median Average Sales DOM SP/LP Median Average Sales Median Average Sales
San Francisco 1,360,500$ 1,797,869$ 198 37 104.9% 5.9% 4.5% 7.6% -3.5% -10.8% -11.2%
D1: Northwest 1,785,000$ 3,075,790$ 14 34 100.2% 13.0% 58.0% 75.0% -1.5% 45.4% -33.3%
D2: Central West 1,180,000$ 1,210,546$ 33 29.42 116.6% -0.2% -0.3% 37.5% -1.7% -1.3% -5.7%
D3: Southwest 1,356,000$ 1,292,841$ 19 38 108.6% 73.8% 47.1% 11.8% 50.7% 18.3% 0.0%
D4: Twin Peaks 1,238,500$ 1,526,538$ 32 27 107.6% -11.5% -0.9% -13.5% -16.0% -11.9% 10.3%
D5: Central 1,925,000$ 2,181,644$ 42 42 103.9% 6.4% -6.6% 44.8% -12.5% -14.2% 20.0%
D6: Central North 2,425,000$ 2,425,000$ 1 8 121.6% -35.1% -34.4% -75.0% 3.2% 0.0% -90.0%
D7: North 6,300,000$ 6,095,500$ 6 35 99.1% 16.5% 11.6% -33.3% 5.0% -16.4% -60.0%
D8: Northeast 7,000,000$ 5,829,333$ 3 141 91.1% 75.4% 46.1% 50.0% 195.2% 145.9% 50.0%
D9: Central East 1,407,500$ 1,497,639$ 16 34 107.4% 15.4% 1.6% -23.8% -3.4% 2.1% -33.3%
D10: Southeast 847,500$ 858,703$ 32 45 108.3% -0.3% -3.1% -3.0% -3.1% -1.3% 0.0%
November Sales Statistics
(Single-family Homes)
Prices Yearly Change Monthly Change
Table Definitions
_______________
Median Price
The price at which 50% of prices
were higher and 50% were lower.
Average Price
Add all prices and divide by the
number of sales.
SP/LP
Sales price to list price ratio or the
price paid for the property divided
by the asking price.
DOI
Days of Inventory, or how many
days it would take to sell all the
property for sale at the current rate
of sales.
Pend
Property under contract to sell that
hasn’t closed escrow.
Inven
Number pf properties actively for
sale as of the last day of the month.
Annie Williams
Hill & Company
Fax: (415) 202-1686
AnnieWilliamsSF@gmail.com
Local Market Trends | San Francisco | 3December 2016
Unit
Median Average Sales DOM SP/LP Median Average Sales Median Average Sales
San Francisco 1,044,500$ 1,139,606$ 254 39 104.6% -7.2% -9.8% 25.1% -8.4% -10.2% 17.1%
D1: Northwest 1,083,500$ 1,034,772$ 18 41 105.1% 3.4% -5.5% 28.6% -14.3% -21.7% 125.0%
D2: Central West 900,000$ 1,072,286$ 7 46 106.6% 14.3% 0.4% 133.3% -40.0% -27.7% 133.3%
D3: Southwest 700,000$ 866,436$ 3 30 105.4% -32.0% -11.6% -25.0% -20.8% 0.1% -25.0%
D4: Twin Peaks 653,500$ 653,500$ 2 46 110.5% 1.8% 1.8% 0.0% -1.4% -1.4% 0.0%
D5: Central 1,270,000$ 1,297,506$ 39 33 107.7% 14.2% 7.2% 39.3% 0.6% -3.1% -13.3%
D6: Central North 1,125,000$ 1,106,274$ 40 40 103.2% -7.2% -13.2% 122.2% 21.1% 6.5% 90.5%
D7: North 1,390,000$ 1,531,767$ 30 26 107.4% -13.8% -11.7% 50.0% -17.0% -14.7% 57.9%
D8: Northeast 910,000$ 1,086,398$ 43 37 101.8% -22.6% -22.9% 53.6% -17.3% -15.3% 0.0%
D9: Central East 911,500$ 1,007,370$ 70 47 102.9% -18.6% -16.3% -15.7% -7.9% -17.3% 6.1%
D10: Southeast 759,000$ 759,000$ 1 28 104.3% 2.6% 2.6% -50.0% 20.5% 23.1% -80.0%
November Sales Statistics
(Condos/TICs/Co-ops/Lofts)
Prices Yearly Change Monthly Change
0
50
100
150
200
250
300
350
$300
$500
$700
$900
$1,100
$1,300
$1,500
0
9
M M J S N 1
0
M M J S N 1
1
M M J S N 1
2
M M J S N 1
3
M M J S N 1
4
M M J S N 1
5
M M J S N 1
6
M M J S N
San Francisco Condos: Sold Prices & Unit Sales
(3-month moving average — $000's)
Ave Med Units © 2016 rereport.com
-50.0
-40.0
-30.0
-20.0
-10.0
0.0
10.0
20.0
30.0
40.0
0
6
M M J S N 0
7
M M J S N 0
8
M M J S N 0
9
M M J S N 1
0
M M J S N 1
1
M M J S N 1
2
M M J S N 1
3
M M J S N 1
4
M M J S N 1
5
M M J S N 1
6
M M J S N
San Francisco Condos/Lofts: SalesMomentum
Sales Pricing © 2016 rereport.com
-40.0%
-30.0%
-20.0%
-10.0%
0.0%
10.0%
20.0%
30.0%
40.0%
50.0%
0
9
M M J S N 1
0
M M J S N 1
1
M M J S N 1
2
M M J S N 1
3
M M J S N 1
4
M M J S N 1
5
M M J S N 1
6
M M J S N
San Francisco Homes: Year-Over-Year Median SalesPrice Change
© 2016 rereport.com
THE REAL ESTATE REPORT
San Francisco
This Real Estate Report is published and copyrighted by http://rereport.com.
Information contained herein is deemed accurate and correct, but no warranty is implied or given.
Annie Williams
Hill & Company
1880 Lombard Street
San, Francisco 94123
Go online to see the full report with the district by district breakdown: http://rereport.com/sf/aw/
probably be affected by your purchase price. This
could be a huge additional expense, and you’ll
need to budget for that when putting together your
offer.
What are the monthly maintenance and utility
costs?
Is there any type of homeowners association fee?
Find out. Also learn what kind of power the house
uses, be it gas, oil, electric, or a combination, and
ask what the average monthly bill for each is. Also
inquire about water, waste removal, and any other
utility costs that are applicable.
Has there ever been a broken pipe? Sewer
backup?
This may sound trivial (not to mention unpleasant),
but according to the Insurance Information Institute,
broken pipes account for an estimated 22% of all
home insurance losses. If the homeowner doesn’t
‘fess up, a good home inspector can probably find
evidence of either one of these situations, so you
might want to put these on your list of questions to
ask your inspector, too.
How old is the roof?
The 2015 Remodeling Impact Report from the NA-
(Continued from page 2) TIONAL ASSOCIATION OF REALTORS® says the
national median cost of an asphalt roofing replace-
ment is about $7,600. It would be good to know
how soon you might need to lay out that substantial
amount of cash.
Have there ever been any pest infestations?
If there was an infestation, when were pest control
procedures undertaken? No, this won’t necessarily
mean the house is pest-free at the time you’re buy-
ing it, but it’s a good starting point to know the his-
tory. Many buyers require that termite treatment be
included in the price; it’s easiest to tent for pest
removal when the house is empty, between own-
ers.
Are there warranties on the appliances, HVAC
system, garage door, etc.?
And if so, can the homeowner provide the docu-
mentation? Ask for it. This can establish how old
these features are, and give you an idea of when
they might need to be replaced and how expensive
it could be. It will also help you decide whether or
not to buy a home warranty.
What are the parking restrictions around the
house?
Will guests need parking permits? How many per-
mits are you, as the homeowner, allowed, and can
you obtain more if you decide to throw a party?
Also, check out the parking situation on the prop-
erty itself. Will your car(s) fit in the garage? Is there
room to park anywhere else on the property other
than the driveway?
Does the house have any kind of unusual his-
tory?
In many states, owners are legally bound to dis-
close if a death or major crime has occurred re-
cently on the premises, but there are other circum-
stances you should be aware of as well. For exam-
ple: Did anyone famous ever live there? Was it ever
used in a film, TV series, or commercial? If so, you
might have to deal with fans ringing your doorbell or
driving by at all hours of the day or night.
Oh, and if the house has a history of being haunted
or paranormally “stigmatized,” you might have a
little extra negotiating power when buying a home.
Thanks, ghosts.

More Related Content

More from Annie Williams

Annie Williams Real Estate Report - December 2023
Annie Williams Real Estate Report - December 2023Annie Williams Real Estate Report - December 2023
Annie Williams Real Estate Report - December 2023Annie Williams
 
Annie Williams Real Estate Report-September 2023-9.pdf
Annie Williams Real Estate Report-September 2023-9.pdfAnnie Williams Real Estate Report-September 2023-9.pdf
Annie Williams Real Estate Report-September 2023-9.pdfAnnie Williams
 
Annie Williams Real Estate Report - August 2023
Annie Williams Real Estate Report - August 2023Annie Williams Real Estate Report - August 2023
Annie Williams Real Estate Report - August 2023Annie Williams
 
Annie Williams Real Estate Report-July 2023
Annie Williams Real Estate Report-July 2023Annie Williams Real Estate Report-July 2023
Annie Williams Real Estate Report-July 2023Annie Williams
 
Annie Williams Real Estate Report-June 2023
Annie Williams Real Estate Report-June 2023Annie Williams Real Estate Report-June 2023
Annie Williams Real Estate Report-June 2023Annie Williams
 
Annie Williams Real Estate Report-May 2023
Annie Williams Real Estate Report-May 2023Annie Williams Real Estate Report-May 2023
Annie Williams Real Estate Report-May 2023Annie Williams
 
Annie Williams Real Estate Report - April 2023
Annie Williams Real Estate Report - April 2023Annie Williams Real Estate Report - April 2023
Annie Williams Real Estate Report - April 2023Annie Williams
 
Annie Williams Real Estate Report - Feb 2023
Annie Williams Real Estate Report - Feb 2023Annie Williams Real Estate Report - Feb 2023
Annie Williams Real Estate Report - Feb 2023Annie Williams
 
Annie Williams Real Estate Report, Nov 2022
Annie Williams Real Estate Report, Nov 2022Annie Williams Real Estate Report, Nov 2022
Annie Williams Real Estate Report, Nov 2022Annie Williams
 
Annie Williams Real Estate Report - October 2022
Annie Williams Real Estate Report - October 2022Annie Williams Real Estate Report - October 2022
Annie Williams Real Estate Report - October 2022Annie Williams
 
Annie Williams Real Estate Report - March 2022
Annie Williams Real Estate Report - March 2022Annie Williams Real Estate Report - March 2022
Annie Williams Real Estate Report - March 2022Annie Williams
 
Annie Williams Real Estate Report - February 2022
Annie Williams Real Estate Report - February 2022Annie Williams Real Estate Report - February 2022
Annie Williams Real Estate Report - February 2022Annie Williams
 
Annie Williams Real Estate Report - December 2021
Annie Williams Real Estate Report - December 2021Annie Williams Real Estate Report - December 2021
Annie Williams Real Estate Report - December 2021Annie Williams
 
Annie Williams Real Estate Report - November 2021
Annie Williams Real Estate Report - November 2021Annie Williams Real Estate Report - November 2021
Annie Williams Real Estate Report - November 2021Annie Williams
 
Annie Williams Real Estate Report - October 2021
Annie Williams Real Estate Report - October 2021Annie Williams Real Estate Report - October 2021
Annie Williams Real Estate Report - October 2021Annie Williams
 
Annie Williams Real Estate Report - September 2021
Annie Williams Real Estate Report - September 2021Annie Williams Real Estate Report - September 2021
Annie Williams Real Estate Report - September 2021Annie Williams
 
Annie Williams Real Estate Report - August 2021
Annie Williams Real Estate Report - August 2021Annie Williams Real Estate Report - August 2021
Annie Williams Real Estate Report - August 2021Annie Williams
 
Annie Williams Real Estate Report - March 2021
Annie Williams Real Estate Report - March 2021Annie Williams Real Estate Report - March 2021
Annie Williams Real Estate Report - March 2021Annie Williams
 
Annie Williams Real Estate Report - February 2021
Annie Williams Real Estate Report - February 2021Annie Williams Real Estate Report - February 2021
Annie Williams Real Estate Report - February 2021Annie Williams
 
Annie Williams - San Francisco Demographics - Household Expenditures
Annie Williams - San Francisco Demographics - Household ExpendituresAnnie Williams - San Francisco Demographics - Household Expenditures
Annie Williams - San Francisco Demographics - Household ExpendituresAnnie Williams
 

More from Annie Williams (20)

Annie Williams Real Estate Report - December 2023
Annie Williams Real Estate Report - December 2023Annie Williams Real Estate Report - December 2023
Annie Williams Real Estate Report - December 2023
 
Annie Williams Real Estate Report-September 2023-9.pdf
Annie Williams Real Estate Report-September 2023-9.pdfAnnie Williams Real Estate Report-September 2023-9.pdf
Annie Williams Real Estate Report-September 2023-9.pdf
 
Annie Williams Real Estate Report - August 2023
Annie Williams Real Estate Report - August 2023Annie Williams Real Estate Report - August 2023
Annie Williams Real Estate Report - August 2023
 
Annie Williams Real Estate Report-July 2023
Annie Williams Real Estate Report-July 2023Annie Williams Real Estate Report-July 2023
Annie Williams Real Estate Report-July 2023
 
Annie Williams Real Estate Report-June 2023
Annie Williams Real Estate Report-June 2023Annie Williams Real Estate Report-June 2023
Annie Williams Real Estate Report-June 2023
 
Annie Williams Real Estate Report-May 2023
Annie Williams Real Estate Report-May 2023Annie Williams Real Estate Report-May 2023
Annie Williams Real Estate Report-May 2023
 
Annie Williams Real Estate Report - April 2023
Annie Williams Real Estate Report - April 2023Annie Williams Real Estate Report - April 2023
Annie Williams Real Estate Report - April 2023
 
Annie Williams Real Estate Report - Feb 2023
Annie Williams Real Estate Report - Feb 2023Annie Williams Real Estate Report - Feb 2023
Annie Williams Real Estate Report - Feb 2023
 
Annie Williams Real Estate Report, Nov 2022
Annie Williams Real Estate Report, Nov 2022Annie Williams Real Estate Report, Nov 2022
Annie Williams Real Estate Report, Nov 2022
 
Annie Williams Real Estate Report - October 2022
Annie Williams Real Estate Report - October 2022Annie Williams Real Estate Report - October 2022
Annie Williams Real Estate Report - October 2022
 
Annie Williams Real Estate Report - March 2022
Annie Williams Real Estate Report - March 2022Annie Williams Real Estate Report - March 2022
Annie Williams Real Estate Report - March 2022
 
Annie Williams Real Estate Report - February 2022
Annie Williams Real Estate Report - February 2022Annie Williams Real Estate Report - February 2022
Annie Williams Real Estate Report - February 2022
 
Annie Williams Real Estate Report - December 2021
Annie Williams Real Estate Report - December 2021Annie Williams Real Estate Report - December 2021
Annie Williams Real Estate Report - December 2021
 
Annie Williams Real Estate Report - November 2021
Annie Williams Real Estate Report - November 2021Annie Williams Real Estate Report - November 2021
Annie Williams Real Estate Report - November 2021
 
Annie Williams Real Estate Report - October 2021
Annie Williams Real Estate Report - October 2021Annie Williams Real Estate Report - October 2021
Annie Williams Real Estate Report - October 2021
 
Annie Williams Real Estate Report - September 2021
Annie Williams Real Estate Report - September 2021Annie Williams Real Estate Report - September 2021
Annie Williams Real Estate Report - September 2021
 
Annie Williams Real Estate Report - August 2021
Annie Williams Real Estate Report - August 2021Annie Williams Real Estate Report - August 2021
Annie Williams Real Estate Report - August 2021
 
Annie Williams Real Estate Report - March 2021
Annie Williams Real Estate Report - March 2021Annie Williams Real Estate Report - March 2021
Annie Williams Real Estate Report - March 2021
 
Annie Williams Real Estate Report - February 2021
Annie Williams Real Estate Report - February 2021Annie Williams Real Estate Report - February 2021
Annie Williams Real Estate Report - February 2021
 
Annie Williams - San Francisco Demographics - Household Expenditures
Annie Williams - San Francisco Demographics - Household ExpendituresAnnie Williams - San Francisco Demographics - Household Expenditures
Annie Williams - San Francisco Demographics - Household Expenditures
 

Recently uploaded

Listing Turkey Sylvana Istanbul - Bahcesehir
Listing Turkey Sylvana Istanbul - BahcesehirListing Turkey Sylvana Istanbul - Bahcesehir
Listing Turkey Sylvana Istanbul - BahcesehirListing Turkey
 
Majestique Viman Nagar Pune Brochure.pdf
Majestique Viman Nagar Pune Brochure.pdfMajestique Viman Nagar Pune Brochure.pdf
Majestique Viman Nagar Pune Brochure.pdfBabyrudram
 
Call Girls in laxmi Nagar Delhi 💯Call Us 🔝 9582086666🔝 South Delhi Escorts Se...
Call Girls in laxmi Nagar Delhi 💯Call Us 🔝 9582086666🔝 South Delhi Escorts Se...Call Girls in laxmi Nagar Delhi 💯Call Us 🔝 9582086666🔝 South Delhi Escorts Se...
Call Girls in laxmi Nagar Delhi 💯Call Us 🔝 9582086666🔝 South Delhi Escorts Se...delhimodel235
 
Call Girls In Chand Nagar (Delhi)+918447779280 Welcome To Vip Women Seeking M...
Call Girls In Chand Nagar (Delhi)+918447779280 Welcome To Vip Women Seeking M...Call Girls In Chand Nagar (Delhi)+918447779280 Welcome To Vip Women Seeking M...
Call Girls In Chand Nagar (Delhi)+918447779280 Welcome To Vip Women Seeking M...asmaqueen5
 
call girls in ganesh nagar Delhi 8264348440 ✅ call girls ❤️
call girls in ganesh nagar Delhi 8264348440 ✅ call girls ❤️call girls in ganesh nagar Delhi 8264348440 ✅ call girls ❤️
call girls in ganesh nagar Delhi 8264348440 ✅ call girls ❤️soniya singh
 
M3M 129 E Brochure Noida Expressway, Sector 129, Noida
M3M 129 E Brochure Noida Expressway, Sector 129, NoidaM3M 129 E Brochure Noida Expressway, Sector 129, Noida
M3M 129 E Brochure Noida Expressway, Sector 129, Noidasarak0han45400
 
Mahindra Happinest Tathawade Pune Brochure.pdf
Mahindra Happinest Tathawade Pune Brochure.pdfMahindra Happinest Tathawade Pune Brochure.pdf
Mahindra Happinest Tathawade Pune Brochure.pdfBabyrudram
 
Call Girls in Noida Sector 12 Noida 💯Call Us 🔝 9582086666 🔝 South Delhi Escor...
Call Girls in Noida Sector 12 Noida 💯Call Us 🔝 9582086666 🔝 South Delhi Escor...Call Girls in Noida Sector 12 Noida 💯Call Us 🔝 9582086666 🔝 South Delhi Escor...
Call Girls in Noida Sector 12 Noida 💯Call Us 🔝 9582086666 🔝 South Delhi Escor...delhimodel235
 
M3M The Line Brochure - Premium Investment Opportunity for Commercial Ventures
M3M The Line Brochure - Premium Investment Opportunity for Commercial VenturesM3M The Line Brochure - Premium Investment Opportunity for Commercial Ventures
M3M The Line Brochure - Premium Investment Opportunity for Commercial Venturessheltercareglobal
 
Shapoorji Pallonji Joyville Vista Pune | Spend Your Family Time Together
Shapoorji Pallonji Joyville Vista Pune | Spend Your Family Time TogetherShapoorji Pallonji Joyville Vista Pune | Spend Your Family Time Together
Shapoorji Pallonji Joyville Vista Pune | Spend Your Family Time Togetheraidasheikh47
 
Purva Soukhyam in Guduvancheri Chennai.pdf
Purva Soukhyam in Guduvancheri Chennai.pdfPurva Soukhyam in Guduvancheri Chennai.pdf
Purva Soukhyam in Guduvancheri Chennai.pdfpritika141199
 
Maha Mauka Squarefeet Brochure |Maha Mauka Squarefeet PDF Brochure|
Maha Mauka Squarefeet Brochure |Maha Mauka Squarefeet PDF Brochure|Maha Mauka Squarefeet Brochure |Maha Mauka Squarefeet PDF Brochure|
Maha Mauka Squarefeet Brochure |Maha Mauka Squarefeet PDF Brochure|AkshayJoshi575980
 
Magarpatta Nova Elegance Mundhwa Pune E-Brochure.pdf
Magarpatta Nova Elegance Mundhwa Pune  E-Brochure.pdfMagarpatta Nova Elegance Mundhwa Pune  E-Brochure.pdf
Magarpatta Nova Elegance Mundhwa Pune E-Brochure.pdfManishSaxena95
 
Kohinoor Flats In Hinjewadi Phase 2 | Homes Built To Suit Your Needs
Kohinoor Flats In Hinjewadi Phase 2 | Homes Built To Suit Your NeedsKohinoor Flats In Hinjewadi Phase 2 | Homes Built To Suit Your Needs
Kohinoor Flats In Hinjewadi Phase 2 | Homes Built To Suit Your Needsaidasheikh47
 
9711199012 Call {Girls Delhi} Very Low rate Vaishali DownLoad PDF
9711199012 Call {Girls Delhi} Very Low rate Vaishali DownLoad PDF9711199012 Call {Girls Delhi} Very Low rate Vaishali DownLoad PDF
9711199012 Call {Girls Delhi} Very Low rate Vaishali DownLoad PDFMs Riya
 
Telibagh & Call Girls Lucknow - 450+ Call Girl Cash Payment 🎂 8923113531 🎪 Ne...
Telibagh & Call Girls Lucknow - 450+ Call Girl Cash Payment 🎂 8923113531 🎪 Ne...Telibagh & Call Girls Lucknow - 450+ Call Girl Cash Payment 🎂 8923113531 🎪 Ne...
Telibagh & Call Girls Lucknow - 450+ Call Girl Cash Payment 🎂 8923113531 🎪 Ne...gurkirankumar98700
 
Call girls in new Ashok NagarDelhi꧁ 8447779280꧂ Escort Service Women Seeking ...
Call girls in new Ashok NagarDelhi꧁ 8447779280꧂ Escort Service Women Seeking ...Call girls in new Ashok NagarDelhi꧁ 8447779280꧂ Escort Service Women Seeking ...
Call girls in new Ashok NagarDelhi꧁ 8447779280꧂ Escort Service Women Seeking ...asmaqueen5
 
BDSM⚡Call Girls in Sector 57 Noida Escorts >༒8448380779 Escort Service
BDSM⚡Call Girls in Sector 57 Noida Escorts >༒8448380779 Escort ServiceBDSM⚡Call Girls in Sector 57 Noida Escorts >༒8448380779 Escort Service
BDSM⚡Call Girls in Sector 57 Noida Escorts >༒8448380779 Escort ServiceDelhi Call girls
 
Call Girls In Laxmi Nagar Delhi +91-8447779280! !Best Woman Seeking Man Escor...
Call Girls In Laxmi Nagar Delhi +91-8447779280! !Best Woman Seeking Man Escor...Call Girls In Laxmi Nagar Delhi +91-8447779280! !Best Woman Seeking Man Escor...
Call Girls In Laxmi Nagar Delhi +91-8447779280! !Best Woman Seeking Man Escor...asmaqueen5
 
Call Girls in shastri nagar Delhi 8264348440 ✅ call girls ❤️
Call Girls in shastri nagar Delhi 8264348440 ✅ call girls ❤️Call Girls in shastri nagar Delhi 8264348440 ✅ call girls ❤️
Call Girls in shastri nagar Delhi 8264348440 ✅ call girls ❤️soniya singh
 

Recently uploaded (20)

Listing Turkey Sylvana Istanbul - Bahcesehir
Listing Turkey Sylvana Istanbul - BahcesehirListing Turkey Sylvana Istanbul - Bahcesehir
Listing Turkey Sylvana Istanbul - Bahcesehir
 
Majestique Viman Nagar Pune Brochure.pdf
Majestique Viman Nagar Pune Brochure.pdfMajestique Viman Nagar Pune Brochure.pdf
Majestique Viman Nagar Pune Brochure.pdf
 
Call Girls in laxmi Nagar Delhi 💯Call Us 🔝 9582086666🔝 South Delhi Escorts Se...
Call Girls in laxmi Nagar Delhi 💯Call Us 🔝 9582086666🔝 South Delhi Escorts Se...Call Girls in laxmi Nagar Delhi 💯Call Us 🔝 9582086666🔝 South Delhi Escorts Se...
Call Girls in laxmi Nagar Delhi 💯Call Us 🔝 9582086666🔝 South Delhi Escorts Se...
 
Call Girls In Chand Nagar (Delhi)+918447779280 Welcome To Vip Women Seeking M...
Call Girls In Chand Nagar (Delhi)+918447779280 Welcome To Vip Women Seeking M...Call Girls In Chand Nagar (Delhi)+918447779280 Welcome To Vip Women Seeking M...
Call Girls In Chand Nagar (Delhi)+918447779280 Welcome To Vip Women Seeking M...
 
call girls in ganesh nagar Delhi 8264348440 ✅ call girls ❤️
call girls in ganesh nagar Delhi 8264348440 ✅ call girls ❤️call girls in ganesh nagar Delhi 8264348440 ✅ call girls ❤️
call girls in ganesh nagar Delhi 8264348440 ✅ call girls ❤️
 
M3M 129 E Brochure Noida Expressway, Sector 129, Noida
M3M 129 E Brochure Noida Expressway, Sector 129, NoidaM3M 129 E Brochure Noida Expressway, Sector 129, Noida
M3M 129 E Brochure Noida Expressway, Sector 129, Noida
 
Mahindra Happinest Tathawade Pune Brochure.pdf
Mahindra Happinest Tathawade Pune Brochure.pdfMahindra Happinest Tathawade Pune Brochure.pdf
Mahindra Happinest Tathawade Pune Brochure.pdf
 
Call Girls in Noida Sector 12 Noida 💯Call Us 🔝 9582086666 🔝 South Delhi Escor...
Call Girls in Noida Sector 12 Noida 💯Call Us 🔝 9582086666 🔝 South Delhi Escor...Call Girls in Noida Sector 12 Noida 💯Call Us 🔝 9582086666 🔝 South Delhi Escor...
Call Girls in Noida Sector 12 Noida 💯Call Us 🔝 9582086666 🔝 South Delhi Escor...
 
M3M The Line Brochure - Premium Investment Opportunity for Commercial Ventures
M3M The Line Brochure - Premium Investment Opportunity for Commercial VenturesM3M The Line Brochure - Premium Investment Opportunity for Commercial Ventures
M3M The Line Brochure - Premium Investment Opportunity for Commercial Ventures
 
Shapoorji Pallonji Joyville Vista Pune | Spend Your Family Time Together
Shapoorji Pallonji Joyville Vista Pune | Spend Your Family Time TogetherShapoorji Pallonji Joyville Vista Pune | Spend Your Family Time Together
Shapoorji Pallonji Joyville Vista Pune | Spend Your Family Time Together
 
Purva Soukhyam in Guduvancheri Chennai.pdf
Purva Soukhyam in Guduvancheri Chennai.pdfPurva Soukhyam in Guduvancheri Chennai.pdf
Purva Soukhyam in Guduvancheri Chennai.pdf
 
Maha Mauka Squarefeet Brochure |Maha Mauka Squarefeet PDF Brochure|
Maha Mauka Squarefeet Brochure |Maha Mauka Squarefeet PDF Brochure|Maha Mauka Squarefeet Brochure |Maha Mauka Squarefeet PDF Brochure|
Maha Mauka Squarefeet Brochure |Maha Mauka Squarefeet PDF Brochure|
 
Magarpatta Nova Elegance Mundhwa Pune E-Brochure.pdf
Magarpatta Nova Elegance Mundhwa Pune  E-Brochure.pdfMagarpatta Nova Elegance Mundhwa Pune  E-Brochure.pdf
Magarpatta Nova Elegance Mundhwa Pune E-Brochure.pdf
 
Kohinoor Flats In Hinjewadi Phase 2 | Homes Built To Suit Your Needs
Kohinoor Flats In Hinjewadi Phase 2 | Homes Built To Suit Your NeedsKohinoor Flats In Hinjewadi Phase 2 | Homes Built To Suit Your Needs
Kohinoor Flats In Hinjewadi Phase 2 | Homes Built To Suit Your Needs
 
9711199012 Call {Girls Delhi} Very Low rate Vaishali DownLoad PDF
9711199012 Call {Girls Delhi} Very Low rate Vaishali DownLoad PDF9711199012 Call {Girls Delhi} Very Low rate Vaishali DownLoad PDF
9711199012 Call {Girls Delhi} Very Low rate Vaishali DownLoad PDF
 
Telibagh & Call Girls Lucknow - 450+ Call Girl Cash Payment 🎂 8923113531 🎪 Ne...
Telibagh & Call Girls Lucknow - 450+ Call Girl Cash Payment 🎂 8923113531 🎪 Ne...Telibagh & Call Girls Lucknow - 450+ Call Girl Cash Payment 🎂 8923113531 🎪 Ne...
Telibagh & Call Girls Lucknow - 450+ Call Girl Cash Payment 🎂 8923113531 🎪 Ne...
 
Call girls in new Ashok NagarDelhi꧁ 8447779280꧂ Escort Service Women Seeking ...
Call girls in new Ashok NagarDelhi꧁ 8447779280꧂ Escort Service Women Seeking ...Call girls in new Ashok NagarDelhi꧁ 8447779280꧂ Escort Service Women Seeking ...
Call girls in new Ashok NagarDelhi꧁ 8447779280꧂ Escort Service Women Seeking ...
 
BDSM⚡Call Girls in Sector 57 Noida Escorts >༒8448380779 Escort Service
BDSM⚡Call Girls in Sector 57 Noida Escorts >༒8448380779 Escort ServiceBDSM⚡Call Girls in Sector 57 Noida Escorts >༒8448380779 Escort Service
BDSM⚡Call Girls in Sector 57 Noida Escorts >༒8448380779 Escort Service
 
Call Girls In Laxmi Nagar Delhi +91-8447779280! !Best Woman Seeking Man Escor...
Call Girls In Laxmi Nagar Delhi +91-8447779280! !Best Woman Seeking Man Escor...Call Girls In Laxmi Nagar Delhi +91-8447779280! !Best Woman Seeking Man Escor...
Call Girls In Laxmi Nagar Delhi +91-8447779280! !Best Woman Seeking Man Escor...
 
Call Girls in shastri nagar Delhi 8264348440 ✅ call girls ❤️
Call Girls in shastri nagar Delhi 8264348440 ✅ call girls ❤️Call Girls in shastri nagar Delhi 8264348440 ✅ call girls ❤️
Call Girls in shastri nagar Delhi 8264348440 ✅ call girls ❤️
 

Annie Williams Real Estate Report Dec 2016

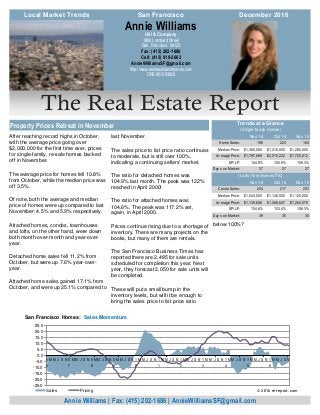
  • 1. The Real Estate Report below 100%? After reaching record highs in October, with the average price going over $2,000,000 for the first time ever, prices for single-family, re-sale homes backed off in November. The average price for homes fell 10.8% from October, while the median price was off 3.5%. Of note, both the average and median price of homes were up compared to last November: 4.5% and 5.9% respectively. Attached homes, condos, townhouses and lofts, on the other hand, were down both month-over-month and year-over- year. Detached home sales fell 11.2% from October, but were up 7.6% year-over- year. Attached home sales gained 17.1% from October, and were up 25.1% compared to last November. The sales price to list price ratio continues to moderate, but is still over 100%, indicating a continuing sellers’ market. The ratio for detached homes was 104.9% last month. The peak was 122% reached in April 2000! The ratio for attached homes was 104.6%. The peak was 117.2% set, again, in April 2000. Prices continue rising due to a shortage of inventory. There are many projects on the books, but many of them are rentals. The San Francisco Business Times has reported there are 2,485 for sale units scheduled for completion this year. Next year, they forecast 2,050 for sale units will be completed. These will put a small bump in the inventory levels, but will it be enough to bring the sales price to list price ratio Hill & Company 1880 Lombard Street San, Francisco 94123 Fax: (415) 202-1686 Cell: (415) 819-2663 AnnieWilliamsSF@gmail.com http://www.anniewilliamshomes.com DRE #01393923 Annie Williams Annie Williams | Fax: (415) 202-1686 | AnnieWilliamsSF@gmail.com Property Prices Retreat in November Local Market Trends December 2016San Francisco Nov 16 Oct 16 Nov 15 Home Sales: 198 223 184 Median Price: 1,360,500$ 1,410,000$ 1,285,000$ Average Price: 1,797,869$ 2,015,222$ 1,720,012$ SP/LP: 104.9% 105.9% 109.3% Days on Market: 37 27 27 Nov 16 Oct 16 Nov 15 Condo Sales: 254 217 203 Median Price: 1,044,500$ 1,140,000$ 1,125,000$ Average Price: 1,139,606$ 1,268,647$ 1,264,079$ SP/LP: 104.6% 103.4% 106.3% Days on Market: 39 35 35 (Lofts/Tow nhomes/TIC) Trends at a Glance (Single-family Homes) -25.0 -20.0 -15.0 -10.0 -5.0 0.0 5.0 10.0 15.0 20.0 25.0 0 6 MM J S N 0 7 MM J S N 0 8 M M J S N 0 9 M M J S N 1 0 M M J S N 1 1 M M J S N 1 2 MM J S N 1 3 MM J S N 1 4 MM J S N 1 5 MM J S N 1 6 M M J S N San Francisco Homes: Sales Momentum Sales Pricing © 2016 rereport.com
  • 2. By: Lisa Johnson Mandell You’ve finally found it: a home you’re swooning over and dying to own. From the exposed ceiling beams to the hardwood floors, this feels like the place. So what’s next? Don’t just stand there dumbstruck; it’s time to dig deeper and ask questions—and not just the kind that randomly pop into your head, either. You need to hit all of the necessary topics head-on, and some of them are not so obvious. But you’re in luck: We’ve pulled together a checklist of some of the most important initial questions to ask when buying a home: What is the home’s sales history? When was the last time the house sold, and how much did the current owners pay for it? This is es- sential intel, and you don’t even have to ask the seller or your real estate agent about it, because it’s posted on every MLS listing. All you have to do is scroll down to find it. But make sure you know it. When buying a home, the previous sale price will give you a sense of what the sellers might expect you to pay—but keep in mind that a home’s true market value is based more on what comparable homes are selling for now rather than what it went for in the past, says Los Angeles Realtor® Jennifer Niman of Berk- shire Hathaway HomeServices. Sales history will also show you whether the home’s price has been trending up or down over time, which can help you hone your negotiating stance. Did the sellers make any major renovations or additions? If they’ve overhauled the kitchen, added a bedroom, or finished the basement, you’ll want to know that— and, ideally, see receipts from contractors to get a sense of what they paid for these upgrades. In general, this will give you a ballpark notion of how much money they’ve sunk into the home—and what they hope to get out. That said, don’t assume you have to fork over as much cash as they put in; home improvements generally reap only a 64% return on average. And that return on investment varies widely based on which renovation is done. How much are the property taxes? Property tax history is also typically available right on the listing detail page. If you can’t find it, ask the seller. You’ll want to find out what previous owners paid, but understand that the property tax, since it’s based on a percentage of the value of the house, will (Continued on page 4) Annie Williams Hill & Company Fax: (415) 202-1686 AnnieWilliamsSF@gmail.com 2 Local Market Trends | San Francisco | 10 Essential Questions To Ask When Buying A Home (That You May Have Missed) The chart above shows the National monthly average for 30-year fixed rate mort- gages as compiled by HSH.com. The aver- age includes mortgages of all sizes, includ- ing conforming, "expanded conforming," and jumbo. December 2016 3.0% 4.0% 5.0% 6.0% 7.0% 8.0% 01-08 07-08 01-09 07-09 01-10 07-10 01-11 07-11 01-12 07-12 01-13 07-13 01-14 07-14 01-15 07-15 01-16 07-16 30-Year Fixed Mortgage Rates 0 50 100 150 200 250 300 350 $300 $500 $700 $900 $1,100 $1,300 $1,500 $1,700 $1,900 0 9 M M J S N 1 0 M M J S N 1 1 M M J S N 1 2 M M J S N 1 3 M M J S N 1 4 M M J S N 1 5 M M J S N 1 6 M M J S N San Francisco Homes: Sold Prices & Unit Sales (3-month moving average — $000's) Ave Med Units © 2016 rereport.com Unit Median Average Sales DOM SP/LP Median Average Sales Median Average Sales San Francisco 1,360,500$ 1,797,869$ 198 37 104.9% 5.9% 4.5% 7.6% -3.5% -10.8% -11.2% D1: Northwest 1,785,000$ 3,075,790$ 14 34 100.2% 13.0% 58.0% 75.0% -1.5% 45.4% -33.3% D2: Central West 1,180,000$ 1,210,546$ 33 29.42 116.6% -0.2% -0.3% 37.5% -1.7% -1.3% -5.7% D3: Southwest 1,356,000$ 1,292,841$ 19 38 108.6% 73.8% 47.1% 11.8% 50.7% 18.3% 0.0% D4: Twin Peaks 1,238,500$ 1,526,538$ 32 27 107.6% -11.5% -0.9% -13.5% -16.0% -11.9% 10.3% D5: Central 1,925,000$ 2,181,644$ 42 42 103.9% 6.4% -6.6% 44.8% -12.5% -14.2% 20.0% D6: Central North 2,425,000$ 2,425,000$ 1 8 121.6% -35.1% -34.4% -75.0% 3.2% 0.0% -90.0% D7: North 6,300,000$ 6,095,500$ 6 35 99.1% 16.5% 11.6% -33.3% 5.0% -16.4% -60.0% D8: Northeast 7,000,000$ 5,829,333$ 3 141 91.1% 75.4% 46.1% 50.0% 195.2% 145.9% 50.0% D9: Central East 1,407,500$ 1,497,639$ 16 34 107.4% 15.4% 1.6% -23.8% -3.4% 2.1% -33.3% D10: Southeast 847,500$ 858,703$ 32 45 108.3% -0.3% -3.1% -3.0% -3.1% -1.3% 0.0% November Sales Statistics (Single-family Homes) Prices Yearly Change Monthly Change
  • 3. Table Definitions _______________ Median Price The price at which 50% of prices were higher and 50% were lower. Average Price Add all prices and divide by the number of sales. SP/LP Sales price to list price ratio or the price paid for the property divided by the asking price. DOI Days of Inventory, or how many days it would take to sell all the property for sale at the current rate of sales. Pend Property under contract to sell that hasn’t closed escrow. Inven Number pf properties actively for sale as of the last day of the month. Annie Williams Hill & Company Fax: (415) 202-1686 AnnieWilliamsSF@gmail.com Local Market Trends | San Francisco | 3December 2016 Unit Median Average Sales DOM SP/LP Median Average Sales Median Average Sales San Francisco 1,044,500$ 1,139,606$ 254 39 104.6% -7.2% -9.8% 25.1% -8.4% -10.2% 17.1% D1: Northwest 1,083,500$ 1,034,772$ 18 41 105.1% 3.4% -5.5% 28.6% -14.3% -21.7% 125.0% D2: Central West 900,000$ 1,072,286$ 7 46 106.6% 14.3% 0.4% 133.3% -40.0% -27.7% 133.3% D3: Southwest 700,000$ 866,436$ 3 30 105.4% -32.0% -11.6% -25.0% -20.8% 0.1% -25.0% D4: Twin Peaks 653,500$ 653,500$ 2 46 110.5% 1.8% 1.8% 0.0% -1.4% -1.4% 0.0% D5: Central 1,270,000$ 1,297,506$ 39 33 107.7% 14.2% 7.2% 39.3% 0.6% -3.1% -13.3% D6: Central North 1,125,000$ 1,106,274$ 40 40 103.2% -7.2% -13.2% 122.2% 21.1% 6.5% 90.5% D7: North 1,390,000$ 1,531,767$ 30 26 107.4% -13.8% -11.7% 50.0% -17.0% -14.7% 57.9% D8: Northeast 910,000$ 1,086,398$ 43 37 101.8% -22.6% -22.9% 53.6% -17.3% -15.3% 0.0% D9: Central East 911,500$ 1,007,370$ 70 47 102.9% -18.6% -16.3% -15.7% -7.9% -17.3% 6.1% D10: Southeast 759,000$ 759,000$ 1 28 104.3% 2.6% 2.6% -50.0% 20.5% 23.1% -80.0% November Sales Statistics (Condos/TICs/Co-ops/Lofts) Prices Yearly Change Monthly Change 0 50 100 150 200 250 300 350 $300 $500 $700 $900 $1,100 $1,300 $1,500 0 9 M M J S N 1 0 M M J S N 1 1 M M J S N 1 2 M M J S N 1 3 M M J S N 1 4 M M J S N 1 5 M M J S N 1 6 M M J S N San Francisco Condos: Sold Prices & Unit Sales (3-month moving average — $000's) Ave Med Units © 2016 rereport.com -50.0 -40.0 -30.0 -20.0 -10.0 0.0 10.0 20.0 30.0 40.0 0 6 M M J S N 0 7 M M J S N 0 8 M M J S N 0 9 M M J S N 1 0 M M J S N 1 1 M M J S N 1 2 M M J S N 1 3 M M J S N 1 4 M M J S N 1 5 M M J S N 1 6 M M J S N San Francisco Condos/Lofts: SalesMomentum Sales Pricing © 2016 rereport.com -40.0% -30.0% -20.0% -10.0% 0.0% 10.0% 20.0% 30.0% 40.0% 50.0% 0 9 M M J S N 1 0 M M J S N 1 1 M M J S N 1 2 M M J S N 1 3 M M J S N 1 4 M M J S N 1 5 M M J S N 1 6 M M J S N San Francisco Homes: Year-Over-Year Median SalesPrice Change © 2016 rereport.com
  • 4. THE REAL ESTATE REPORT San Francisco This Real Estate Report is published and copyrighted by http://rereport.com. Information contained herein is deemed accurate and correct, but no warranty is implied or given. Annie Williams Hill & Company 1880 Lombard Street San, Francisco 94123 Go online to see the full report with the district by district breakdown: http://rereport.com/sf/aw/ probably be affected by your purchase price. This could be a huge additional expense, and you’ll need to budget for that when putting together your offer. What are the monthly maintenance and utility costs? Is there any type of homeowners association fee? Find out. Also learn what kind of power the house uses, be it gas, oil, electric, or a combination, and ask what the average monthly bill for each is. Also inquire about water, waste removal, and any other utility costs that are applicable. Has there ever been a broken pipe? Sewer backup? This may sound trivial (not to mention unpleasant), but according to the Insurance Information Institute, broken pipes account for an estimated 22% of all home insurance losses. If the homeowner doesn’t ‘fess up, a good home inspector can probably find evidence of either one of these situations, so you might want to put these on your list of questions to ask your inspector, too. How old is the roof? The 2015 Remodeling Impact Report from the NA- (Continued from page 2) TIONAL ASSOCIATION OF REALTORS® says the national median cost of an asphalt roofing replace- ment is about $7,600. It would be good to know how soon you might need to lay out that substantial amount of cash. Have there ever been any pest infestations? If there was an infestation, when were pest control procedures undertaken? No, this won’t necessarily mean the house is pest-free at the time you’re buy- ing it, but it’s a good starting point to know the his- tory. Many buyers require that termite treatment be included in the price; it’s easiest to tent for pest removal when the house is empty, between own- ers. Are there warranties on the appliances, HVAC system, garage door, etc.? And if so, can the homeowner provide the docu- mentation? Ask for it. This can establish how old these features are, and give you an idea of when they might need to be replaced and how expensive it could be. It will also help you decide whether or not to buy a home warranty. What are the parking restrictions around the house? Will guests need parking permits? How many per- mits are you, as the homeowner, allowed, and can you obtain more if you decide to throw a party? Also, check out the parking situation on the prop- erty itself. Will your car(s) fit in the garage? Is there room to park anywhere else on the property other than the driveway? Does the house have any kind of unusual his- tory? In many states, owners are legally bound to dis- close if a death or major crime has occurred re- cently on the premises, but there are other circum- stances you should be aware of as well. For exam- ple: Did anyone famous ever live there? Was it ever used in a film, TV series, or commercial? If so, you might have to deal with fans ringing your doorbell or driving by at all hours of the day or night. Oh, and if the house has a history of being haunted or paranormally “stigmatized,” you might have a little extra negotiating power when buying a home. Thanks, ghosts.