1. 1QFY2012 Result Update | Media
July 16, 2011
HT Media ACCUMULATE
CMP `166
Performance Highlights Target Price `177
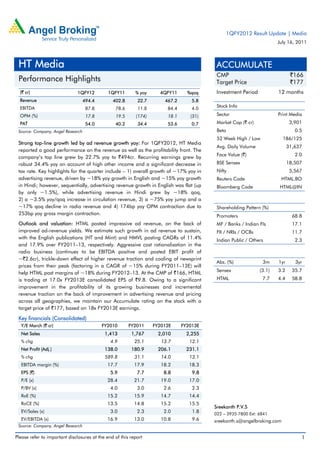
(` cr) 1QFY12 1QFY11 % yoy 4QFY11 %qoq Investment Period 12 months
Revenue 494.4 402.8 22.7 467.2 5.8
EBITDA 87.8 78.6 11.8 84.4 4.0
Stock Info
OPM (%) 17.8 19.5 (174) 18.1 (31) Sector Print Media
PAT 54.0 40.2 34.4 53.6 0.7 Market Cap (` cr) 3,901
Source: Company, Angel Research Beta 0.5
52 Week High / Low 186/125
Strong top-line growth led by ad revenue growth yoy: For 1QFY2012, HT Media
Avg. Daily Volume 31,637
reported a good performance on the revenue as well as the profitability front. The
Face Value (`) 2.0
company’s top line grew by 22.7% yoy to `494cr. Recurring earnings grew by
robust 34.4% yoy on account of high other income and a significant decrease in BSE Sensex 18,507
tax rate. Key highlights for the quarter include – 1) overall growth of ~17% yoy in Nifty 5,567
advertising revenue, driven by ~18% yoy growth in English and ~15% yoy growth Reuters Code HTML.BO
in Hindi; however, sequentially, advertising revenue growth in English was flat (up Bloomberg Code HTML@IN
by only ~1.5%), while advertising revenue in Hindi grew by ~18% qoq,
2) a ~3.5% yoy/qoq increase in circulation revenue, 3) a ~75% yoy jump and a
~17% qoq decline in radio revenue and 4) 174bp yoy OPM contraction due to Shareholding Pattern (%)
253bp yoy gross margin contraction. Promoters 68.8
Outlook and valuation: HTML posted impressive ad revenue, on the back of MF / Banks / Indian Fls 17.1
improved ad-revenue yields. We estimate such growth in ad revenue to sustain, FII / NRIs / OCBs 11.7
with the English publications (HT and Mint) and HMVL posting CAGRs of 11.4% Indian Public / Others 2.3
and 17.9% over FY2011–13, respectively. Aggressive cost rationalisation in the
radio business (continues to be EBITDA positive and posted EBIT profit of
~`2.6cr), trickle-down effect of higher revenue traction and cooling of newsprint
Abs. (%) 3m 1yr 3yr
prices from their peak (factoring in a CAGR of ~15% during FY2011–13E) will
Sensex (3.1) 3.2 35.7
help HTML post margins of ~18% during FY2012–13. At the CMP of `166, HTML
is trading at 17.0x FY2013E consolidated EPS of `9.8. Owing to a significant HTML 7.7 4.4 58.8
improvement in the profitability of its growing businesses and incremental
revenue traction on the back of improvement in advertising revenue and pricing
across all geographies, we maintain our Accumulate rating on the stock with a
target price of `177, based on 18x FY2013E earnings.
Key financials (Consolidated)
Y/E March (` cr) FY2010 FY2011 FY2012E FY2013E
Net Sales 1,413 1,767 2,010 2,255
% chg 4.9 25.1 13.7 12.1
Net Profit (Adj.) 138.0 180.9 206.1 231.1
% chg 589.8 31.1 14.0 12.1
EBITDA margin (%) 17.7 17.9 18.2 18.3
EPS (`) 5.9 7.7 8.8 9.8
P/E (x) 28.4 21.7 19.0 17.0
P/BV (x) 4.0 3.0 2.6 2.3
RoE (%) 15.2 15.9 14.7 14.4
RoCE (%) 13.5 14.8 15.2 15.5
Sreekanth P.V.S
EV/Sales (x) 3.0 2.3 2.0 1.8 022 – 3935 7800 Ext: 6841
EV/EBITDA (x) 16.9 13.0 10.8 9.6 sreekanth.s@angelbroking.com
Source: Company, Angel Research
Please refer to important disclosures at the end of this report 1
3. HT Media | 1QFY2012 Result Update
Strong top-line growth at 22.7% yoy, but modest at 5.8% qoq
HT Media posted strong top-line growth of 22.7% yoy/5.8% qoq to `494cr
(`402cr/`467cr), driven by 27.9% yoy growth in the English print and 12.3% yoy
growth in the Hindi print segments. On a sequential basis, Hindustan reported
strong advertising revenue of `110.8cr (`93.9cr in 4QFY2011), while HT and Mint
together reported flattish advertising revenue growth of 1.5% to `273.6cr
(`269.6cr in 4QFY2011).
Consolidated circulation revenue recorded flat growth of 3.6% yoy/3.4% qoq to
`48.5cr, aided by increased realisations. During the quarter, Hindustan’s
circulation revenue increased by 2.5% yoy/7.8% qoq to `33.1cr with circulation of
~21.5lac copies, while HT and Mint reported growth of 6.2% yoy/decline of 4.9%
qoq to `15.4cr in circulation revenue. Total circulation for the quarter stood at ~39
lakh copies, of which ~9.5 lakhs were reported in Delhi and ~4.5 lakhs were
registered in Mumbai.
Exhibit 3: Top-line growth (Consolidated)
600
494
500 464 467
431
403
400 359 374
330 350
(` cr)
300
200
100
-
1Q10
2Q10
3Q10
4Q10
1Q11
2Q11
3Q11
4Q11
1Q12
Source: Company, Angel Research
Exhibit 4: English/Hindi ad-rev. up yoy but down qoq Exhibit 5: Circulation rev. growth ftat yoy/qoq at ~3.5%
400 30
50 40
25
300 20 48 30
15 46 20
(` cr)
(` cr)
200 10
(%)
370 364 384 44 10
(%)
329 329 5 48 48 49
269 282 291 302 42 43 47 47 47 -
100 - 44
40 42 (10)
(5)
- (10) 38 (20)
1Q10
2Q10
3Q10
4Q10
1Q11
2Q11
3Q11
4Q11
1Q12
1Q10
2Q10
3Q10
4Q10
1Q11
2Q11
3Q11
4Q11
1Q12
Ad revenue (LHS) yoy growth (RHS) Circ. revenue (LHS) yoy growth (RHS)
Source: Company, Angel Research Source: Company, Angel Research
July 18, 2011 3
4. HT Media | 1QFY2012 Result Update
Amongst other segments, new businesses registered significant revenue traction.
The radio business reported robust top-line growth of 74.8% yoy to `21.5cr
(`12.3cr) on account of increased advertising, while the internet business
contributed `8.6cr to the overall revenue.
During 1QFY2012, Burda JV contributed `24.5cr as against ~`2.4cr in
1QFY2011. We expect the Burda JV to contribute ~`80cr and ~`90cr to FY2012
and FY2013 top line, respectively.
Recurring earnings growth robust at 34.4% yoy despite gross
margin pressure
In terms of earnings, HT Media posted 1) robust growth of 34.4% yoy to `54cr
(`40.2cr) on a recurring basis and 24.5% yoy growth to `51.5cr (`41.4cr) on a
reported basis, despite gross margin pressures; 2) 10% yoy increase in
depreciation to `21.4cr (`19.4cr), aided by high other income (up 138.5% yoy) to
`17.2cr; and 3) ~200bp yoy decline in tax rate. The company’s radio business
reported profit of `2.6cr. The internet business of the company, however,
continued to report loss of `12cr (loss of `10.8cr in 4QFY2011).
Exhibit 6: Recurring PAT reports strong growth... Exhibit 7: ...despite under-pressure OPM and GM
50 14 80.0
45 68.4 69.1 67.7
62.5 64.7 64.7 65.1
12 70.0 61.7 64.4
40
35 10 60.0
30 8 50.0
54 54
(` cr)
25
(%)
49 50 40.0
20 40 42 6
(%)
37 30.0
15 28 28 4 18.8 21.5 19.5 18.7 18.1 17.8
15.4 15.5 15.0
10 20.0
2
5 10.0
- - -
1Q10
2Q10
3Q10
4Q10
1Q11
2Q11
3Q11
4Q11
1Q12
1Q10
2Q10
3Q10
4Q10
1Q11
2Q11
3Q11
4Q11
1Q12
Recurring PAT (LHS) NPM (RHS) OPM Gross margins
Source: Company, Angel Research Source: Company, Angel Research
OPM under pressure yoy on high start-up costs and newsprint
prices
At the operating level, HT Media posted a 174bp yoy contraction in operating
margins despite a decrease in staff cost (down 80bp yoy) and advertising expenses
(down 40bp yoy). High newsprint cost and cost of goods from Burda JV (recorded
newsprint cost of `16cr this quarter) resulted in a decline in gross margins
(contracted by significant 253bp yoy/expanded marginally by 42bp qoq), resulting
in operating margin contraction of 174bp yoy. Newsprint cost for the quarter
stood at ~`32,200/tonne.
In terms of segments, HTML recorded EBIT margin contraction of 78bp yoy to
16.1% (16.9%), on account of a decline in EBIT margin of the company’s print
business (recorded EBIT of `89.4cr and EBIT margin contraction of 141bp yoy to
19.2%) and higher loss in the internet business. The radio business of the company
reported profit of `2.6cr and EBIT margin of 12% yoy.
July 18, 2011 4
5. HT Media | 1QFY2012 Result Update
Exhibit 8: Segmental performance (Consolidated)
Y/E March (` cr) 1QFY12 1QFY11 % chg FY2011 FY2010 % chg
Revenue
Printing 467.0 387.4 20.5 1,677.5 1,391.5 20.6
Radio 21.5 12.3 74.6 70.4 43.1 63.5
Internet 8.6 6.2 39.0 31.6 5.6 463.1
Unallocated 0.7 1.2 (43.8) 15.6 6.5 139.6
Total revenue 497.7 407.1 22.3 1,795.1 1,446.6 24.1
Less: Inter segment 0.8 2.0 9.1 7.5
Less: Other Op Inc 2.5 2.2 21.5 26.2
Total net sales 494.4 402.8 22.7 1,764.6 1,412.9 24.9
EBIT
Printing 89.4 79.7 12.3 287.0 263.4 9.0
Radio 2.6 (1.2) (309.0) 7.6 (5.9) -
Internet (12.0) (9.8) 21.8 (39.7) (37.8) 5.0
Total EBIT 80.0 68.6 16.6 255.0 219.8 16.0
EBIT margin (%) 16.1 16.9 (78) 14.2 15.2 (99)
Source: Company, Angel research
Investment Rationale
Healthy ad revenue growth, Burda JV to scale up top line: HTML recorded
impressive ad revenue during the quarter, with yoy growth of 17.6% in English
print and 15.1% yoy/18% qoq in Hindi print, despite tough macroeconomic
conditions. We estimate this growth in ad revenue to prolong with the English
(HT and Mint) and Hindi print businesses (HMVL) posting CAGRs of 12% and
18% over FY2011–13, respectively. Hindustan’s ad revenue will grow maximum
in UP (we peg a CAGR of ~20% over FY2011–13), while HT Mumbai will be the
maximum growth driver for the English print’s ad revenue (we peg a CAGR of
~13% over FY2011–13). Burda, which has recently achieved EBITDA breakeven,
is likely to contribute ~`80cr in FY2012 and ~`90cr in FY2013 to the top line.
New businesses continue to grow, expect OPM of ~18% over FY2011–13: In
terms of operating performance, HTML continued to grow in its new businesses
during the quarter (radio and internet gained traction). The radio business
continued to be EBITDA positive and posted EBIT profit of ~`2.6cr. Going
forward, we believe continuous improvement in ad yields will help HTML post
margins of ~18% during FY2012–13. Newsprint cost for the quarter stood at
~`32,200/tonne (which is in-line with our estimates); hence, we are not
changing our estimates for newsprint prices. We have factored a ~15% CAGR
in newsprint cost over FY2011–13E. The company has recently entered into
the education segment through a JV with Mahesh Tutorials under the brand
name Studymate. Management has earmarked capex of ~`80cr for this
business for FY2012.
July 18, 2011 5
6. HT Media | 1QFY2012 Result Update
Outlook and valuation
We have marginally tweaked our estimates post the results. At the CMP of `166,
HTML is trading at 17.0x FY2013E consolidated EPS of `9.8. We expect ad
revenue growth momentum to continue at the current healthy pace and do not see
any negative surprise on the margin front. We maintain our Accumulate view on
the stock with a target price of `177, based on 18x FY2013E earnings.
Downside risks to our estimates include – 1) sharp rise in newsprint prices,
2) increased competition and 3) higher-than-expected losses or re-investment in
growing businesses (radio, Mint and internet).
Exhibit 9: Change in estimates
Old Estimate New Estimate % chg
(` cr) FY2012E FY2013E FY2012E FY2013E FY2012E FY2013E
Revenue 2,000 2,241 2,010 2,255 0.5 0.6
OPM (%) 18.1 18.2 18.2 18.3 10 14
EPS 8.8 9.7 8.8 9.8 (0.3) 1.4
Source: Company, Angel research
July 18, 2011 6
12. HT Media | 1QFY2012 Result Update
Research Team Tel: 022 - 3935 7800 E-mail: research@angelbroking.com Website: www. angelbroking.com
Disclaimer
This document is solely for the personal information of the recipient, and must not be singularly used as the basis of any investment
decision. Nothing in this document should be construed as investment or financial advice. Each recipient of this document should make
such investigations as they deem necessary to arrive at an independent evaluation of an investment in the securities of the companies
referred to in this document (including the merits and risks involved), and should consult their own advisors to determine the merits and
risks of such an investment.
Angel Broking Limited, its affiliates, directors, its proprietary trading and investment businesses may, from time to time, make
investment decisions that are inconsistent with or contradictory to the recommendations expressed herein. The views contained in this
document are those of the analyst, and the company may or may not subscribe to all the views expressed within.
Reports based on technical and derivative analysis center on studying charts of a stock's price movement, outstanding positions and
trading volume, as opposed to focusing on a company's fundamentals and, as such, may not match with a report on a company's
fundamentals.
The information in this document has been printed on the basis of publicly available information, internal data and other reliable
sources believed to be true, but we do not represent that it is accurate or complete and it should not be relied on as such, as this
document is for general guidance only. Angel Broking Limited or any of its affiliates/ group companies shall not be in any way
responsible for any loss or damage that may arise to any person from any inadvertent error in the information contained in this report.
Angel Broking Limited has not independently verified all the information contained within this document. Accordingly, we cannot testify,
nor make any representation or warranty, express or implied, to the accuracy, contents or data contained within this document. While
Angel Broking Limited endeavours to update on a reasonable basis the information discussed in this material, there may be regulatory,
compliance, or other reasons that prevent us from doing so.
This document is being supplied to you solely for your information, and its contents, information or data may not be reproduced,
redistributed or passed on, directly or indirectly.
Angel Broking Limited and its affiliates may seek to provide or have engaged in providing corporate finance, investment banking or
other advisory services in a merger or specific transaction to the companies referred to in this report, as on the date of this report or in
the past.
Neither Angel Broking Limited, nor its directors, employees or affiliates shall be liable for any loss or damage that may arise from or in
connection with the use of this information.
Note: Please refer to the important `Stock Holding Disclosure' report on the Angel website (Research Section). Also, please refer to the
latest update on respective stocks for the disclosure status in respect of those stocks. Angel Broking Limited and its affiliates may have
investment positions in the stocks recommended in this report.
Disclosure of Interest Statement HTML
1. Analyst ownership of the stock No
2. Angel and its Group companies ownership of the stock No
3. Angel and its Group companies' Directors ownership of the stock No
4. Broking relationship with company covered No
Note: We have not considered any Exposure below ` 1 lakh for Angel, its Group companies and Directors.
Ratings (Returns) : Buy (> 15%) Accumulate (5% to 15%) Neutral (-5 to 5%)
Reduce (-5% to 15%) Sell (< -15%)
July 18, 2011 12