Shale Gas Study ~ American Chemistry Council
•Transferir como PPTX, PDF•
0 gostou•179 visualizações

The American Chemistry Council’s new report examines the economic benefits of U.S. chemical industry investments linked to robust and low-cost supplies of natural gas from shale. Renewed competitiveness in America’s chemical industry has led dozens of companies to announce that they will expand U.S. production capacity – creating jobs, growing payrolls, and enabling new tax revenue.

Recomendados
Mais conteúdo relacionado
Destaque
Destaque (11)
Último
Último (20)
Shale Gas Study ~ American Chemistry Council
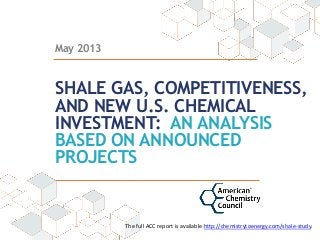
- 1. May 2013 SHALE GAS, COMPETITIVENESS, AND NEW U.S. CHEMICAL INVESTMENT: AN ANALYSIS BASED ON ANNOUNCED PROJECTS The full ACC report is available http://chemistrytoenergy.com/shale-study.
- 2. Shale Boom Driving NewU.S. Investment NorthAmericanCompetitiveAdvantageSustainedthrough2020 Data provided with permission from IHS Global Insight Affordable, competitively priced natural gas is driving significant new capital investment in the US manufacturing sector Long-term, sustained opportunity in feedstock supply and cost 51% of new, publicly- announced chemical industry investment is from firms based outside the US
- 3. U.S. Shale Gas Chemical Investment Manufacturing renaissance due to increased access to natural gas from shale Downstream partners are more competitive than ever Nearly 100 projects announced as of March 2013 $72 billion in potential chemical industry capital investments $67 billion in additional output by 2020
- 5. US Chemical Industry Growth Outpaces Western Europe 60 70 80 90 100 110 120 130 1990 1995 2000 2005 2010 2015 2020 By 2020, US chemical output is 21%-23% higher than Western Europe. Western Europe Chemicals excl. Pharmaceuticals - Volume Index of Production (2007=100) Sources: Eurostat, FRB, ACC analysis U.S.
- 6. New ACC Study: US Chemical Industry Output from Shale-Related Investments Billions of 2012 Dollars • By 2020, additional output from shale- related chemical investments generates $66.8 billion in additional chemical industry shipments. • This is an ongoing, permanent upward shift in the level of shipments.
- 7. During Investment Phase 2010-2020* (Temporary) From Higher Chemical Industry Output in 2020 (Permanent) Total Jobs Average Jobs Added Per Year Payroll ($ Billion) Output ($ Billion) Total Jobs Payroll ($ Billion) Output ($ Billion) Direct 485,054 44,096 $30.7 $71.7 46,359 $4.9 $66.8 Indirect 258,039 23,458 $16.4 $55.9 264,111 $18.9 $100.4 Induced 442,233 40,233 $20.8 $66.2 226,272 $10.6 $33.9 Total 1,185,326 107,757 $67.9 $193.9 536,741 $34.4 $201.1 NewACC Study: Economic Contributions from Announced Chemical Industry Investments in U.S. *Because the investment occurs over a multi-year period, investment phase jobs should be interpreted as work-year jobs. This is done to avoid double-counting the same job in multiple years.
- 8. $14B in NEW, PERMANENT federal, state, and local tax revenue from increased chemical industry output (by 2020) $20B in NEW federal, state, and local tax revenue during investment phase (2010-2020) New ACC Study: Tax Revenue Benefits
- 9. Access: Allow access to natural gas reserves on government and private lands. Infrastructure: Ensure reliable infrastructure to transport supplies State Regulations: Implement responsible state-based regulations that avoid undue restrictions on natural gas supplies Tax Treatment: Minimize cost and reduce complexity for businesses. Maintain accelerated depreciation in tax policy Policies Needed to Realize Potential