
Recomendados
Mais conteúdo relacionado
Mais procurados
Mais procurados (20)
Semelhante a Spss paired samples t test Reporting
Semelhante a Spss paired samples t test Reporting (20)
Mais de Amit Sharma
Mais de Amit Sharma (16)
Último
Último (20)
Spss paired samples t test Reporting
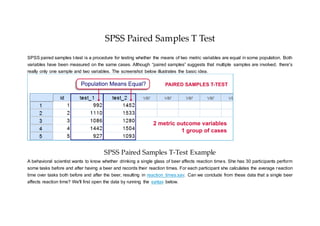
- 1. SPSS Paired Samples T Test SPSS paired samples t-test is a procedure for testing whether the means of two metric variables are equal in some population. Both variables have been measured on the same cases. Although “paired samples” suggests that multiple samples are involved, there's really only one sample and two variables. The screenshot below illustrates the basic idea. SPSS Paired Samples T-Test Example A behavioral scientist wants to know whether drinking a single glass of beer affects reaction times. She has 30 participants perform some tasks before and after having a beer and records their reaction times. For each participant she calculates the average reaction time over tasks both before and after the beer, resulting in reaction_times.sav. Can we conclude from these data that a single beer affects reaction time? We'll first open the data by running the syntax below.
- 2. Quick Data Check We first just want to know what the data look like. We could do so by taking a look at the histograms of the two variables. However, a nice alternative for two variables measured on the same respondents is a scatter plot. The screenshots below walk you through. We first navigate to Graphs Legacy Dialogs Scatter/Dot...
- 3. Normal reactions times are between 800 and 1500 ms (= milliseconds). Neither variable has any values that are way out of this normal range so the data seem plausible. We also see a substantial positive correlation between the variables; respondents who were fast on the first task tend to be fast on the second task as well. The graph seems to suggest that the mean reaction time before a beer is somewhere near 1100 ms (vertical axis) and after a beer perhaps 1300 ms (horizontal axis). One respondent (right top corner, denoted “outlier”) is remarkably slow compared to the others. However, we decide that its scores are not extreme enough to justify removing it from the data. 2. Assumptions Paired Samples T-Test
- 4. SPSS will happily provide us with test results but we can only take those seriously insofar as the assumptions for our test are met. For the paired samples t-test, these are independent observations or, more precisely, independent and identically distributed variables; the difference scores between the two variables must be normally distributed in our population. The first assumption is often satisfied if each case (row of data values) holds a distinct person or other unit of analysis. The normality assumption is mostly relevant for small sample sizes (say N < 30). If it's violated, consider a Wilcoxon signed-ranks test instead of a t-test. However, our data seems to meet both assumptions so we'll proceed to the t-test. 3. Run SPSS Paired Samples T-Test We'll first navigate to Analyze Compare Means Paired-Samples T Test.
- 5. Select both variables and move them into the Paired Variables box. Clicking Paste results in the syntax below. 4. SPSS Paired Samples T-Test Output
- 6. The first table (“Paired Samples Statistics”) presents the descriptive statistics we'll report. (Do not use the DESCRIPTIVES command for obtaining these.*) Since N = 30, we don't have any missing values on the test variables and as expected, the mean reaction time before a beer (1166 ms) is lower than after a beer (1288 ms). On average, respondents slow down some 122 ms. We could have calculated this from the first table ourselves. The p-value denoted by “Sig. (2-tailed)” is 0. (If we double-click it, we'll see it's precisely 0.000083, meaning a .0083 % chance.) So if the population means are equal, there's a 0% chance of finding this result. We therefore reject the null hypothesis. Even a single beer slows people down on the given tasks. Note that the p-value is two-sided. This means that the p-value consists of a .00415% chance of finding a difference < -122 ms and another .00415% chance of finding a difference > 122 ms. 5.Reporting a Paired Samples T-Test As we mentioned before, we'll always report the descriptive statistics obtained from the paired samples t-test. For the significance test, we may write something like “Participants became slower after drinking a single beer, t(29) = -4.6, p = 0.00”.