SlideShare uma empresa Scribd logo
1 de 1
Baixar para ler offline
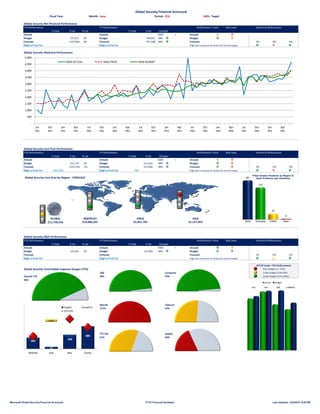
Fiscal Year: FY10 YTD Month: June Period: P12 100% Target
Global Security Net Financial Performance
YTD Performance FY Performance Risk Level Historical Performance
$ Total $ Var % Var $ Total $ Var
Actuals 41,531,514 - - Actuals 41,531,514 - 100% - + Actuals 24,780,781 31,439,697 38,002,558
Budget 42,279,185 747,671 2% Budget 42,278,436 746,922 98% Budget 25,310,563 30,012,350 37,679,517
Forecast 41,333,680 (197,834) 0% Forecast 42,279,022 747,508 98% Forecast 2% -5% -1%
Bdgt vs Frcst Var Bdgt vs Frcst Var High due to amount of variance & narrow margin
Global Security Historical Performance
Global Security Cost Pool Performance
YTD Performance FY Performance Risk Level Historical Performance
$ Total $ Var % Var $ Total $ Var
Actuals 33,541,874 - - Actuals 33,541,874 - 100% - + Actuals 18,387,123 24,590,981 30,115,061
Budget 34,153,644 611,770 2% Budget 34,152,896 611,022 98% Budget 19,415,017 23,410,406 29,905,461
Forecast 33,208,139 (333,735) -1% Forecast 34,153,481 611,608 98% Forecast 2% -5% -1%
Bdgt vs Frcst Var (945,505) Bdgt vs Frcst Var 585 High due to amount of variance & narrow margin
Global Security Cost Pool by Region - FORECAST
GLOBAL
$11,756,336
Global Security G&A Performance
YTD Performance FY Performance Risk Level Historical Performance
$ Total $ Var % Var $ Total $ Var
Actuals 7,989,640 - - Actuals 7,989,640 - 100% - + Actuals 5,793,658 6,848,716 7,887,497
Budget 8,125,541 135,901 2% Budget 8,125,540 135,900 98% Budget 5,895,546 6,601,944 7,774,056
Forecast Forecast Forecast 2% -4% -1%
Bdgt vs Frcst Var Bdgt vs Frcst Var High due to amount of variance & narrow margin
Global Security Controllable Expense Gauges (YTD) Over Budget (or <33%)
T&E Computer Under Budget (33%-66%)
Overall YTD 96% 97% Under Budget (67%-100%)
86%
Morale Telecom
117% 52%
FTE Dev Supply
61% 36%
Global Security Financial Scorecard
AMERICAS
%Target
$18,086,262
%Target
%Target
Performance Trend
Performance Trend
R/Y/G Scale: YTD Performance
EMEA
$2,461,783
ASIA
$1,237,493
Performance Trend
-
500
1,000
1,500
2,000
2,500
3,000
3,500
4,000
4,500
5,000
Jul
YR1
Oct
YR1
Jan
YR1
Apr
YR1
Jul
YR2
Oct
YR2
Jan
YR2
Apr
YR2
Jul
YR3
Oct
YR3
Jan
YR3
Apr
YR3
Jul
YR4
Oct
YR4
Jan
YR4
Apr
YR4
Jul
YR5
Oct
YR5
Jan
YR5
Apr
YR5
MGS ACTUAL MGS FRCST MGS BUDGET
ASIA Americas EMEA Open
381
312
57
8
Filled Vendor Positions by Region &
Open Positions (per Headtrax)
YR2 YR3 YR4 CURRENT
Actual Budget
400
75
500
800
1000
Morale Cell Dev Comp
Targets Exception
YTD CPH
Microsoft Global Security Financial Scorecard FY10 Financial Summary Last Updated: 1/24/2015, 9:28 PM

Mais conteúdo relacionado

Destaque

Cyber Ethics: TechNet Augusta 2015
Cyber Ethics: TechNet Augusta 2015Cyber Ethics: TechNet Augusta 2015
Cyber Ethics: TechNet Augusta 2015AFCEA International
 
Aem authentication vs idp
Aem authentication vs idpAem authentication vs idp
Aem authentication vs idpSaroj Mishra
 
Adobe Source 2016 - Building a Corporate Site Solution Using Multi Site Manager
Adobe Source 2016 - Building a Corporate Site Solution Using Multi Site ManagerAdobe Source 2016 - Building a Corporate Site Solution Using Multi Site Manager
Adobe Source 2016 - Building a Corporate Site Solution Using Multi Site ManagerMichael Leroy
 
Adobe Managed Services: Complicated Cloud Deployments by Adam Pazik, Mike Til...
Adobe Managed Services: Complicated Cloud Deployments by Adam Pazik, Mike Til...Adobe Managed Services: Complicated Cloud Deployments by Adam Pazik, Mike Til...
Adobe Managed Services: Complicated Cloud Deployments by Adam Pazik, Mike Til...AEM HUB
 

Destaque (6)

Cyber Ethics: TechNet Augusta 2015
Cyber Ethics: TechNet Augusta 2015Cyber Ethics: TechNet Augusta 2015
Cyber Ethics: TechNet Augusta 2015
 
Aem authentication vs idp
Aem authentication vs idpAem authentication vs idp
Aem authentication vs idp
 
2016 iHT2 San Diego Health IT Summit
2016 iHT2 San Diego Health IT Summit2016 iHT2 San Diego Health IT Summit
2016 iHT2 San Diego Health IT Summit
 
2016 iHT2 San Diego Health IT Summit
2016 iHT2 San Diego Health IT Summit2016 iHT2 San Diego Health IT Summit
2016 iHT2 San Diego Health IT Summit
 
Adobe Source 2016 - Building a Corporate Site Solution Using Multi Site Manager
Adobe Source 2016 - Building a Corporate Site Solution Using Multi Site ManagerAdobe Source 2016 - Building a Corporate Site Solution Using Multi Site Manager
Adobe Source 2016 - Building a Corporate Site Solution Using Multi Site Manager
 
Adobe Managed Services: Complicated Cloud Deployments by Adam Pazik, Mike Til...
Adobe Managed Services: Complicated Cloud Deployments by Adam Pazik, Mike Til...Adobe Managed Services: Complicated Cloud Deployments by Adam Pazik, Mike Til...
Adobe Managed Services: Complicated Cloud Deployments by Adam Pazik, Mike Til...
 

Semelhante a Security Financial Scorecard

Investing_in_2023_and_Beyond_(Savita).pdf
Investing_in_2023_and_Beyond_(Savita).pdfInvesting_in_2023_and_Beyond_(Savita).pdf
Investing_in_2023_and_Beyond_(Savita).pdfKevin Jessop
 
Gafisa 1 q14 teleconf eng vf (1)
Gafisa 1 q14 teleconf  eng vf (1)Gafisa 1 q14 teleconf  eng vf (1)
Gafisa 1 q14 teleconf eng vf (1)Gafisa RI !
 
3Q09 Results Conference Call
3Q09 Results Conference Call3Q09 Results Conference Call
3Q09 Results Conference CallKianne Paganini
 
ApresentaçãO Call 2 T10 Engv2
ApresentaçãO Call 2 T10 Engv2ApresentaçãO Call 2 T10 Engv2
ApresentaçãO Call 2 T10 Engv2Golinvest
 
Presentation By Hugh Fraser
Presentation By Hugh FraserPresentation By Hugh Fraser
Presentation By Hugh FraserICSA, LLC
 
Earnings Release Presentation - Third Quarter 2007 (3Q07).
Earnings Release Presentation - Third Quarter 2007 (3Q07).Earnings Release Presentation - Third Quarter 2007 (3Q07).
Earnings Release Presentation - Third Quarter 2007 (3Q07).MRVRI
 
Blx webcast presentation 4 q20 finalv2
Blx webcast presentation 4 q20 finalv2Blx webcast presentation 4 q20 finalv2
Blx webcast presentation 4 q20 finalv2Bladex
 
Blx webcast presentation 4 q20 final
Blx webcast presentation 4 q20 finalBlx webcast presentation 4 q20 final
Blx webcast presentation 4 q20 finalBladex
 
4 q12 presentation_handout_english
4 q12 presentation_handout_english4 q12 presentation_handout_english
4 q12 presentation_handout_englishdgiplcorponline
 
yhoo valuation
yhoo valuationyhoo valuation
yhoo valuationMerjerz
 
Apple - Yahoo M
Apple - Yahoo MApple - Yahoo M
Apple - Yahoo MMerjerz
 
2 q12 conference call presentation
2 q12 conference call presentation2 q12 conference call presentation
2 q12 conference call presentationBancoABCRI
 
Non-Life Insurance Companies Analysis, Pakistan - December 2016
Non-Life Insurance Companies Analysis, Pakistan - December 2016Non-Life Insurance Companies Analysis, Pakistan - December 2016
Non-Life Insurance Companies Analysis, Pakistan - December 2016Junaid Akram
 

Semelhante a Security Financial Scorecard (20)

Investing_in_2023_and_Beyond_(Savita).pdf
Investing_in_2023_and_Beyond_(Savita).pdfInvesting_in_2023_and_Beyond_(Savita).pdf
Investing_in_2023_and_Beyond_(Savita).pdf
 
eubiologics 206650 Algorithm Investment Report
eubiologics 206650 Algorithm Investment Reporteubiologics 206650 Algorithm Investment Report
eubiologics 206650 Algorithm Investment Report
 
Top 11 public saa s companies covid risks in 2020
Top 11 public saa s companies covid risks in 2020Top 11 public saa s companies covid risks in 2020
Top 11 public saa s companies covid risks in 2020
 
Gafisa 1 q14 teleconf eng vf (1)
Gafisa 1 q14 teleconf  eng vf (1)Gafisa 1 q14 teleconf  eng vf (1)
Gafisa 1 q14 teleconf eng vf (1)
 
3Q09 Results Conference Call
3Q09 Results Conference Call3Q09 Results Conference Call
3Q09 Results Conference Call
 
ApresentaçãO Call 2 T10 Engv2
ApresentaçãO Call 2 T10 Engv2ApresentaçãO Call 2 T10 Engv2
ApresentaçãO Call 2 T10 Engv2
 
Presentation By Hugh Fraser
Presentation By Hugh FraserPresentation By Hugh Fraser
Presentation By Hugh Fraser
 
hanwha aerospace 012450 Algorithm Investment Report
hanwha aerospace 012450 Algorithm Investment Reporthanwha aerospace 012450 Algorithm Investment Report
hanwha aerospace 012450 Algorithm Investment Report
 
ahngook pharm 001540 Algorithm Investment Report
ahngook pharm 001540 Algorithm Investment Reportahngook pharm 001540 Algorithm Investment Report
ahngook pharm 001540 Algorithm Investment Report
 
Earnings Release Presentation - Third Quarter 2007 (3Q07).
Earnings Release Presentation - Third Quarter 2007 (3Q07).Earnings Release Presentation - Third Quarter 2007 (3Q07).
Earnings Release Presentation - Third Quarter 2007 (3Q07).
 
Blx webcast presentation 4 q20 finalv2
Blx webcast presentation 4 q20 finalv2Blx webcast presentation 4 q20 finalv2
Blx webcast presentation 4 q20 finalv2
 
Blx webcast presentation 4 q20 final
Blx webcast presentation 4 q20 finalBlx webcast presentation 4 q20 final
Blx webcast presentation 4 q20 final
 
cj logistics 000120 Algorithm Investment Report
cj logistics 000120 Algorithm Investment Reportcj logistics 000120 Algorithm Investment Report
cj logistics 000120 Algorithm Investment Report
 
4 q12 presentation_handout_english
4 q12 presentation_handout_english4 q12 presentation_handout_english
4 q12 presentation_handout_english
 
ecoprobm 247540 Algorithm Investment Report
ecoprobm 247540 Algorithm Investment Reportecoprobm 247540 Algorithm Investment Report
ecoprobm 247540 Algorithm Investment Report
 
yhoo valuation
yhoo valuationyhoo valuation
yhoo valuation
 
Apple - Yahoo M
Apple - Yahoo MApple - Yahoo M
Apple - Yahoo M
 
2 q12 conference call presentation
2 q12 conference call presentation2 q12 conference call presentation
2 q12 conference call presentation
 
Non-Life Insurance Companies Analysis, Pakistan - December 2016
Non-Life Insurance Companies Analysis, Pakistan - December 2016Non-Life Insurance Companies Analysis, Pakistan - December 2016
Non-Life Insurance Companies Analysis, Pakistan - December 2016
 
asiana airlines 020560 Algorithm Investment Report
asiana airlines 020560 Algorithm Investment Reportasiana airlines 020560 Algorithm Investment Report
asiana airlines 020560 Algorithm Investment Report
 

Security Financial Scorecard

  • 1. Fiscal Year: FY10 YTD Month: June Period: P12 100% Target Global Security Net Financial Performance YTD Performance FY Performance Risk Level Historical Performance $ Total $ Var % Var $ Total $ Var Actuals 41,531,514 - - Actuals 41,531,514 - 100% - + Actuals 24,780,781 31,439,697 38,002,558 Budget 42,279,185 747,671 2% Budget 42,278,436 746,922 98% Budget 25,310,563 30,012,350 37,679,517 Forecast 41,333,680 (197,834) 0% Forecast 42,279,022 747,508 98% Forecast 2% -5% -1% Bdgt vs Frcst Var Bdgt vs Frcst Var High due to amount of variance & narrow margin Global Security Historical Performance Global Security Cost Pool Performance YTD Performance FY Performance Risk Level Historical Performance $ Total $ Var % Var $ Total $ Var Actuals 33,541,874 - - Actuals 33,541,874 - 100% - + Actuals 18,387,123 24,590,981 30,115,061 Budget 34,153,644 611,770 2% Budget 34,152,896 611,022 98% Budget 19,415,017 23,410,406 29,905,461 Forecast 33,208,139 (333,735) -1% Forecast 34,153,481 611,608 98% Forecast 2% -5% -1% Bdgt vs Frcst Var (945,505) Bdgt vs Frcst Var 585 High due to amount of variance & narrow margin Global Security Cost Pool by Region - FORECAST GLOBAL $11,756,336 Global Security G&A Performance YTD Performance FY Performance Risk Level Historical Performance $ Total $ Var % Var $ Total $ Var Actuals 7,989,640 - - Actuals 7,989,640 - 100% - + Actuals 5,793,658 6,848,716 7,887,497 Budget 8,125,541 135,901 2% Budget 8,125,540 135,900 98% Budget 5,895,546 6,601,944 7,774,056 Forecast Forecast Forecast 2% -4% -1% Bdgt vs Frcst Var Bdgt vs Frcst Var High due to amount of variance & narrow margin Global Security Controllable Expense Gauges (YTD) Over Budget (or <33%) T&E Computer Under Budget (33%-66%) Overall YTD 96% 97% Under Budget (67%-100%) 86% Morale Telecom 117% 52% FTE Dev Supply 61% 36% Global Security Financial Scorecard AMERICAS %Target $18,086,262 %Target %Target Performance Trend Performance Trend R/Y/G Scale: YTD Performance EMEA $2,461,783 ASIA $1,237,493 Performance Trend - 500 1,000 1,500 2,000 2,500 3,000 3,500 4,000 4,500 5,000 Jul YR1 Oct YR1 Jan YR1 Apr YR1 Jul YR2 Oct YR2 Jan YR2 Apr YR2 Jul YR3 Oct YR3 Jan YR3 Apr YR3 Jul YR4 Oct YR4 Jan YR4 Apr YR4 Jul YR5 Oct YR5 Jan YR5 Apr YR5 MGS ACTUAL MGS FRCST MGS BUDGET ASIA Americas EMEA Open 381 312 57 8 Filled Vendor Positions by Region & Open Positions (per Headtrax) YR2 YR3 YR4 CURRENT Actual Budget 400 75 500 800 1000 Morale Cell Dev Comp Targets Exception YTD CPH Microsoft Global Security Financial Scorecard FY10 Financial Summary Last Updated: 1/24/2015, 9:28 PM