The determinants of financial inclusion in western africa insights from ghana
•
1 gostou•766 visualizações

International peer-reviewed academic journals call for papers, http://www.iiste.org/Journals

Recomendados
Recomendados
Mais conteúdo relacionado
Mais procurados
Mais procurados (20)
Destaque
Destaque (10)
Semelhante a The determinants of financial inclusion in western africa insights from ghana
Semelhante a The determinants of financial inclusion in western africa insights from ghana (20)
Mais de Alexander Decker
Mais de Alexander Decker (20)
Último
Último (20)
The determinants of financial inclusion in western africa insights from ghana
- 1. Research Journal of Finance and Accounting www.iiste.org ISSN 2222-1697 (Paper) ISSN 2222-2847 (Online) Vol.4, No.8, 2013 1 The Determinants of Financial Inclusion in Western Africa: Insights from Ghana Mamudu Abunga Akudugu School of Agriculture, Policy and Development, University of Reading, United Kingdom Emails: abungah@gmail.com / makudugu@uds.edu.gh / a.m.akudugu@pgr.reading.ac.uk. Abstract There is low financial inclusion across developing countries, especially those in Sub-Saharan Africa including Ghana. This paper examines the determinants of financial inclusion in Western Africa with specific focus on Ghana. The data used in the analyses came from 1000 individual adults across Ghana and included people across the different wealth classes, occupations, geographical locations, gender and generations. Using the logit model, the determinants of individuals’ inclusion in the formal financial market were estimated. The results show that only two in five adults are included in the formal financial sector of Ghana. Age of individuals, literacy levels, wealth class, distance to financial institutions, lack of documentation, lack of trust for formal financial institutions, money poverty and social networks as reflected in family relations are the significant determinants of financial inclusion in Ghana. The implication of this for policy is that there is the need for governments in Western Africa, particularly Ghana and their development partners to formulate a holistic financial framework that seeks to mitigate the negative determinants of financial inclusion and sustained the positive ones. It is recommended that such a policy framework should be politically neutral, economically viable, gender sensitive, socially stable and financially feasible so as to make it sustainable. Key Words: Africa, Financial Inclusion, Financial Market, Ghana, Logit model 1. Background Issues Progress in the financial sector of the world economy and economies of nation states for that matter is one of the necessary conditions for the attainment of sustainable socio-economic development. To this end, world leaders continue to make frantic efforts to ensure sustainable financial progress so as to promote economy-wide development and improvements in the livelihoods of their citizenry. This is particularly so among leaders in the developing world where the financial sectors of nation states are still in their doldrums. These efforts have led to some substantial financial developments in many developing countries including Ghana over the past few decades (Huang, 2010). These developments in the financial sector have been largely attributed to financial sector liberalizations (Kabango & Paloni, 2011). Notwithstanding the impressive developments recorded, the financial sectors of developing countries, especially those in Western Africa are still highly imperfect (Todaro & Smith, 2011) and fragmented. The two main fragments of the financial sectors have been captured in the empirical literature as the formal and informal financial markets (Tang, 1995; Chaudhuri & Gupta, 1996; Steel et al., 1997; Bose, 1998; Diagne, 1999; Jain, 1999; Atieno, 2001; Chakrabarty & Chaudhuri, 2001; Aryeetey, 2003; Straub, 2005; Guirkinger, 2008; Swaminathan et al., 2010; Giné, 2011). The informal and formal financial markets are faced with two distinct challenges in their attempts to promote financial inclusion. The main challenge that the informal financial market faces is its lack of capacity to fully integrate many people into its fold and this is due to its limited resource base. For the formal financial market, its main challenge is the rules and regulations governing its operations. These rules and regulations make it difficult for it to include people, especially those in rural areas into the mainstream financial sector. This is because of issues of credit worthiness as most people are only included in the financial market through specially designed credit schemes (Mehrens & Lehmann, 1987; Quaye, 2008; Akudugu et al., 2009). The focus of formal financial institutions on credit worthiness as a principal consideration for inclusion in the formal financial sector is responsible for the continuous fragmentation of financial markets in developing countries (Bose, 1998). The continuous parallel existence of the informal and formal rural financial markets in most of rural Africa has largely been blamed on regressive financial policies pursued by African governments (Aryeetey, 2003). The most prominent repressive financial policies are the debt pardoning schemes which were rolled out especially in the 1970s and 1980s (Vogel, 1981, 1984a, 1984b) and subsidized interest rates (Gonzalez-Vega, 1983; Adams et al., 1987). These policies were implemented with the hope that there would be trickle down-effects of reducing high interest rates charged by informal lenders so as to lower the cost of lending but this never happened (Bose, 1998). Such policies and structures had the overall objective of crowding out actors in the informal financial market instead of integrating them into the mainstream financial market. The failure of these policies led the informal financial market to build resilience hence its continuous survival. The resilience of the informal financial market which serves most people in rural areas might be responsible for the inability of formal financial markets in developing countries to integrate customers of informal financial markets into the mainstream formal
- 2. Research Journal of Finance and Accounting www.iiste.org ISSN 2222-1697 (Paper) ISSN 2222-2847 (Online) Vol.4, No.8, 2013 2 financial sector for savings mobilization and credit delivery. This observation is consistent with Christen and Pearce (2005) who argued that though household savings continue to be the primary funding source for most private, smallholder and microenterprise production and trade activities, actors in the formal financial markets in developing countries consider them a costly liability and do not reach out to them. The main difference between the formal and informal financial markets is that unlike lenders in the formal financial market, those in the informal financial market refinance borrowers with no interest payments when the need arises (Onumah, 2003). This continues to widen the gap between the formal and informal financial markets thereby making formal financial inclusion a daunting task. Reaching out to actors in the informal financial markets is particularly important because all households, no matter how poor they are, are said to engage in a number of financial strategies to build assets, prepare for life events and emergencies, and cover daily transactions (Sebstad & Cohen, 2001). They predominantly engage in a number of non-financial means of savings such as accumulation of livestock, jewellery, and even staple food crops some of which have cultural and spiritual significance. In his publication entitled “The Poor and their Money”, Rutherford (2000) noted that many rural households engage in informal financial relationships among themselves to the extent that they have over the years built credible rotating savings and credit associations, through which they are able to set aside some small amounts daily or weekly to meet their financial needs. By this, they lend to each other and to family members in a way that build solidarity among them. The empirical literature suggests that the volume of activities in the informal financial market of developing countries is far greater than that of organized formal financial institutions (Braverman & Guasch, 1997; Khandker & Faruqee, 2003; Schindler, 2010). There is the need therefore to integrate the formal and informal rural financial markets in Africa and for that matter Ghana. This has been successfully done in countries such as Thailand, Brazil, Indonesia, Nepal, Peru, Madagascar, Costa Rica, Uganda and Uzbekistan among others (Wehnert & Shakya, 2001; Christen & Pearce, 2005). The factors influencing access to formal credit have been identified in the empirical literature (Atieno, 2001; Aryeetey, 2003; Armendáriz de Aghion & Morduch, 2005; Khandker, 2005; Ayamga et al., 2006; Kibaara, 2006; Akudugu et al., 2009; Rahji & Fakayode, 2009; Akudugu, 2010; Armendáriz de Aghion & Morduch, 2010; Awunyo-Vitor & Abankwah, 2012). However, the issue of why a person will decide to be included in the formal financial sector has not been holistically examined in the literature. This is particularly so in Ghana where most people are excluded from the formal financial sector (IFAD, 2003) with only 29% of adults in the country being said to be banked (Demirgüç-Kunt & Klapper, 2012). The factors accounting for the low patronage of services provided by the formal financial market have largely not been identified in the empirical literature. This is a gap that must be bridged if efficient and effective strategies are to be developed for the inclusion of more people in the formal financial market. This paper therefore identifies and estimates the factors that determine financial inclusion in western Africa using Ghana as the case study. Apart from the introduction presented in section 1, the rest of the paper is organised into three main sections. The methodology employed is presented in section 2. The results and discussion are presented in section 3. The conclusion and policy implications presented in section 4 conclude the paper. 2. Methodology The data for the analyses came from the World Bank Global Financial Inclusion Index (Demirgüç-Kunt & Klapper, 2012). The data covered 1000 individual adults across Ghana and included people across the different wealth classes, occupations, geographical locations, gender and generations. Using the logit model, the determinants of individuals’ inclusion in the formal financial market were estimated. Financial inclusion in the formal financial market in the context of this paper is defined as people who patronize services rendered by actors in the formal financial market. These services principally include accounts operations, savings mobilizations and credit delivery. Thus individuals across Ghana who open accounts with formal sector financial institutions, make savings or take credit from them are classified as people included in the formal financial market. The paper uses the principle of adoption to estimate the factors that determine or otherwise the inclusion of adult individuals across Ghana in the formal financial market. This is because services provided by actors in the formal financial market are seen as innovations that can either be adopted or not adopted by the target group. This is particularly so because just as in the case of innovations, individuals will only find the need to be included in the formal financial market if they perceive that the benefits thereof will be more than the costs. The logit model was therefore employed to examine the determinants of individual adults’ inclusion in the formal financial market of Ghana. Note that the formal financial market in this paper is made up principally of banks, insurance companies, credit unions and microfinance institutions that provide financial products for their customers. The use of the logit model for this analysis is informed by the fact that adoption is known to be logistic in nature
- 3. Research Journal of Finance and Accounting www.iiste.org ISSN 2222-1697 (Paper) ISSN 2222-2847 (Online) Vol.4, No.8, 2013 3 (see for example Griliches, 1957; Alston et al., 1995; cited in Akudugu et al., 2012). The underlying theoretical foundation of the analyses in this paper is the threshold decision-making theory proposed by Hill and Kau (1973), Pindyck and Rubinfeld (1998a) and Greene (2003). The theory as it applies to this paper notes that when individuals are faced with a decision to seek inclusion or not to be included in the formal financial market of Ghana, there is a reaction threshold inherent in them which is dependent on a set of factors. At a given level of stimulus below the threshold, the individuals will not seek to be included in the formal financial market while at the critical threshold level the desire to be included in the formal financial market is stimulated. This phenomenon is captured in a mathematical relationship as: = + (1) Where in this case is equal to one (1) when an individual makes the choice to be included in the formal financial market and zero (0) otherwise. This means that: = 1 if is greater than or equal to a critical value, X* and = 0 if is less than a critical value, X* . Note that X* represents the combined effects of the independent variables ( ) at the threshold level. Equation 1 represents a binary choice model involving the estimation of the probability of individual adults being included in the formal financial market of Ghana (Y) given a set of factors (X) which are exogenous to the individual adults. Mathematically, this is represented as: = 1 = ′ (2) = 0 = 1 − ′ (3) Where: is the observed response for the individual adult who is either included or not included in the formal financial market of Ghana. This means that = 1 for an individual adult who is included in the formal financial market and = 0 for an individual adult who is excluded from the formal financial market. is a set of independent variables such as age, gender and level of education among others, associated with the individual, which determine the probability of inclusion in the formal financial market, (P). The function, F may take the form of a normal, logistic or probability function. The logit model uses a logistic cumulative distributive function to estimate, P as follows (Pindyck & Rubinfeld, 1998b): = 1 = ′ ′ (4) = 0 = 1 − ′ ′ = ′ (5) According to Greene (2008), the probability model is a regression of the conditional expectation of Y on X giving: / = 1[ ′ ] + 0[1 − ′ ] = ′ (6) Since the model is non-linear, the parameters are not necessarily the marginal effects of the various independent variables. The relative effect of each of the independent variables on the probability of inclusion in the formal financial market by individual adults across Ghana is obtained by differentiating equation (6) with respect to and this results in equation (7) (Greene, 2008): ! "!# = $ % ′ & % ′ ' () = ′ [1 − ′ ] (7) The maximum likelihood method was used to estimate the parameters. This estimation procedure resolves the problem of heteroscedasticity associated with other estimation procedures such as the Linear Probability Model (LPM). It constrains the conditional probability of inclusion of individual adults in the formal financial market to lie between zero (0) and one (1). The use of the logit model in this paper over the probit model is because of its mathematical convenience and simplicity as noted by Greene (2008). Besides, it has been used by a number of researchers in related studies (examples include Akudugu et al., 2009; Akudugu, 2012; Akudugu et al., 2012; Dufhues et al., 2013). The empirical model for the logit estimation is specified as follows: * + ! , ! = - + + . (8) Where: * + ! , ! = The log-odds in favour of inclusion in the formal financial market; = The combined effects of X explanatory variables that determine or otherwise the inclusion of individual adults in the formal financial market and ranges from … defined as follows: X1 = Gender (Dummy: 1 = Male; 0 = Otherwise) X2 = Age of the individual adult (Years) X3 = Age square (Years) X4 = Literacy (Dummy: 1 = Literate; 0 = Otherwise) X5 = Wealth class of individual adult (Dummy: 1 = Poorest 20%; 0 = Otherwise)
- 4. Research Journal of Finance and Accounting www.iiste.org ISSN 2222-1697 (Paper) ISSN 2222-2847 (Online) Vol.4, No.8, 2013 4 X6 = Distance to formal financial institution (Dummy: 1 = Problem; 0 = Otherwise) X7 = Cost (Dummy: 1 = Expensive to be included; 0 = Otherwise) X8 = Documentation (Dummy: 1 = Lack of documentation; 0 = Otherwise) X9 = Trust (Dummy: 1 = Lack of trust for formal financial institutions; 0 = Otherwise). X10= Money (Dummy: 1 = Lack of money; 0 = Otherwise). X11= Family influence (Dummy: 1 = Family member included; 0 = Otherwise). The estimation of the empirical model was done using STATA (Version 11). 3. Results and Discussion The results show that about 40 percent of the research participants are included in the formal financial market of Ghana with the remaining 60 percent of them excluded. This implies that the level of financial inclusion in the formal financial market in Ghana is less than the global financial inclusion index of 50 percent (Demirgüç-Kunt & Klapper, 2012). Demographically, about 49 percent of the research participants were males and the remaining 51 percent were females (Table 1). This is an indication of near gender parity which means that the results are representative of men and women on issues of financial inclusion in Ghana. The research participants were found to be within the age cohort of 15 to 98 years and average of about 36 years. The implication of this is that the results reflect the views of the different generations on financial inclusion. Thus the outcome of this paper captures the concerns and views of the young, the middle age and the old on financial inclusion or exclusion across Ghana. Majority (65%) of the research participants were literate with the remaining 35 percent of them being illiterate. As such, the results capture the interests of the literate and illiterate regarding financial inclusion in Ghana. In terms of the wealth class, about 22 percent of the research participants belonged to the poorest 20 percent across the country with the remaining 78 percent belonging to the other segments of wealth categorization. This implies the results reflect different categories of people irrespective of their wealth class. A number of the research participants (15%) indicated that distance is a challenge to their inclusion in the formal financial market with the remaining 85 percent saying otherwise. Also, 12 percent of the research participants noted that it is costly to be included in the formal financial market with the remaining 88 percent saying otherwise. With regards to documentation, about 14 percent of the research participants stated it is difficult to provide the requisite documents to be able to be included in the formal financial market with the remaining 86 percent saying otherwise. The results also revealed that about 10 percent of the research participants do not trust the formal financial institutions with the remaining 90 percent saying otherwise. It was further found that about half (50%) of the research participants indicated that lack of money affects inclusion in the formal financial market with the remaining half (50%) saying otherwise. Finally, about 3 percent of the research participants stated they had relatives who are included in the formal financial market with the remaining 97 percent saying otherwise (Table 1). To examine the how the various factors identified (Table 1) determine the inclusion of individual adults across Ghana in the formal financial market, the logit model was estimated. The regression yielded a Likelihood Ratio (LR) of about 936 which is statistically significant at 1 percent. This implies that all the variables included in the model jointly influence the probability of inclusion of individual adults in the formal financial market of Ghana (Table 2). A Pseudo R2 of 0.6935 means that the included variables are able to explain about 69 percent of the variations in the probability of individual adults being included in the formal financial market of Ghana. The goodness of fit measures (LR and Pseudo R2 ) indicates that the model used for the estimation is robust. At the individual variable level, gender was found to have a positive influence on the probability of inclusion in the formal financial market of Ghana. This means that adult males are most likely to be included in the formal financial market than their female counterparts. It was however, found not to be a statistically significant determinant of inclusion of individual adults in the formal financial market of Ghana. The age of individual adults was found to have a positive influence on the probability of inclusion in the formal financial market of Ghana and is statistically significant at 1 percent (Table 2). This means that an extra year gained by individuals leads to an increase of about 0.02 in his or her probability of inclusion in the formal financial market of Ghana (Table 2). This however, reduces as one reaches an old age. This is captured in the age squared variable which is negatively related to the probability of inclusion in the formal financial market and is statistically significant at 1 percent. The implication here is that age assumes a quadratic function. As people move from childhood to adulthood, the probability of their inclusion in the formal financial market increases up to a point when they pass the economically active age group and then the probability starts to decrease hence the negative relationship. Thus as one reaches old age, every extra year gain leads to the probability of being included in the formal financial market of Ghana declining by about 0.0002. This finding supports that of Akudugu (2012) who found in his study that individuals’ demand for financial services from formal sources decline as they grow pass their economically active age group. The literacy level was found to be a positive determinant of inclusion of individual adults in the formal financial
- 5. Research Journal of Finance and Accounting www.iiste.org ISSN 2222-1697 (Paper) ISSN 2222-2847 (Online) Vol.4, No.8, 2013 5 market of Ghana (Table 2). It is statistically significant at 1 percent. This implies that people who are literate are more likely to be included in the formal financial market of Ghana than their illiterate counterparts. The probability that a literate individual adult will be included in the formal financial sector of Ghana is about 0.11 higher than an illiterate individual (Table 2). A negative relationship between individual adults within the poorest 20 percent and the probability of inclusion in the formal financial was found and is statistically significant at 10 percent (Table 2). This means that the probability of individuals within the poorest 20 percent of the population of Ghana being included in the formal financial market is about 0.05 less than the probability of individuals outside this group. The implication of this is that the poorest in Ghana who are the most vulnerable and require assistance from the formal financial market of the country are less likely to be targeted by actors in that market. Distance was found to have a negative relationship with the probability of inclusion of individual adults in the formal financial market of Ghana. It is statistically significant at 1 percent (Table 2). This means that people who see the distance to formal financial institutions to be a problem are less likely to be included in the formal financial market of Ghana than their counterparts who see it otherwise. The probability that individual adults who think that distance is a problem will be included in the formal financial market is about 0.13 less than those who think otherwise (Table 2). Though the cost of inclusion in the formal financial market was found to be positively related to the probability of inclusion in the formal financial market, it is not a statistically significant determinant. Regarding documentation, it was found that the lack of documentation is negatively related to the probability of inclusion in the formal financial market. It is statistically significant at 1 percent (Table 2). This means that individuals who lack documentation are less likely to be included in the formal financial market of Ghana. Thus the probability that an individual adult who lacks documentation is included in the formal financial market is about 0.14 less than those who have documentation (Table 2). Another important determinant of financial inclusion is the lack of trust for formal financial institutions by individuals. This was found to be negatively related to the probability of inclusion in the formal financial market and is statistically significant at 1 percent (Table 2). This means that individuals who do not have trust in the formal financial market are less likely to be included in it compared to those who have trust in it. The probability that individual adults in Ghana who lack trust in the formal financial market will be included in it was found to be about 0.14 less than those who have trust in the formal financial market of the country (Table 2). Lack of money is negatively related to the probability of inclusion in the formal financial market of Ghana and is statistically significant at 1 percent (Table 2). The negative relationship implies that people who perceived that they did not have enough money are less likely to be included in the formal financial market than those who think otherwise. Thus the probability that an individual who perceived that he or she does not have money is included in the formal financial market of Ghana is about 0.62 less than those who perceive otherwise (Table 2). This is particularly so because people involved in the formal financial market of Ghana are perceived to be the rich and thus the formal financial market is seen as the preserve of people in society who are well to do. Besides, inclusion of relations in the formal financial market was found to be positively related to the probability of inclusion of individual adults in the formal financial market and this is statistically significant at 1 percent (Table 2). This means that individual adults who have relatives being included in the formal financial market are more likely to also be included than those who do not have any relations included in the formal financial market. The probability that individual adults who have relatives included in the formal financial market will be included in the formal financial market is about 0.16 higher than those who do not have any relations included in the formal financial market of Ghana (Table 2). This can be attributed to spill-over effects. 4. Conclusion and policy implications There is low financial inclusion across developing countries, especially those in Sub-Saharan Africa including Ghana. The results show that the formal financial market of Ghana has been able to cover only 40 percent of the population which means an overwhelming 60 percent of the population is still unbanked. In other words, two in five adult individuals are included in the formal financial sector of Ghana with the remaining three in five being excluded. Factors such as age, literacy, wealth class, distance, lack of documentation, lack of trust for formal financial institutions, money poverty and social networks as reflected in family relations are the significant determinants of financial inclusion in Ghana. The implication of this for policy is that there is the need for governments in Western Africa, especially the government of Ghana and its development partners to formulate a holistic financial framework that seeks to mitigate the negative determinants of financial inclusion and sustained the positive ones. This framework should aim at integrating the formal and informal financial markets to build synergy and leverage capacity to be able to bring most of the currently unbanked population into the mainstream financial market. Such a policy framework must be made sustainable by ensuring that it is politically neutral, economically viable, gender sensitive, socially stable and financially feasible.
- 6. Research Journal of Finance and Accounting www.iiste.org ISSN 2222-1697 (Paper) ISSN 2222-2847 (Online) Vol.4, No.8, 2013 6 References Adams, D. W., Gonzalez-Vega, C., & Von Pischke, J. D. (1987). Cretio agricola desarrollo rural: La nueva vision. Columbus: OH: Ohio State University. Akudugu, M. A. (2010). Assessment of access to financial capital by rural people in Ghana: The case of the Upper East Region. Savings and Development, 34(2), 169-189. Akudugu, M. A. (2012). Estimation of the determinants of credit demand by farmers and supply by Rural Banks in Ghana's Upper East Region. Asian Journal of Agriculture and Rural Development, 2(2), 179-190. Akudugu, M. A., Egyir, I. S., & Akwasi, M.-B. (2009). Women farmers’ access to credit from rural banks in Ghana. Agricultural Finance Review, 69(3), 284 – 299. Akudugu, M. A., Guo, E., & Dadzie, S. K. (2012). Adoption of modern agricultural production technologies by farm households in Ghana: What factors influence their decisions? Journal of Biology, Agriculture and Healthcare, 2(3), 1-13. Alston, J. M., Norton, G. W., & Pardey, P. G. (1995). Science under Scarcity: Principles and practice of agricultural research evaluation and priority setting. Ithaca: Cornell University Press. Armendáriz de Aghion, B., & Morduch, J. (2005). The economics of microfinance (1st Edition) (Vol. First Edition): Massachuttes Institute of Technology. Armendáriz de Aghion, B., & Morduch, J. (2010). The economics of microfinance (2nd Edition) (Vol. Second Edition): Massachuttes Institute of Technology. Aryeetey, E. (2003). Recent developments in African financial markets: Agenda for further research. Journal of African Economies, 12(2), ii111- ii152. Atieno, R. (2001). Formal and informal institutions' lending policies and access to credit by small-scale enterprises in Kenya: An empirical assessment. African Economic Research Consortium Research Paper 111, pp.46. Awunyo-Vitor, D., & Abankwah, V. (2012). Substitutes or complements: Formal and informal credit demand by maize farmers in Ashanti and Brong Ahafo Regions of Ghana. The Journal of Agricultural Science, 7(1), 1-13. Ayamga, M., Sarpong, D. B., & Asuming-Brempong, S. (2006). Factors influencing the decision to participate in microcredit programmes: An illustration for Northern Ghana. Ghana Journal of Development Studies, 3(2), 57 – 65. Bose, P. (1998). Formal-informal sector interaction in rural credit markets. Journal of Development Economics, 56, 265-280. Braverman, A., & Guasch, J. L. (1997). Rural credit in developing countries. World Bank Working Paper Series, 219, 39pp. Chakrabarty, D., & Chaudhuri, A. (2001). Formal and informal sector credit institutions and interlinkage. Journal of Economic Behavior and Organization, 46, 313-325. Chaudhuri, S., & Gupta, M. R. (1996). Delayed formal credit, bribing and the informal credit market in agriculture: A theoretical analysis. Journal of Development Economics, 51, 433-449. Christen, R. P., & Pearce, D. (2005). Measuring risks and designing products for agricultural microfinance: Features of an emerging model. CGAP Workin Paper 11, 86p. Demirgüç-Kunt, A., & Klapper, L. (2012). Financial inclusion in Africa : An Overview. World Bank Policy Research Working Paper, WPS No. 6088. Diagne, A. (1999). Determinants of household access to and participation in formal and informal credit markets in Malawi. IFPRI Food Consumption and Nutrition Division Discussion Paper, 67, 57pp. Dufhues, T., Buchenrieder, G., & Munkung, N. (2013). Social Capital and Market Imperfections: Accessing Formal Credit in Thailand. Oxford Development Studies(ahead-of-print), 1-22. Giné, X. (2011). Access to capital in rural Thailand: An estimated model of formal vs. informal credit. Journal of Development Economics, 29, 16-29. Gonzalez-Vega, C. (Ed.). (1983). Arguments for interest rate reform. Baltimore: The Johns Hopkins University Press. Greene, W. H. (2003). Econometric analysis 5th Edition. New Jersey: Prentice Hall. Greene, W. H. (2008). Econometric Analysis, 6th Edition. Upper Saddle River, New Jersey: Prentice-Hall, New York University. Griliches, Z. (1957). Hybrid corn: An exploration in the economics of technological change. Econometrica, 25, 501-522. Guirkinger, C. (2008). Understanding the Coexistence of Formal and Informal Credit Markets in Piura, Peru. World Development, 36(8), 1436–1452. Hill, L., & Kau, P. (1973). Application of multivariate probit to a threshold model of grain dryer purchasing decisions. American Journal of Agricultural Economics, 55, 19-27.
- 7. Research Journal of Finance and Accounting www.iiste.org ISSN 2222-1697 (Paper) ISSN 2222-2847 (Online) Vol.4, No.8, 2013 7 Huang, Y. (2010). Political institutions and financial development: An empirical study. World Development, 38(12), 1667–1677. IFAD. (2003). Ghana: Women's access to formal financial services Retrieved from www.ifad.org/gender/learning/sector/finance/42.htm on April 16, 2012 Jain, S. (1999). Symbiosis vs. crowding-out: The interaction of formal and informal credit markets in developing countries. Journal of Development Economics, 59, 419-444. Kabango, G. P., & Paloni, A. (2011). Financial liberalization and the industrial response: Concentration and entry in Malawi. World Development, 39(10), 1771-1783. Khandker, S. R. (2005). Microfinance and poverty: Evidence using panel data from Bangladesh. The World Bank Economic Review, 19(22), 263–286. Khandker, S. R., & Faruqee, R. R. (2003). The impact of farm credit in Pakistan. Agricultural Economics, 28, 197-213. Kibaara, B. (2006). Rural Financial Services in Kenya: What is Working and Why. Tegemeo Working paper (25). Mehrens, W. A., & Lehmann, I. J. (1987). Using standardized tests in education. New York: Longman Onumah, G. (2003). Improving access to rural finance through regulated warehouse systems in Africa. Paper presented at the USAID - World Council of Credit Unions Conference, Washington DC. Pindyck, S. R., & Rubinfeld, L. D. (1998a). Econometric Models and Economic Forecasts 4th Edition. New York: McGraw-Hill. Pindyck, S. R., & Rubinfeld, L. D. (1998b). Econometric models and economic forecasts, 4th Edition. New York: McGraw-Hill Quaye, W. (2008). Food Security Situation in Northern Ghana, Coping Strategies and Related Constraints. African Journal of Agricultural Research, 3(5), 334-342. Rahji, M. A. Y., & Fakayode, S. B. (2009). A multinomial logit analysis of agricultural credit rationing by commercial banks in Nigeria International Research Journal of Finance and Economics (24), 90-100. Rutherford, S. (2000). The poor and their money: Oxford University Press. Schindler, K. (2010). Credit for what? Informal credit as a coping strategy of market women in northern Ghana. Journal of Development Studies, 46(2), 234-253. Sebstad, J., & Cohen, M. (2001). Microfinance risk management and poverty. Washington DC: Pact Publications. Steel, W. F., Aryeetey, E., & Nissanke, M. (1997). Informal financial markets under liberalisation in four African countries. World Development, 25(5), 817-830. Straub, S. (2005). Informal sector: The credit market chanel. Journal of Development Economics, 78, 299-321. Swaminathan, H., Du Bois, R. S., & Findeis, J. L. (2010). Impact of access to credit on labor allocation patterns in Malawi. World Development, 38(4), 555–566. Tang, S.-Y. (1995). Informal credit markets and economic development in Taiwan. World Development, 23(5), 845-855. Todaro, M. R., & Smith, S. C. (2011). Economic Development. Essex: Pearson Education Limited. Vogel, R. C. (1981). Rural financial markets: Implications of low deliquency rates. American Journal of Agricultural Economics, 63(1), 58-65. Vogel, R. C. (1984a). The impact of subsidized credit on income distribution in Costa Rica. Bolder CO: Westview Press. Vogel, R. C. (Ed.). (1984b). Savings mobilisation: The forgotten half of rural finance. Boulder CO: Westview Press. Wehnert, U., & Shakya, R. (2001). Are SFCLs viable microfinance organisations?: A comprehensive financial analysis of 33 SFCLs. Kathmandu: Rural Finance Working Paper 1.
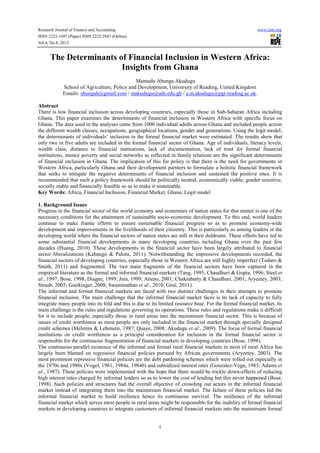
- 8. Research Journal of Finance and Accounting www.iiste.org ISSN 2222-1697 (Paper) ISSN 2222-2847 (Online) Vol.4, No.8, 2013 8 Appendix Table 1: Distribution of the variables Dependent variable: Inclusion in formal financial market Variable Description Unit of Measurement Freq./Mean/Range Financial Inclusion Adults with formal accounts, savings and credit Dummy Included = 404 Excluded = 596 Independent variables Variable Description Unit of Measurement Freq./Mean/Range X1 Gender of respondent Dummy Male = 491 Female = 509 X2 Age of respondent Years Mean = 35.5 Range = 15 - 98 X3 Age square: Proxy for old age Years Mean = 1496.4 Range = 225 - 9604 X4 Literacy level of respondents Dummy Literate = 650 Illiterate = 350 X5 Wealth class of respondent Dummy Poorest 20% = 215 Otherwise = 785 X6 Distance to financial institution Dummy Far = 151 Otherwise = 849 X7 Cost of inclusion Dummy Costly = 117 Otherwise = 883 X8 Documentation of eligibility Dummy Difficult = 137 Otherwise = 863 X9 Trust for formal financial institutions by respondents Dummy Has trust = 97 Otherwise = 903 X10 Money to participate in formal financial market by respondent Dummy Has money = 495 Otherwise = 505 X11 Inclusion of relatives in the formal financial market Dummy Included = 31 Otherwise = 969 Source: Author’s computation based on data from Demirgüç-Kunt and Klapper (2012) Logit regression results (Table 2) Source: Author’s estimations based on data from Demirgüç-Kunt and Klapper (2012) ____ccccoooonnnnssss ----4444....555511113333666611116666 ....9999000022226666222200002222 ----5555....00000000 0000....000000000000 ----6666....222288882222777711119999 ----2222....777744444444555511113333 ffffaaaammmmiiiillllyyyyiiiinnnnffffllll~~~~eeee 1111....999900009999000066668888 1111....000044446666555599991111 1111....88882222 0000....000066668888 ----....1111444422222222111122221111 3333....999966660000333344449999 nnnnoooommmmoooonnnneeeeyyyy ----5555....666622222222444422224444 ....4444555500005555555522226666 ----11112222....44448888 0000....000000000000 ----6666....555500005555444499991111 ----4444....777733339999333355557777 ttttrrrruuuusssstttt ----4444....777755559999888800005555 ....8888444411118888222233337777 ----5555....66665555 0000....000000000000 ----6666....444400009999777744449999 ----3333....111100009999888866661111 ddddooooccccuuuummmmeeeennnnttttaaaatttt~~~~nnnn ----3333....666655558888999922225555 ....7777444466661111111133334444 ----4444....99990000 0000....000000000000 ----5555....111122221111222288881111 ----2222....11119999666655557777 ccccoooosssstttt 1111....000077770000222288885555 ....6666777700009999777755553333 1111....66660000 0000....111111111111 ----....2222444444448888000022222222 2222....333388885555333377773333 ddddiiiissssttttaaaannnncccceeee ----2222....999988888888444411118888 1111....000088880000000066661111 ----2222....77777777 0000....000000006666 ----5555....1111000055553333 ----....8888777711115555333366667777 wwwweeeeaaaalllltttthhhhccccllllaaaassssssss ----....5555666677774444444455551111 ....3333444422228888111177776666 ----1111....66666666 0000....000099998888 ----1111....222233339999333355555555 ....111100004444444466665555 eeeedddduuuuccccaaaattttiiiioooonnnn 1111....555533332222444400006666 ....3333000099994444111122224444 4444....99995555 0000....000000000000 ....9999222255559999666699992222 2222....111133338888888844443333 aaaaggggeeeessssqqqq ----....0000000022227777333322228888 ....0000000000005555000077773333 ----5555....33339999 0000....000000000000 ----....0000000033337777222277771111 ----....0000000011117777333388884444 aaaaggggeeee ....2222666633335555666688888888 ....0000444444448888333344442222 5555....88888888 0000....000000000000 ....1111777755556666999955554444 ....3333555511114444444422223333 ggggeeeennnnddddeeeerrrr ....1111999955556666000033331111 ....2222666644448888333300001111 0000....77774444 0000....444466660000 ----....3333222233334444555544443333 ....7777111144446666666600006666 ppppaaaarrrrttttiiiicccciiiippppaaaatttt~~~~nnnn CCCCooooeeeeffff.... SSSSttttdddd.... EEEErrrrrrrr.... zzzz PPPP>>>>||||zzzz|||| [[[[99995555%%%% CCCCoooonnnnffff.... IIIInnnntttteeeerrrrvvvvaaaallll]]]] LLLLoooogggg lllliiiikkkkeeeelllliiiihhhhoooooooodddd ==== ----222200006666....77777777999955555555 PPPPsssseeeeuuuuddddoooo RRRR2222 ==== 0000....6666999933335555 PPPPrrrroooobbbb >>>> cccchhhhiiii2222 ==== 0000....0000000000000000 LLLLRRRR cccchhhhiiii2222((((11111111)))) ==== 999933335555....66664444 LLLLooooggggiiiissssttttiiiicccc rrrreeeeggggrrrreeeessssssssiiiioooonnnn NNNNuuuummmmbbbbeeeerrrr ooooffff oooobbbbssss ==== 1111000000000000
- 9. Research Journal of Finance and Accounting www.iiste.org ISSN 2222-1697 (Paper) ISSN 2222-2847 (Online) Vol.4, No.8, 2013 9 Source: Author’s estimations based on data from Demirgüç-Kunt and Klapper (2012) ((((****)))) ddddyyyy////ddddxxxx iiiissss ffffoooorrrr ddddiiiissssccccrrrreeeetttteeee cccchhhhaaaannnnggggeeee ooooffff dddduuuummmmmmmmyyyy vvvvaaaarrrriiiiaaaabbbblllleeee ffffrrrroooommmm 0000 ttttoooo 1111 ffffaaaammmmiiiillllyyyy~~~~eeee ....111155559999555533332222 ....00008888777777771111 1111....88882222 0000....000066669999 ----....000011112222333377774444 ....333333331111444433338888 ....000033331111 nnnnoooommmmoooonnnneeeeyyyy**** ----....6666111155551111777744445555 ....00005555333322229999 ----11111111....55554444 0000....000000000000 ----....77771111999966662222 ----....555511110000777722229999 ....444499995555 ttttrrrruuuusssstttt**** ----....1111333377771111888811113333 ....00003333000022224444 ----4444....55554444 0000....000000000000 ----....111199996666444444445555 ----....000077777777999911117777 ....000099997777 ddddooooccccuuuummmmeeee~~~~nnnn**** ----....1111333399990000555566665555 ....00003333000022229999 ----4444....55559999 0000....000000000000 ----....111199998888444422226666 ----....000077779999666688887777 ....111133337777 ccccoooosssstttt**** ....1111222244447777666666665555 ....11110000333300006666 1111....22221111 0000....222222226666 ----....000077777777222233331111 ....333322226666777766664444 ....111111117777 ddddiiiissssttttaaaannnncccceeee**** ----....1111222299993333666611116666 ....00002222777744441111 ----4444....77772222 0000....000000000000 ----....111188883333000099992222 ----....000077775555666633331111 ....111155551111 wwwweeeeaaaalllltttthhhh~~~~ssss ----....0000444477774444111188888888 ....00002222999999999999 ----1111....55558888 0000....111111114444 ----....111100006666111199994444 ....000011111111333355557777 ....222211115555 eeeedddduuuuccccaaaatttt~~~~nnnn**** ....1111111111116666222222229999 ....00002222999955554444 3333....77778888 0000....000000000000 ....000055553333777733333333 ....111166669999555511113333 ....66665555 aaaaggggeeeessssqqqq ----....0000000000002222222288884444 ....00000000000000006666 ----3333....77778888 0000....000000000000 ----....000000000000333344447777 ----....00000000000011111111 1111444499996666....4444 aaaaggggeeee ....0000222222220000222255552222 ....00000000555555556666 3333....99996666 0000....000000000000 ....000011111111111111118888 ....000033332222999933332222 33335555....5555 ggggeeeennnnddddeeeerrrr**** ....0000111166663333888822221111 ....00002222222277771111 0000....77772222 0000....444477771111 ----....000022228888111122221111 ....000066660000888888885555 ....444499991111 vvvvaaaarrrriiiiaaaabbbblllleeee ddddyyyy////ddddxxxx SSSSttttdddd.... EEEErrrrrrrr.... zzzz PPPP>>>>||||zzzz|||| [[[[ 99995555%%%% CCCC....IIII.... ]]]] XXXX ==== ....00009999222200003333666600001111 yyyy ==== PPPPrrrr((((ffffiiiinnnnaaaannnncccciiiiaaaalllliiiinnnncccclllluuuussssiiiioooonnnn)))) ((((pppprrrreeeeddddiiiicccctttt)))) MMMMaaaarrrrggggiiiinnnnaaaallll eeeeffffffffeeeeccccttttssss aaaafffftttteeeerrrr llllooooggggiiiitttt
- 10. This academic article was published by The International Institute for Science, Technology and Education (IISTE). The IISTE is a pioneer in the Open Access Publishing service based in the U.S. and Europe. The aim of the institute is Accelerating Global Knowledge Sharing. More information about the publisher can be found in the IISTE’s homepage: http://www.iiste.org CALL FOR PAPERS The IISTE is currently hosting more than 30 peer-reviewed academic journals and collaborating with academic institutions around the world. There’s no deadline for submission. Prospective authors of IISTE journals can find the submission instruction on the following page: http://www.iiste.org/Journals/ The IISTE editorial team promises to the review and publish all the qualified submissions in a fast manner. All the journals articles are available online to the readers all over the world without financial, legal, or technical barriers other than those inseparable from gaining access to the internet itself. Printed version of the journals is also available upon request of readers and authors. IISTE Knowledge Sharing Partners EBSCO, Index Copernicus, Ulrich's Periodicals Directory, JournalTOCS, PKP Open Archives Harvester, Bielefeld Academic Search Engine, Elektronische Zeitschriftenbibliothek EZB, Open J-Gate, OCLC WorldCat, Universe Digtial Library , NewJour, Google Scholar