Investigating the impact of global financial crisis on indian
•
0 gostou•573 visualizações

The International Institute for Science, Technology and Education (IISTE) Journals Call for paper http://www.iiste.org/Journals

Recomendados
Recomendados
Mais conteúdo relacionado
Mais procurados
Mais procurados (18)
Destaque
Semelhante a Investigating the impact of global financial crisis on indian
Semelhante a Investigating the impact of global financial crisis on indian (20)
Mais de Alexander Decker
Mais de Alexander Decker (20)
Último
Último (20)
Investigating the impact of global financial crisis on indian
- 1. Journal of Economics and Sustainable Development www.iiste.org ISSN 2222-1700 (Paper) ISSN 2222-2855 (Online) Vol.3, No.8, 2012 Investigating the Impact of Global Financial Crisis on Indian Economy in an Aggregate Demand Framework Raj Rajesh1* Sanjib Bordoloi2 1. Assistant Adviser, DEPR, Reserve Bank of India, South Gandhi Maidan, Patna 800 001, Bihar, India. Also Research Scholar, Indian Institute of Technology Patna. 2. Assistant Adviser, DSIM, Reserve Bank of India, C8-6th Floor, Bandra Kurla Complex, Mumbai 400 051, India. * E-mail of the corresponding author: rrajesh@rbi.org.in Abstract In this paper, the impact of global financial crisis on India’s Gross Domestic Product (GDP) is investigated upon in an aggregate demand framework using quarterly data for the period from Q2 of 1996 to Q1 of 2010. GDP, consumption expenditure, capital formation and export were found to be co-integrated. Co-integration estimation re-affirms that domestic consumption remains the key driver of India’s GDP growth. Our analysis establishes that though India’s trade sector dwindled and investment activity declined in the aftermath of global financial crisis, its GDP growth slackened only marginally as domestic consumption provided the necessary buffer in limiting the adverse impact of global financial crisis on the Indian economy. Keywords: India, Aggregate Demand, Trade, Financial Crisis. 1. Introduction A series of past economic and financial crises in this globalised economy has evidenced that even though crisis originates in a country/ region, it spreads to other countries through various channels. In this process, open economies remain more prone to economic crises. This great recession, being one of the worst crises since Great Depression, directly or indirectly, affected all the countries of the world. India also got impacted by the crisis as the economy is increasingly becoming globalised with the intensification of trade, invisible and capital flows in the last decade or so. Nevertheless, it is well known that unlike other more open emerging and developing economies, Indian economy remained relatively less affected by the global financial crisis (RBI, 2010; Mohanty, 2010; Das et. al, 2011). Against this setting, one of the foremost objectives of the paper is to understand as to why the impact of the global financial crisis on Indian economy had been limited or, in other words, what enabled India show a considerable resilience to the global economic crisis. In the present analysis, the impact of global financial crisis on the Indian economy is carried out in an aggregate demand framework. In the course of investigation, we also seek to gauge the relative importance of external factors (trade) vis-à-vis domestic factors (consumption and investment) in driving growth of the Indian economy. This disaggregated analysis helps us understand as to how the performance of these constituents affects India’s GDP as also any long-term relationship that may exist among these variables. So far, there have been only a few studies on impact of global financial crisis on Indian economy (RBI op.cit.; Mohanty op.cit.; Das op.cit.). Mohanty op.cit. undertook analysis of the recent global financial crisis through three distinct phases since the second half of 2008-09. He found that despite sound fundamentals and no direct exposure to the sub-prime assets, India was affected by global financial crisis reflecting increasing globalization of the Indian economy. He contends that despite the fact that drivers of growth in India remain predominantly domestic, growing degree of synchronisation of the Indian trade and business cycles with the global cycles and increased financial integration in the recent period suggest that India cannot remain immune to global trends. RBI op.cit. purports that global financial crisis got transmitted to the Indian economy through three channels, viz., finance, trade, and confidence channels. For determining the relative dominance of these channels in transmitting the adverse impact of global financial crisis to the Indian economy, it carried out Vector Autoregression (VAR) analysis and the Cholesky variance decomposition, which suggest that about 50 per cent of variation in GDP is explained by financial variables, while export of goods and services explains about 9 per cent of output variation. Das op. cit. investigates the impact of global financial crisis on the Indian economy, with a particular focus on the services sector. They found that global financial crisis has adversely affected the services exports of the Indian economy and despite the decline in services 183
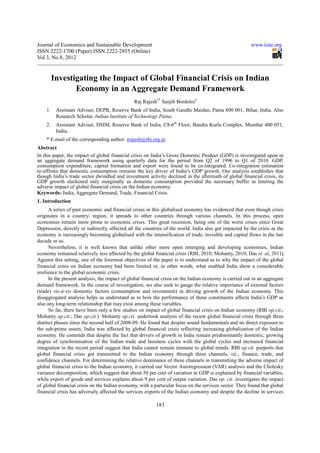
- 2. Journal of Economics and Sustainable Development www.iiste.org ISSN 2222-1700 (Paper) ISSN 2222-2855 (Online) Vol.3, No.8, 2012 exports, services sector continued to grow largely driven by growth in domestic demand and productivity. This has provided the economy an in-built resilience to external demand shocks, especially in the services sector. Nevertheless, none of the studies, to the best of our knowledge, has empirically examined the impact of recent crisis on the Indian economy in an aggregate demand framework. This paper, therefore, enriches and adds to the extant literature that investigates the impact of global financial crisis on the Indian economy. Besides, the present analysis is based on high frequency (quarterly) data, which presents a more detailed assessment and helps in better understanding and appreciation of the factors that provided the necessary buffer to the Indian economy in absorbing the adverse shocks of the crisis. This study also assumes importance from policy perspective in respect of designing countercyclical policies. The remainder of the paper is organized as follows: Section 2 describes how the components of aggregate demand behaved in the Indian economy in the aftermath of global financial crisis. Section 3 carries out empirical analysis. Concluding observations of the paper are set out in Section 4. 2.Trend in components of aggregate demand in the Indian Economy in the aftermath of Global Financial Crisis Sub-prime crisis (which later transformed to the great recession) originated in advanced economies in 2007. Nevertheless, this did not have much of impact on the Indian economy. As the crisis started deepening in 2008, it led to collapse of few global investment banks and the crisis started spreading to other countries. In the aftermath of the global crisis, the Indian economy started slowing down since the first quarter of 2008 with the growth moderating to 5.8% in the last quarter of 2008 (Figure 1). Nevertheless, the economy showing its resilience rebounded from the mid of 2009. In fact, India was among the first to exhibit strong rebound from the global downturn as compared to many advanced economies (Mohanty op. cit.). It would be appropriate to undertake an analysis of the components of expenditure side GDP data to have a deeper insight as to how the crisis impacted India’s GDP growth in the aftermath of recent crisis. Figure 1. Trend in Quarterly GDP Growth in India (Year-on-Year) Against this setting, for the present analysis, despite well-known limitations, constituents of expenditure side GDP data are being used as proxies for components of aggregate demand. Looking at the components of India’s GDP from the expenditure side, it is found that in the last few years of the pre-crisis period, apart from domestic consumption, capital formation was also contributing to GDP growth in a big way. In the aftermath of crisis, however, it was only the domestic consumption (sum of private and Government consumption) expenditure, which maintained an upward momentum, while other components had declined (Table 1). It may be mentioned that few rounds of fiscal stimulus provided by Government of India during 2008 and 2009, respectively also played a key role in sustaining the momentum of domestic consumption. Nevertheless, as Government consumption expenditure comprise only about one-sixth of total domestic consumption, in essence, upbeat private consumption expenditure provided the necessary momentum to domestic consumption expenditure (Figure 2). Private sector consumption expenditure, 184
- 3. Journal of Economics and Sustainable Development www.iiste.org ISSN 2222-1700 (Paper) ISSN 2222-2855 (Online) Vol.3, No.8, 2012 especially in rural areas, inter alia, benefited from the implementation of farm loan waiver scheme in June 2008, which waived INR 600 billion of farm loans due on agricultural farmers; hike in minimum support price in respect of a number of agricultural crops, which increased disposable income in the farm economy; and increased social sector outlay on welfare programmes of employment generation such as Mahatama Gandhi National Rural Employment Guarantee Scheme (MGNREGS), which guarantees a minimum employment of 100 days to the unemployed. Implementation of Sixth Pay Commission recommendations in September 2008, which raised the salaries of Government employees substantially, also aided the growth momentum of the private consumption expenditure. Investment demand, on the contrary, bore the brunt of the crisis as gross domestic capital formation recorded a decline in the second quarter of 2008, and thereafter in the fourth quarter of 2008 and first quarter of 2009, respectively on account of subdued business sentiments (Figure 3). The adverse effects of global financial crisis were clearly visible on India’s trade sector as both export and import declined with the intensification of the global financial crisis in mid-September 2008. While export declined for four quarters (from 2008Q4 to 2009Q3), import shrunk for three quarters (from 2009Q1 to 2009Q3) (Figure 4). Decline in India’s export coincided with the deepening of recession in the advanced economies, which reduced external demand for Indian goods and services. Import growth also received a setback in the midst of the global financial crisis following moderation in domestic economic activity, decline in export (which impacted the import of commodities such as gems and jewellery, which are processed and after value addition exported) and softening of crude oil and other commodity prices. Table 1. Trend in Share and Relative Contribution of Expenditure Components of GDP (Base 2004-05=100) (Per cent) Total Net Stocks, Domestic External Valuables & PFCE GFCE GDCF Demand Export Import Demand Discrepancies (a) (b) (c) (a+b+c) (d) (e) (d-e) (f) Share in GDP 2004-05 59.1 10.9 28.7 98.8 17.6 19.3 -1.8 3.0 2005-06 58.7 10.9 30.5 100.1 20.2 23.4 -3.2 3.1 2006-07 58.2 10.3 31.8 100.3 22.2 26.0 -3.8 3.5 2007-08 57.9 10.3 33.6 101.8 21.4 26.1 -4.7 2.8 2008-09 59.4 10.9 32.5 102.8 23.3 30.5 -7.2 4.3 2009-10 58.5 11.6 32.0 102.1 20.2 27.4 -7.2 5.1 2010-11 58.3 11.2 32.0 101.5 21.9 27.5 -5.6 4.1 Relative Contribution to GDP 2005-06 54.2 10.4 49.9 114.5 48.6 67.2 -18.6 4.1 2006-07 52.5 4.4 45.5 102.4 43.5 53.7 -10.2 7.8 2007-08 54.9 10.0 52.4 117.3 13.4 27.0 -13.6 -3.7 2008-09 90.5 22.3 10.4 123.3 62.4 120.0 -57.6 34.3 2009-10 47.8 19.6 26.2 93.6 -14.1 -6.1 -8.0 14.4 2010-11 57.1 6.3 31.3 94.7 41.1 28.6 12.5 -7.2 Source: Handbook of Statistics on Indian Economy, 2010-11, RBI. 185
- 4. Journal of Economics and Sustainable Development www.iiste.org ISSN 2222-1700 (Paper) ISSN 2222-2855 (Online) Vol.3, No.8, 2012 Figure 2. Trend in Quarterly Growth in Consumption Expenditure in India (Year-on-Year) Figure 3. Trend in Quarterly growth in Gross Domestic Capital Formation in India (Year-on-Year) Figure 4. Trend in Quarterly Growth in Export and Import in India (Year-on-Year) 186
- 5. Journal of Economics and Sustainable Development www.iiste.org ISSN 2222-1700 (Paper) ISSN 2222-2855 (Online) Vol.3, No.8, 2012 As seen above, while investment activity and external trade declined in the aftermath of economic crisis, domestic consumption expenditure, which alone accounts for about 70 per cent of India’s GDP, maintained its momentum. Thus, it is evident that preponderance of domestic consumption in India’s GDP provided the necessary cushion to the Indian economy to absorb the adverse effects of global crisis. This is what we would seek to validate empirically. 3. Empirical Estimation 3.1 Data description For the empirical estimation, we have used quarterly data (from the second quarter of 1996 till the first quarter of 2010) in respect of the following variables, viz. gross domestic product (GDP), final consumption expenditure (CONSE), gross domestic capital formation (CAPF), export (EXPORT), United States of America GDP (USGDP), and a dummy (DUMMY). In the model, the DUMMY has been introduced to differentiate the recent crisis period from the non-crisis period. In the pre-crisis time, dummy assumes a value equal to 0, for the crisis period when India’s trade sector remained badly affected, it assumes a value equal to 1. Since quarterly GDP figures for the world are not available, we have taken USA GDP (USGDP) as a proxy for global GDP. Our choice for the USGDP is guided by the fact that the USA is the largest economy of the world (accounting for about one-fourth of the global output) and is a significant trading partner for the Indian economy. India’s export seems to share a positive correlation with USGDP (Figure 5). The above-said variables were first log-transformed and then seasonally adjusted using U.S. Census Bureau’s X-12-ARIMA procedure. Figure 5. Trend in Quarterly Growth in India's Export and USA GDP (Year-on-Year) 3.2 Empirical Estimation Through empirical estimation, we seek to investigate the impact of global financial crisis on India’s GDP in an aggregate demand framework using co-integration and impulse response analysis. Through this estimation exercise, we seek to validate the hypothesis that domestic consumption expenditure provided the necessary buffer in saving the Indian economy from the worst onslaught of global financial crisis. Empirical estimation has been undertaken using the E-views 6.0 software. Stationarity of the variables has been checked using the Augmented Dickey Fuller (ADF) and Phillips Peron (PP) tests. The PP test indicates CAPF to be I(0), while all other variables are found to be I(1). The ADF test indicates all the above said variables to be first-difference stationary or I(1) (Table 2). 187
- 6. Journal of Economics and Sustainable Development www.iiste.org ISSN 2222-1700 (Paper) ISSN 2222-2855 (Online) Vol.3, No.8, 2012 Table 2: Unit Root Test using ADF and Phillips Peron tests Variables ADF Test Phillips Peron (PP) test Level (X) First Difference (∆X) Level (X) First Difference (∆X) LGDP -1.81 -8.76*** -1.72 -8.72*** (0.69) (0.00) (0.73) (0.00) LCONSE 6.14 -5.31*** 7.67 11.80*** (1.00) (0.00) (1.00) (0.00) LCAPF -3.02 -11.07*** -4.19*** - (0.14) (0.00) (0.01) LEXPORT -2.45 -5.40*** -2.49 -5.22*** (0.35) (0.00) (0.33) (0.00) LUSGDP -2.48 -3.51*** -2.02 -3.50*** (0.34) (0.01) (0.28) (0.01) Notes: a. ***, ** and * indicates significance at 1%, 5% and 10% level of significance, respectively. b. Figures inside the parentheses are the p-values of the null hypothesis of presence of unit roots. Given the non-stationarity involved in the data series, existence of a cointegrating or long-run relationship among the variables was examined through a multivariate cointegration analysis. First of all, Johansen cointegration test is carried out to know whether cointegration relationship exists among the variables (Table 3). From our analysis, the null hypothesis of no cointegration is rejected, while the null hypothesis of at most 1 cointegrating vector is accepted at 5% level of significance, for both Trace and Maximum-Eigenvalue statistics. The result, thus, demonstrates that the considered variables share a long-run equilibrium relationship amongst them implying that there is some adjustment process in the short-run, preventing the errors from becoming larger and larger in the long run equilibrium path. Table 3: Johansen Cointegration Test Result Series: LGDP_SA, LCONSE_SA, LCAPF_SA, LEXPORT_SA Exogenous Series: DUMMY ∆(LUSGDP_SA) Unrestricted Cointegration Rank Test (Trace) No. of Cointegrating Equations Eigenvalue Trace Statistic Critical Value (0.05) Probability None * 0.579058 70.02772 55.24578 0.0015 At most 1 * 0.239222 24.16891 35.01090 0.4339 At most 2 0.166582 9.678012 18.39771 0.5119 At most 3 0.000384 0.020370 3.841466 0.8864 Unrestricted Cointegration Rank Test (Maximum Eigenvalue) No. of Cointegrating Equations Eigenvalue Max-Eigen Statistic Critical Value (0.05) Probability None * 0.579058 45.85881 30.81507 0.0004 At most 1 * 0.239222 14.49089 24.25202 0.5430 At most 2 0.166582 9.657642 17.14769 0.4296 At most 3 0.000384 0.020370 3.841466 0.8864 We now estimate vector error correction model (VECM), which includes four seasonally adjusted endogenous variables in the following order: GDP (LGDP), total final consumption expenditure (LCONSE), gross domestic capital formation (LCAPF), and export (LEXPORT). The model also includes DUMMY (to capture the impact of global financial crisis on the Indian economy) and an exogenous variable (LUSGDP). The estimated relationship (figures in parentheses represent t-statistics) is as follows: 188
- 7. Journal of Economics and Sustainable Development www.iiste.org ISSN 2222-1700 (Paper) ISSN 2222-2855 (Online) Vol.3, No.8, 2012 LGDPt = 3.57 + 0.003 Trend + 0.60 (LCONSEt) + 0.10 (LCAPFt) + 0.07 (LEXPORTt) [0.93] [13.15*] [5.24*] [8.33*] From this relationship, CONSE, CAPF, and EXPORT were found to be significant and had elasticities 0.60, 0.10 and 0.07, respectively. This suggests that a 10 per cent rise in consumption expenditure results in a 6.0 per cent rise in GDP and that India’s economic growth remains essentially driven by the domestic consumption demand. On the contrary, a 10 per cent rise in capital formation or that of exports props up GDP by 1.0 per cent and 0.7 per cent, respectively. Thus, it suggests that any adverse development in the external trade sector would have only a relatively minimal impact on India’s GDP growth if the latter is cushioned by growth in domestic sectors. The short-term dynamics of the cointegrating relationship was examined as follows. The Error Correction term (ECM) was found to be significant with an expected negative sign, indicating its self-correcting mechanism. ∆LGDPt = - 0.55 ECMt-1+ 0.11 ∆LGDPt-1 - 0.01 ∆LGDPt-2 – 0.23 ∆LCONSEt-1– 0.25 ∆LCONSEt-2 – 0.03∆LCAPFt-1 (-2.97*) (0.66) (-0.08) (-2.59*) (-3.24*) (-1.48) - 0.01 ∆LCAPFt-2 – 0.07 ∆LEXPORTt-1 – 0.06 ∆LEXPORTt-2 + 0.01 + 0.001 Trend – 0.01 DUMMY (-0.69) (-2.99*) (-2.65*) (1.18) (4.85*) (-1.96*) + 0.57 ∆LUSGDPt (2.21*) Adj. R2 = 0.33, LM(8)= 17.99 (p-value = 0.32), JB = 12.55 (p-value = 0.13) The LM test statistic for residual autocorrelation up to lag 8 is found to be 17.99 with a probability value of 0.32 and hence accepts the null hypothesis of no serial autocorrelation. Similarly, the Jarque-Bera test statistic accepts the null hypothesis of normality assumption. Here, both DUMMY and USGDP were found to be significant with their expected signs. DUMMY as expected with a negative sign rightly captures the adverse fallout of global financial crisis on the Indian economy, albeit with a lower coefficient, it highlights minimal impact. USGDP with its positive sign highlights that a pick-up in economic activity in the US economy causes its imports to rise, which works to the advantage of India’s exports and thereby India’s GDP. Further, variance decomposition analysis is undertaken, which shows the proportion of variability of each variable on the part of variability resulting from the shock in the variable itself as also shocks in other variables. Variance decomposition for a period of one quarter to twenty quarters is presented (Table 4). The proportion by which the variance share of forecasting error is explained by the actual variables decreases over time. The results of variance decomposition for both GDP and CONSE show that after two quarters, about 70% of the variance of its forecasting error are self explained. On the contrary, EXPORT and CAPF explain about 80% and 68% of the variance of their forecasting errors after a quarter, reflecting their dependence on other variables. In case of CAPF, after a quarter, nearly 50% of the variance of its forecasting error is explained by CONSE and GDP, highlighting the dependence of investment activity on the latter variables. In case of exports, after five quarters, nearly 26% to 28% of variance is explained by CAPF. 189
- 8. Journal of Economics and Sustainable Development www.iiste.org ISSN 2222-1700 (Paper) ISSN 2222-2855 (Online) Vol.3, No.8, 2012 Table 4: Variance decomposition of the VECM Model GDP Quarters S.E. eGDP eCONSE eCAPF eEXPORT 1 0.008921 100.0000 0.000000 0.000000 0.000000 5 0.016276 70.60713 13.98803 12.68838 2.716463 10 0.021359 71.74453 12.01974 14.37363 1.862102 15 0.025444 71.85483 11.77965 15.03183 1.333688 20 0.028968 71.77332 11.77922 15.41653 1.030930 CONSE Quarters S.E. eGDP eCONSE eCAPF eEXPORT 1 0.023411 9.271979 90.72802 0.000000 0.000000 5 0.033767 20.18663 69.55649 8.037842 2.219043 10 0.043033 22.65131 67.32838 7.691333 2.328982 15 0.050312 23.95038 65.99200 7.485429 2.572183 20 0.056697 24.69522 65.34738 7.266282 2.691118 CAPF Quarters S.E. eGDP eCONSE eCAPF eEXPORT 1 0.072175 10.07783 22.02428 67.89789 0.000000 5 0.111880 12.69274 36.94077 42.16206 8.204435 10 0.145647 12.77762 38.10857 40.45210 8.661706 15 0.171056 12.97765 38.47886 39.54746 8.996029 20 0.193653 13.03315 38.87075 38.91663 9.179467 EXPORT Quarters S.E. eGDP eCONSE eCAPF eEXPORT 1 0.051218 1.223227 3.214114 15.31209 80.25056 5 0.102625 1.020455 10.19484 26.87212 61.91258 10 0.138379 0.661965 9.123271 27.36001 62.85476 15 0.166238 0.509570 8.806967 27.85919 62.82427 20 0.190069 0.428871 8.758333 28.16779 62.64500 Further, we undertake standard impulse response analysis. Standard impulse response functions describe the response of the system to a shock, with paths of all the variables endogenously determined. While the abscissa shows time expressed in quarters, the ordinate shows the level phenomena expressed in units of measurement. A shock to consumption expenditure was found to impact GDP positively and vice-versa (Figure 6). A shock to capital formation was found to have a positive impact on GDP for five quarters, but the impact gets weakened thereafter. A shock to GDP causes CAPF to peak in two quarters, which in subsequent time period diminishes. A shock to export was found to cause a decline in GDP for three quarters. A shock to GDP, however, is found to raise export for three quarters, thereafter the pace of expansion moderates. 190
- 9. Journal of Economics and Sustainable Development www.iiste.org ISSN 2222-1700 (Paper) ISSN 2222-2855 (Online) Vol.3, No.8, 2012 a. Response of LGDP_SA to Cholesky b. Response of LGDP_SA to Cholesky One S.D. LCONSE_SA Innovation One S.D. LCAPF_SA Innovation .005 .0040 .0035 .004 .0030 .003 .0025 .0020 .002 .0015 .0010 .001 .0005 .0000 .000 2 4 6 8 10 12 14 16 18 20 2 4 6 8 10 12 14 16 18 20 c. Response of LGDP_SA to Cholesky d. Response of LCONSE_SA to Cholesky One S.D. LEXPORT_SA Innovation One S.D. LGDP_SA Innovation .0012 .0090 .0008 .0085 .0004 .0080 .0000 .0075 -.0004 .0070 -.0008 .0065 -.0012 .0060 -.0016 -.0020 .0055 2 4 6 8 10 12 14 16 18 20 2 4 6 8 10 12 14 16 18 20 e. Response of LCAPF_SA to Cholesky f. Response of LEXPORT_SA to Cholesky One S.D. LGDP_SA Innovation One S.D. LGDP_SA Innovation .008 .024 .006 .022 .004 .020 .002 .018 .000 .016 -.002 .014 -.004 .012 -.006 2 4 6 8 10 12 14 16 18 20 .010 2 4 6 8 10 12 14 16 18 20 Figure 6. Impulse Response Analysis 4. Concluding Observations: Estimation suggests that for the Indian economy, GDP, consumption expenditure, capital formation and exports are co-integrated. In the co-integrating relationship, all these variables were found to prop up the GDP in the long-run. Empirical analysis establishes that USGDP (exogeneous variable) was significant in influencing the economic activity in the Indian economy. This suggests that the shocks of recent global crisis, which primarily originated in the US economy, also got transmitted to the Indian economy. Nevertheless, it is found that the adverse fallout of the recent crisis on the Indian economy remained minimal as the dummy with the negative sign was found to have a lower coefficient. 191
- 10. Journal of Economics and Sustainable Development www.iiste.org ISSN 2222-1700 (Paper) ISSN 2222-2855 (Online) Vol.3, No.8, 2012 A detailed analysis of the cointegration relationship suggests that amongst these variables, consumption expenditure had the highest elasticity of 0.6, which imply that a 10 per cent rise in consumption expenditure results in a 6 per cent rise in GDP and that domestic consumption remains the key driver of India’s GDP growth. Capital formation was found to have an elasticity of 0.1 suggesting that a 10 per cent rise in capital formation props up GDP by 1 per cent. Export was found to have a relatively lower elasticity of 0.7 per cent implying that any adverse development in the external sector would have only a relatively minimal impact on India’s GDP growth. Thus, despite the fact that both investment activity and external trade contracted in the aftermath of global crisis, domestic consumption expenditure, which was found to have remained steady, on the back of sustained momentum of the private sector consumption expenditure (aided by the implementation of some of the Government welfare schemes) and increased Government consumption expenditure on account of intended fiscal stimulus, shielded the Indian economy from the worst onslaught of the recent global financial crisis. The estimated result supports the hypothesis that preponderance of domestic consumption provided the necessary cushion to the Indian economy to absorb the adverse effects of global crisis. References Das, A.; D, R. Banga; and D. Kumar (2011), “Global Economic Crisis: Impact and Restructuring of the Services Sector in India”, ADBI Working Paper 311, Asian Development Bank Institute. [Online] Available: http://www.adbi.org/workingpaper/2011/09/30/4727.global.economic.crisis.impact.services.india/ (March 29, 2012) Fidrmuc, J. Iikka Korhonen (2010), “The Impact of the Global Financial Crisis on Business Cycles in Asian Emerging Economies”, Journal of Asian Economics, 21, 293–303. Mohanty, D. (2010), “Global Financial Crisis and the Indian Economy”, Reserve Bank of India Monthly Bulletin, November, 2331-2340. Reserve Bank of India (2010), Report on Currency and Finance, 2008-09. Reserve Bank of India (2011), Handbook of Statistics on the Indian Economy 2010-11. Disclaimer and Acknowledgements Views of the authors are personal and not of the institution they are attached with. Authors are thankful to Shri B.M. Mishra, Officer-in-Charge; and Shri K.U.B. Rao, Adviser, Department of Economic and Policy Research, RBI, Mumbai and Shri Mohit Kumar Singh, Regional Director, RBI, Patna for providing encouragement in doing this paper. Authors are thankful to Dr. Nalin Bharti, Assistant Professor, Indian Institute of Technology Patna, for his comments. This paper was also chosen (after peer review) for presentation in the International Conference on Applied Economics 2012 held in Sweden (Uppsala) during June 28-30, 2012. http://kastoria.teikoz.gr/icoae/wp-content/uploads/articles/2012/06/Final_programm_19_6_2012.pdf First Author, Raj Rajesh, is a life member of ‘Indian Association for Research in National Income and Wealth’ (2008). He was born at Dhanbad, India in 1977. He obtained his Master’s degree (in Economics) and M. Phil. from Jawaharlal Nehru University (JNU), New Delhi, India. He has been working for India’s Central Bank for about a decade and is currently ‘Assistant Adviser’ in the Department of Economic and Policy Research (DEPR) of the Reserve Bank of India. He is a certified Financial Risk Manager (FRM), Global Association of Risk Professionals (USA) and also a Certified Associate of the Indian Institute of Banking and Finance (IIBF). He has published papers in a number of peer-reviewed journals and an edited book and also presented papers in some of the international conferences. His research interests include industry, economic growth, international trade and business cycles. Second author, Sanjib Bordoloi, is a life member of the ‘Society of Statistics, Computer and Applications’ (2005) and ‘Indian Association for Research in National Income and Wealth’ (2008). He was born at Guwahati, India in 1972. He is a gold medalist in Master of Science (in Mathematical Statistics) from University of Delhi, Delhi, India in 1996. Presently, he is working as ‘Assistant Adviser’ in the Department of Statistics and Information Management (DSIM) 192
- 11. Journal of Economics and Sustainable Development www.iiste.org ISSN 2222-1700 (Paper) ISSN 2222-2855 (Online) Vol.3, No.8, 2012 of the Reserve Bank of India, Mumbai, where he has been working for the past fourteen years. He has published papers in a number of peer-reviewed journals and an edited book and also presented papers in some of the international conferences. His major field of study includes monetary policy transmission process, international economics, general equilibrium models, non-linear time series, bayesian econometrics and artificial neural network. 193
- 12. This academic article was published by The International Institute for Science, Technology and Education (IISTE). The IISTE is a pioneer in the Open Access Publishing service based in the U.S. and Europe. The aim of the institute is Accelerating Global Knowledge Sharing. More information about the publisher can be found in the IISTE’s homepage: http://www.iiste.org The IISTE is currently hosting more than 30 peer-reviewed academic journals and collaborating with academic institutions around the world. Prospective authors of IISTE journals can find the submission instruction on the following page: http://www.iiste.org/Journals/ The IISTE editorial team promises to the review and publish all the qualified submissions in a fast manner. All the journals articles are available online to the readers all over the world without financial, legal, or technical barriers other than those inseparable from gaining access to the internet itself. Printed version of the journals is also available upon request of readers and authors. IISTE Knowledge Sharing Partners EBSCO, Index Copernicus, Ulrich's Periodicals Directory, JournalTOCS, PKP Open Archives Harvester, Bielefeld Academic Search Engine, Elektronische Zeitschriftenbibliothek EZB, Open J-Gate, OCLC WorldCat, Universe Digtial Library , NewJour, Google Scholar