S&W Second Quarter Fiscal 2018 Financial Results
•
0 gostou•128 visualizações

S&W Seed Company financial results for the second quarter of fiscal year 2018 ended December 31, 2017.

Recomendados
Recomendados
Mais conteúdo relacionado
Mais procurados
Mais procurados (15)
Semelhante a S&W Second Quarter Fiscal 2018 Financial Results
Semelhante a S&W Second Quarter Fiscal 2018 Financial Results (20)
Último
Último (20)
S&W Second Quarter Fiscal 2018 Financial Results
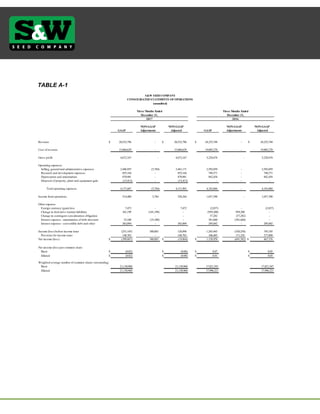
- 1. TABLE A-1 NON-GAAP NON-GAAP NON-GAAP NON-GAAP GAAP Adjustments Adjusted GAAP Adjustments Adjusted Revenue $ 20,532,796 - $ 20,532,796 $ 24,225,744 - $ 24,225,744 Cost of revenue 15,860,629 - 15,860,629 19,005,270 - 19,005,270 Gross profit 4,672,167 - 4,672,167 5,220,474 - 5,220,474 Operating expenses Selling, general and administrative expenses 2,446,955 (5,784) 2,441,171 2,592,059 - 2,592,059 Research and development expenses 855,164 - 855,164 748,571 - 748,571 Depreciation and amortization 870,981 - 870,981 842,454 - 842,454 Disposal of property, plant and equipment gain (15,413) - (15,413) - - - Total operating expenses 4,157,687 (5,784) 4,151,903 4,183,084 - 4,183,084 Income fromoperations 514,480 5,784 520,264 1,037,390 - 1,037,390 Other expense Foreign currency (gain) loss 7,472 - 7,472 (2,837) - (2,837) Change in derivative warrant liabilities 341,199 (341,199) - (959,200) 959,200 - Change in contingent consideration obligation - - - 57,282 (57,282) - Interest expense - amortization of debt discount 33,100 (33,100) - 381,660 (381,660) - Interest expense - convertible debt and other 383,894 - 383,894 295,042 - 295,042 Income (loss) before income taxes (251,185) 380,083 128,898 1,265,443 (520,258) 745,185 Provision for income taxes 148,702 - 148,702 106,485 171,324 277,809 Net income (loss) $ (399,887) 380,083 $ (19,804) $ 1,158,958 (691,582) $ 467,376 Net income (loss) per common share: Basic $ (0.02) $ (0.00) $ 0.07 $ 0.03 Diluted $ (0.02) $ (0.00) $ 0.01 $ 0.03 Weighted average number of common shares outstanding: Basic 21,130,960 21,130,960 17,821,547 17,821,547 Diluted 21,130,960 21,130,960 17,996,221 17,996,221 2017 2016 S&W SEED COMPANY CONSOLIDATED STATEMENTS OF OPERATIONS (unaudited) Three Months Ended Three Months Ended December 31, December 31,
- 2. TABLE A-2 NON-GAAP NON-GAAP NON-GAAP NON-GAAP GAAP Adjustments Adjusted GAAP Adjustments Adjusted Revenue $ 31,244,512 - $ 31,244,512 $ 36,475,317 - $ 36,475,317 Cost of revenue 24,236,757 - 24,236,757 29,311,580 - 29,311,580 Gross profit 7,007,755 - 7,007,755 7,163,737 - 7,163,737 Operating expenses Selling, general and administrative expenses 5,361,035 (34,947) 5,326,088 5,047,263 - 5,047,263 Research and development expenses 1,597,081 - 1,597,081 1,490,113 - 1,490,113 Depreciation and amortization 1,759,233 - 1,759,233 1,677,151 - 1,677,151 Disposal of property, plant and equipment gain (81,776) - (81,776) - - - Total operating expenses 8,635,573 (34,947) 8,600,626 8,214,527 - 8,214,527 Income (loss) fromfromoperations (1,627,818) 34,947 (1,592,871) (1,050,790) - (1,050,790) Other expense Foreign currency (gain) loss 22,030 - 22,030 (6,483) - (6,483) Change in derivative warrant liabilities (431,300) 431,300 - 168,500 (168,500) - Change in contingent consideration obligation - - - 164,363 (164,363) - Loss on equity method investment - - - 49,249 (49,249) - Interest expense - amortization of debt discount 67,099 (67,099) - 981,118 (981,118) - Interest expense - convertible debt and other 731,623 - 731,623 647,584 - 647,584 Income (loss) before income taxes (2,017,270) (329,254) (2,346,524) (3,055,121) 1,363,230 (1,691,891) Provision (benefit) for income taxes 200,123 - 200,123 (996,923) 415,420 (581,503) Net income (loss) $ (2,217,393) (329,254) $ (2,546,647) $ (2,058,198) 947,810 $ (1,110,388) Net loss per common share: Basic $ (0.11) $ (0.12) $ (0.12) $ (0.06) Diluted $ (0.11) $ (0.12) $ (0.12) $ (0.06) Weighted average number of common shares outstanding: Basic 20,643,973 20,643,973 17,467,370 17,467,370 Diluted 20,643,973 20,643,973 17,467,370 17,467,370 2017 2016 S&W SEED COMPANY CONSOLIDATED STATEMENTS OF OPERATIONS (unaudited) Six Months Ended, Six Months Ended, December 31, December 31,
- 3. TABLE B 2017 2016 2017 2016 Net income (loss) $ (399,887) $ 1,158,958 $ (2,217,393) $ (2,058,198) Non-recurring transaction costs 5,784 - 34,947 - Non-cash stock based compensation 193,572 296,235 451,033 578,659 Depreciation and amortization 870,981 842,454 1,759,233 1,677,151 Foreign currency (gain) loss 7,472 (2,837) 22,030 (6,483) Change in derivative warrant liabilities 341,199 (959,200) (431,300) 168,500 Change in contingent consideration liabilities - 57,282 - 164,363 Loss on equity method investment - - - 49,249 Interest expense - amortization of debt discount 33,100 381,660 67,099 981,118 Interest expense - convertible debt and other 383,894 295,042 731,623 647,584 Provision (benefit) for income taxes 148,702 106,485 200,123 (996,923) Non-GAAP Adjusted EBITDA $ 1,584,817 $ 2,176,079 $ 617,395 $ 1,205,020 December 31, December 31, S&W SEED COMPANY ITEMIZED RECONCILIATION BETWEEN NET INCOME(LOSS) AND NON-GAAP ADJUSTED EBITDA (unaudited) Three Months Ended Six Months Ended
- 4. December 31, June 30, 2017 2017 ASSETS CURRENT ASSETS Cash and cash equivalents $ 5,454,694 $ 745,001 Accounts receivable, net 25,250,475 23,239,325 Inventories, net 70,486,985 31,489,945 Prepaid expenses and other current assets 1,500,066 1,249,921 TOTAL CURRENT ASSETS 102,692,220 56,724,192 Property, plant and equipment, net 13,630,123 13,581,576 Intangibles, net 33,810,687 34,939,079 Goodwill 10,292,265 10,292,265 Other assets 1,568,286 1,563,176 TOTAL ASSETS $ 161,993,581 $ 117,100,288 LIABILITIES AND STOCKHOLDERS' EQUITY CURRENT LIABILITIES Accounts payable $ 32,831,640 $ 7,157,745 Accounts payable - related parties 117,164 331,694 Deferred revenue 55,442 880,326 Accrued expenses and other current liabilities 2,671,495 2,733,718 Lines of credit, net 27,592,603 27,399,784 Current portion of contingent consideration obligation - 2,500,000 Current portion of long-term debt, net 358,864 10,309,664 TOTAL CURRENT LIABILITIES 63,627,208 51,312,931 Long-term debt, net, less current portion 13,203,191 1,096,155 Derivative warrant liabilities - 2,836,600 Other non-current liabilities 781,629 632,947 TOTAL LIABILITIES 77,612,028 55,878,633 STOCKHOLDERS' EQUITY Preferred stock, $0.001 par value; 5,000,000 shares authorized; no shares issued and outstanding - - Common stock, $0.001 par value; 50,000,000 shares authorized; 24,353,300 issued and 24,328,300 outstanding at December 31, 2017; 18,004,681 issued and 17,979,681 outstanding at June 30, 2017; 24,353 18,004 Treasury stock, at cost, 25,000 shares (134,196) (134,196) Additional paid-in capital 108,568,030 83,312,518 Accumulated deficit (18,653,679) (16,436,286) Accumulated other comprehensive loss (5,422,955) (5,538,385) TOTAL STOCKHOLDERS' EQUITY 84,381,553 61,221,655 TOTAL LIABILITIES AND STOCKHOLDERS' EQUITY $ 161,993,581 $ 117,100,288 S&W SEED COMPANY CONSOLIDATED BALANCE SHEETS (UNAUDITED)
- 5. 2017 2016 CASH FLOWS FROM OPERATING ACTIVITIES Net loss $ (2,217,393) $ (2,058,198) Adjustments to reconcile net loss from operating activities to net cash used in operating activities Stock-based compensation 451,033 578,659 Bad debt expense 20,547 - Depreciation and amortization 1,759,233 1,677,151 Gain on disposal of property, plant and equipment (81,776) - Change in deferred tax asset - (1,034,439) Change in foreign exchange contracts 100,864 234,286 Change in derivative warrant liabilities (431,300) 168,500 Change in contingent consideration obligation - 164,363 Amortization of debt discount 67,099 981,118 Loss on equity method investment - 49,249 Changes in: Accounts receivable (1,960,907) 1,820,501 Inventories (38,850,545) (20,836,483) Prepaid expenses and other current assets (377,920) 72,841 Other non-current asset (4,963) - Accounts payable 25,606,471 10,098,122 Accounts payable - related parties (216,112) 3,462,649 Deferred revenue (614,523) (151,463) Accrued expenses and other current liabilities (67,000) (1,150,794) Other non-current liabilities 148,147 (61,677) Net cash used in operating activities (16,669,045) (5,985,615) CASH FLOWS FROM INVESTING ACTIVITIES Additions to property, plant and equipment (815,063) (1,264,395) Proceeds from disposal of property, plant and equipment 46,218 - Additions to internal use software - (118,389) Net cash used in investing activities (768,845) (1,382,784) CASH FLOWS FROM FINANCING ACTIVITIES Net proceeds from sale of common stock 22,519,216 - Net proceeds from exercise of common stock options - 602,083 Taxes paid related to net share settlements of stock-based compensation awards (113,688) (75,083) Borrowings and repayments on lines of credit, net 38,574 5,646,664 Repayment of contingent consideration obligation (2,500,000) - Borrowings of long-term debt 12,500,000 88,150 Debt issuance costs (257,964) - Repayments of long-term debt (10,113,415) (169,598) Repayments of convertible debt - (3,427,837) Net cash provided by financing activities 22,072,723 2,664,379 EFFECT OF EXCHANGE RATE CHANGES ON CASH 74,860 (92,185) NET INCREASE (DECREASE) IN CASH & CASH EQUIVALENTS 4,709,693 (4,796,205) CASH AND CASH EQUIVALENTS, beginning of the period 745,001 6,904,500 CASH AND CASH EQUIVALENTS, end of period $ 5,454,694 $ 2,108,295 Six Months Ended December 31, S&W SEED COMPANY CONSOLIDATED STATEMENTS OF CASH FLOWS (UNAUDITED)