
Recomendados
Recomendados
Mais conteúdo relacionado
Mais procurados
Mais procurados (15)
Semelhante a Dashboards That Set Your App Apart: Build Actionable Dashboards to Drive Your Business
Semelhante a Dashboards That Set Your App Apart: Build Actionable Dashboards to Drive Your Business (20)
Mais de Aggregage
Mais de Aggregage (20)
Último
Último (20)
Dashboards That Set Your App Apart: Build Actionable Dashboards to Drive Your Business
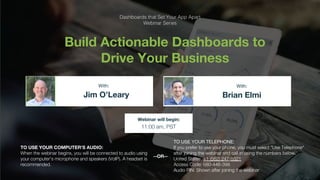
- 1. Logi Analytics Confidential & Proprietary Click to edit Master title style Build Actionable Dashboards to Drive Your Business Jim O’Leary Brian Elmi With: With: TO USE YOUR COMPUTER'S AUDIO: When the webinar begins, you will be connected to audio using your computer's microphone and speakers (VoIP). A headset is recommended. Webinar will begin: 11:00 am, PST TO USE YOUR TELEPHONE: If you prefer to use your phone, you must select "Use Telephone" after joining the webinar and call in using the numbers below. United States: +1 (562) 247-8321 Access Code: 680-446-398 Audio PIN: Shown after joining the webinar --OR--
- 2. Logi Analytics Confidential & Proprietary Click to edit Master title style Logi Analytics helps application teams create, deploy, and constantly improve analytic applications that engage users and drive revenue. In 2000, Arman Eshraghi founded Logi Analytics, formerly LogiXML, to help web developers easily embed compelling data visualizations inside websites. This core technology evolved into the Logi platform, providing an extraordinarily fast and easy way to embed analytics into any application. Today, over 1,800 application teams use Logi to create more valuable applications, engage users, and differentiate their software products.
- 3. Logi Analytics Confidential & Proprietary Click to edit Master title style 3 Click on the Questions panel to interact with the presenters https://www.productmanagementtoday.com/webinar-series/dashboards-that-set-your-app-apart/
- 4. Logi Analytics Confidential & Proprietary Click to edit Master title style About Jim O’Leary As Vice President of Product Management at NTENT, Jim oversees all product management functions in the company. Prior to joining NTENT, Jim worked in a variety of Product Management and Marketing leadership roles at companies such as Oracle, Siebel Systems, Corillian, and Mitchell. Jim received his BS in Chemical Engineering from the University of Notre Dame, his MS in Civil & Environmental Engineering from UC Berkeley and his MBA from Harvard. About Brian Elmi As the Director of Product Management at NTENT, Brian has product management responsibility for NTENT’s mobile application portfolio. Prior to NTENT, Brian held a variety of Product Management roles at Mitchell and was co-founder of Videonary, a video advertising platform for SMBs. Brian received his BS from University of California, San Diego and his MBA from UCLA Anderson School of Management.
- 5. Logi Analytics Confidential & Proprietary Click to edit Master title stylePOLL - How often does your organization review product level KPIs? - Never… - Adhoc - Whenever we are asked to present the data - Quarterly - Monthly - Daily
- 6. Logi Analytics Confidential & Proprietary Click to edit Master title styleIT’S ALL ABOUT THE BUSINESS!! As PMs we are the stewards of the business and products that drive the business forward If we don’t know what drives our business, we can’t build products that help achieve our business goals
- 7. Logi Analytics Confidential & Proprietary Click to edit Master title styleProblem Statement Many organizations build feature/products without knowing how those features/products directly affects the overall business. The link between product and business either doesn’t exist or is not properly measured
- 8. Logi Analytics Confidential & Proprietary Click to edit Master title styleHigh-level process for building GREAT products Market Trends Business Vision & Goals Customer Pain-Points Validate Hypotheses/Ideas Prioritize Build and Measure
- 9. Logi Analytics Confidential & Proprietary Click to edit Master title styleThis webinar will cover: ● How to cut out the noise and determine which KPIs matter for your business ● How to define success metrics for new initiatives (product, marketing, etc) that align with your business needs ● How to democratize data so that all teams in an organization can benefit from it ● How to instrument your products to measure direct effect on business outcomes
- 10. Logi Analytics Confidential & Proprietary Click to edit Master title styleSteps to create and measure a link between business & product 1. Identify the formula and the variables that drive your business 2. Identify the product level KPIs that define those variables 3. Get alignment across the organization on the variables and their importance 4. Review the data you have and instrument your product as necessary 5. Build your dashboard 6. Make the dashboard part of your organization’s bloodstream 7. Experiment, build and measure!
- 11. Logi Analytics Confidential & Proprietary Click to edit Master title style Step 1: Identify the formula and variables that drives your business Let’s walk through a hypothetical example of a online e-commerce business Expense → Fixed (Employee, real-estate, tools, utilities) + Variable (support, commissions, licensing, cloud - AWS) Profit = Revenue - Expense Revenue → Users * # of Transaction per user * $ per transaction = Revenue
- 12. Logi Analytics Confidential & Proprietary Click to edit Master title styleNext: Breakdown the formula to its core variables Revenue → Users * # of transactions per user * $ per transaction New User + Retained Users # of prospects who visit * sign up conversion rate ∑ (Target prospect reach per channel * ad conversion rate per channel) User from previous <time period> * retention rate
- 13. Logi Analytics Confidential & Proprietary Click to edit Master title styleThen: Figure out which variables your product help drive # of prospects who visit * sign up conversion rate From the prior slide # of prospects who sign up / # of prospects visit ● Time to create new account ● Onboarding ● New account creation workflow ● % who provide payment information ● % who make their first purchase
- 14. Logi Analytics Confidential & Proprietary Click to edit Master title styleReal-Life Version
- 15. Logi Analytics Confidential & Proprietary Click to edit Master title stylePOLL - When you identify your product level KPIs, what do you do with that information? - Don’t know what they are - Review when you are in the mood - Create a report and share with relevant people - Regularly review with stakeholders and team - Identify hypotheses based on KPIs and validate with experiments
- 16. Logi Analytics Confidential & Proprietary Click to edit Master title styleStep 2: Identify the product level KPIs that can be measured As we saw in the prior slides, the following are the product KPIs we want measure and improve to increase our sign-up conversion rate: ● Time to create new account ● Onboarding ● New account creation workflow ● % who provide payment information ● % who make their first purchase
- 17. Logi Analytics Confidential & Proprietary Click to edit Master title styleStep 3: Alignment on variables across the org Getting alignment on the variables that you’ll be measuring is critical. Steps to get buy-in: ● Walk the cross functional leaders through your formula ● Get alignment on the definition of each variable ● Agree on the measuring criteria for each variable ● Define the focus area for the organization and success metrics
- 18. Logi Analytics Confidential & Proprietary Click to edit Master title styleStep 4: Review your data and instrument as necessary ● Thoroughly review the data that is being collected by your products ● Make sure you have a single repository of data or know where each data element lives and how different data sets relate to one another ● Review your product’s instrumentation and if you haven’t already, create an inventory all of the events and their attributes
- 19. Logi Analytics Confidential & Proprietary Click to edit Master title styleStep 5: Build your dashboard - Your dashboard should be a mirror of the formula defined above - Each section of your dashboard can represent a particular variable defined in your business formula
- 20. Logi Analytics Confidential & Proprietary Click to edit Master title styleStep 6: Integrate your dashboard into organization’s bloodstream - Everyone should have access to the same data and operate based on the same definition of KPIs - Visualization tool that everyone can use - Clear definition of KPIs across the org - Reference to this dashboard in key meeting - Product, Ops, finance
- 21. Logi Analytics Confidential & Proprietary Click to edit Master title styleSummary - Experiment, build and measure! Market Trends Business Vision & Goals Customer Pain-Points Validate Hypotheses/Ideas Prioritize Build and Measure
- 22. Logi Analytics Confidential & Proprietary Click to edit Master title style 22 Q&A Brian Elmi With: With: VP Product Management, NTENT Linkedin page: /in/oleary Twitter ID: @jimoleary Jim O’Leary Director of Product Management, NTENT Linkedin page: /in/brianelmi Twitter ID: @brianelmi https://www.productmanagementtoday.com/webinar-series/dashboards-that-set-your-app-apart/