Six sigma

Six Sigma is a data-driven approach to improving processes by identifying and removing defects. It aims for near perfect process quality. The goal is to improve end products or services by reducing errors. Six Sigma refers to producing only 3.4 defective parts per million. Motorola first introduced Six Sigma in the 1970s to address quality issues. It connects quality improvement to cost reduction. The concepts were officially formulated in 1986 and have grown in popularity since. Six Sigma uses two methods: DMAIC for improving existing processes and DMADV for designing new defect-free processes. It is applied across entire organizations rather than just specific teams. The document then provides a case study example of a company using the DMAIC

Recomendados
Mais conteúdo relacionado
Mais procurados
Mais procurados (20)
Destaque
Destaque (18)
Semelhante a Six sigma
Semelhante a Six sigma (20)
Último
Último (20)
Six sigma
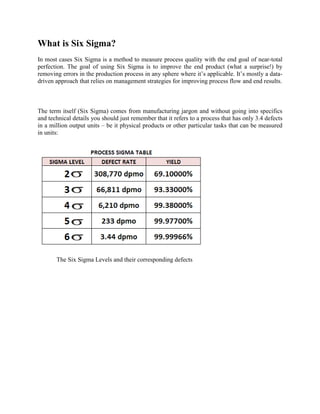
- 1. What is Six Sigma? In most cases Six Sigma is a method to measure process quality with the end goal of near-total perfection. The goal of using Six Sigma is to improve the end product (what a surprise!) by removing errors in the production process in any sphere where it’s applicable. It’s mostly a data- driven approach that relies on management strategies for improving process flow and end results. The term itself (Six Sigma) comes from manufacturing jargon and without going into specifics and technical details you should just remember that it refers to a process that has only 3.4 defects in a million output units – be it physical products or other particular tasks that can be measured in units: The Six Sigma Levels and their corresponding defects
- 2. A brief history of six sigma The concept was first introduced in Motorola somewhere in the 70’s of last century. It was after a serious critique of the bad quality that senior executive Art Sundry was forced to do something about it. That’s how the six sigma concept started it’s slow introduction. A connection between quality improvement and cost reduction was found and things went off from there. Later in 1986 the concept was officially formulated and it’s been getting more popular ever since. Now, an important argument that many Six Sigma believers sometimes omit is that the concept isn’t something revolutionary new. It didn’t just come out of nowhere – similar concepts did exist prior to the formulation of six sigma and they all do share common ground. For example making the process less variable would result in more stable end results. Analysis is also an important and common element to all quality control and improvement movements. And in the end of the day it should be used all across the organization not just by discrete elements of it. Six sigma methods There are two methods used: DMAIC (duh-may-ick) – Defining the problem, Measuring important aspects, Analyzing the information flow, Improving and Controlling. DMADV (duh-mad-vee) – Defining goals, Measuring Critical to Quality CTQs characteristics, Analyzing, Designing details, Verifying. As said above one of the important characteristics of Six Sigma is that it’s used all across the organization. Unlike most of the previous systems for quality management and control that were used only on the top management level and by statisticians Six Sigma is used at all levels of the organization that it’ll be implement in. There is still hierarchy of the methodology and who does what. Three main differences Six Sigma has from other process improvement methodologies: 1 – It uses two disciplined approaches: • DMAIC – used to develop/improve existing practice • DMADV – used to devise/design a defect-free procedure 2 – Uses varied numerical and problem solving techniques and tools 3 – Is being run by a trained and certified professional (Black Belt) and guided by a Master Black Belt
- 3. Below is a list along with a short overview of the most common tools used in Six Sigma: • 5 Whys – This method is best used to identify the root cause of the problem. When presented with a defect, formulated questions that will dig deep into the causes of the problem. This is one tool that is applicable to all business settings and even to the ordinary processes in day to day living. • Accelerated Life testing – This process is more relevant to the industrial setting. This calls for the product to be subjected to the expected and forecasted rigors that it might have to undergo when put to use. Extreme measures and variables are applied in the attempt to uncover any faults and weak points that may cause possible malfunctions. • ANOVA – This stands for Analysis of Variance. This tool will utilize a set of statistical data. This is often used to gauge the validity of statistic returns of one statistical model applied against another. ANOVA subscribe to the assumption of independence, normality and equality of the responses. With ANOVA R&R, all factors affecting the measurement system are taken into consideration. • Axiomatic Design – This process is designed to turn established or anticipated needs into products that will address such. This tool uses matrix methods to facilitate step-by-step transition of needs to products and at the same time effectively extracting variables and design limitations as well. • Business Process Mapping – This is the tool to simplify complex business processes by creating a process flow chart. This is a graphical representation of process flow of responsibility ownership, relationship of individual tasks and organizational alignment. This resembles the organizational chart but with the tasks, roles and process ownership clearly defined. This very effective in streamlining an otherwise dysfunctional and overstaffed organizations. • Ishikawa Diagram – This process management tool is also known as the cause and effect diagram. This works best during brainstorming sessions. The process will entail the listings of all possible and probable causes that contribute to a defect in the fishbone diagram, thus its second name, fishbone analysis or diagram. The idea of the process is to get the most common problem. • Cost Benefit Analysis – This method is most applicable if you are comparing two or more courses of action. Monetary valuation is fixed on each attribute and all values, positive for benefits and negative for cost, will be tallied. This calls for a factual assignation of the values taking also into consideration the time value of money. The alternative with the highest monetary value is deemed the most cost effective course of action. • CTQ Tree – The Critical-to-Quality tree is used to measure the degree of satisfaction a product or a service is able to effective deliver to its end user or customer. The level of satisfaction is derived from the customers’ point of view. Through the use of CTQ, product or service modifications are more effectively aligned to the customer needs. • FMEA – Failure Modes and Effects Analysis is an effective procedure to forecast and address potential faults and failures of any given process. This tool requires the entire process to be broken down into specific tasks. All possible faults and failures are then listed and will be given severity, occurrence and detection rates. Items that came up highest in the ratings are the most significant faults, thus resources should be focused in addressing that first.
- 4. • Histogram – This is another graphical representation that shows data distribution of frequency and density. This is useable in bucketing derived data into bins with specified category and intervals. The interpretation of the graph will be based on the shape or height of the graph as well as the direction of where it is skewed. • Pareto Analysis – This is another significant Six Sigma tool used in maximizing resources. The Pareto is based on historical data of events and defects. This process subscribes to the idea of addressing the vital few over the trivial many. A list is of all defects observed for a given period of time is listed and their overall contribution is determined. Defects amongst the 80% contribution cutoff, either by count or by weight are considered vital. The analysis is more represented visually by the Pareto chart. • Scatter Plot – This is also called the scatter graph. This tool uses the Cartesian coordinates to plot values of two given variables from a set of data. Depending on the nearness or closeness of the dots on the chart, we can derive educated conclusions on its correlation, the absence or correlation, the strength of correlation and whether the variables are positively or negatively correlated. This is a tool to use in order to determine the effect of one independent variable to one dependent one. • Regression Method – This tool is very similar to the scatter plot in the sense that both aim to correlate one variable to another. The main difference is that while scatter plot can only correlate two variables, the regression will be able to identify relationship of one dependent variable to several independent variables. • SIPOC – SIPOC is the acronym for supplier, or the source of input, input, or the materials needed for the process, process, output, what is produced by the process and customers, the end users of the output. By graphically plotting of all variables that affects the aspects of the whole process, managers are more able to see the bird’s eye view of the process, thus affording a more comprehensive and effective decision making. Aside from the listed above, Six Sigma also have the following management tools: • Check Sheet • Chi-squared Test • Control Chart • Correlation • Design of Experiments • General Linear Model • Pick Chart • Process Capability • (QFD) Quality Function Deployment • Quantitative Marketing Research through Enterprise Feedback Management • Root Cause Analysis • Run Charts • Stratification • Taguchi Loss Function • Ishikawa Diagram • Pareto
- 5. Six Sigma DMAIC Six Sigma DMAIC at Work – A Case Study DMAIC (duh-may-ick) is an abbreviation for a method used in Six Sigma. It stands for the 5 distinct phases it goes through: Define (the problem), Measure (aspects of the problem), Analyze (the information flow), Improve and Control (the process). Let’s use a case study example and analyze each phase… A US-based employer which sells computers and other software and peripherals contracted two outsource companies: Alpha Company and Beta Company to do the selling. For almost two years these two outsourced companies have been in a tight competition when in comes to several metrics. The first four quarters it has always been the Alpha Company who out performed Beta Company. Beta Company though have been out performed made some adjustments and proved indeed that they can surpass the performance of Alpha Company. Alpha Company has always owned the Close Rate metric, which means they sell more boxes than the Beta Company. Beta Company on the other hand, owned the MPC (Margin per call) metric. This means that every unit sold is of higher revenue and margin. This gives the employer better profit. On a business standpoint, selling less units but of higher revenue and margin is better than selling more units of low revenue and sometimes no margin at all. In one of the quarterly business reviews, the employer expressed its intention to just maintain one outsourced contract by the end of the fiscal year. With this position, the Director of Alpha Company instructed its Operation and BPI Heads to device a plan that will improve the company’s MPC. A general meeting was scheduled; trained and skilled people were called upon for a specific project. The goal of the project is to improve revenue and margin related metrics while at the same time maintain close rate performance. The performance of the company is measured in several ways. Since the program has a sales orientation, the king of all metrics is Close Rate. This computed by dividing the total number of sales over the total number of received calls. Target for this metric is 35.00%. Some other metrics that are also important on a sales program are: • TMU (Total Margin per Unit) computed by dividing the total margin of units sold over total number of sold units. Target for this is $126.00 • TRU (Total Revenue per Unit) computed by dividing the total revenue of units sold over total number of sold units. Target for this is $997.00 • MPC (Margin per Call) computed by dividing the total number of margin per call over total number of received calls. Target for this is $21.00 • SRU (Service Revenue per Unit) computed by dividing the total number of service revenue sold over total number of sold units. Target for this is $107.00 • SPRU (Software and Peripherals Revenue per Unit) computed by dividing the total number of software and peripherals revenue sold over total number of sold units. Target for this is $65.00
- 6. People who are tasked to do the project have been identified. Their roles and responsibilities were clearly and completely stated. Using the DMAIC model of Six Sigma a assignment called MPC Project was created. Some details of the project are narrated below. DEFINE PHASE Problem statement: From FW27-FW35, Alpha Company is trending lower than Beta Company on MPC. Problem Scope: • To identify drivers of low MPC performance • To reduce the MPC performance gap/delta between Alpha Company and Beta company
- 7. MEASURE PHASE • MPC trending shows that Beta Company performs better than Alpha company from FW27 – FW35 (10 consecutive weeks) • Average delta of Beta Company over Alpha Company is $9.33 ANALYZE PHASE Major root causes for MPC non-performance: • Low TMU scores o Agents are not shifting-the-mix for every sales call (priority is to close more boxes than adding value to the boxes sold) o Low SRU and SPRU scores due to failure to position or offer services • Proactive discounting. o Inconsistencies on Close Rate performance o Agents have difficulties/challenges in overcoming customer’s objections when positioning a solution package, service, or any up-sell item o Absence of a structured callback process • High variation on MPC performance between top performers, mid, and bottom performers o Performance is not being tracked real-time o Bottom performers receive the most number of calls o Challenges on conducting trainings due to heavy call volume
- 8. IMPROVE PHASE MPC Action Registry • Real-time performance management (FW37) o Change priority skilling based on weekly/daily performance of agents; top performers to get the calls first o Owned by the Operations team • Increasing SRU (FW37) o Intensified road shows Owned by Sales Coaches and Operations team Road shows and presentation done at the team level Focus is to drive awareness of agents regarding the current state: running statistics / enterprise competition; providing solutions to properly shift- the-mix / close the sale • Increasing SPRU (FW38) o Creation of effective positioning Owned by Sales Coaches and Training Team Provide effective positioning scripts with ready rebuttal spiels o Close loop monitoring process on Policies, Procedures, and Customer Handling Owned by the Quality Team Focus is to audit Customer Handling behaviors and to establish a CMPD (Consequence Management Process Development) on Customer Handling non-compliance • Improve sales skills (FW39) o Effective sales management and leadership workshop for Team Leaders and Coaches Owned by the Training Team Team Leaders and Sales Coaches underwent training on negotiation skills and objection handling o Monthly Full Cycle Performance Management (FCPM) Owned by Operations Team Changed quarterly FCPM to monthly review Focus is on Bottom Quartile and Mid-rank agents. On the later part top performers were included and FCPM became progressive (monthly review fro top; bi-weekly for mid; weekly review for bottom performers) • Outlier Management (FW39) o Outlier Management on several metrics such as CR , TMU, and MPC Owned by Sales Coaches Focus is on mid-rank agents • System Mix Reporting and Up-sell Mix Reporting o Bi-weekly reporting which started FW40 o Reports contain enterprise and team trending on system mix and up-sells which provided deep dive analysis on gaps on financial metrics impacting MPC, TMU, SRU, and SPRU
- 9. o Provided recommendations to address the gaps and served as basis for contests/hypes • BPI (Business Process Implementations) audits on Black Friday and Cyber Monday deals o Focus on behaviors affecting financials o Provided recommendations to address opportunities • Other recommendations adapted by Operations o Scorecard improvement (computed for realistic goals) o Screensaver on agents PCs – reflects goals, updates, and recognizes top performers o Assigning stretch goals to financial metrics o CMPD on Customer Handling CONTROL PHASE • Control Point: Applying Consequence Management to Team Leaders to reinforce audit and coaching compliance every week • Alpha Company was able to surpass Beta Company’s MPC performance from FW37 and FW45 • FW37 was the start of the real-time Performance Management; Road shows; FCPM • FW39 was the start of Leadership Workshop on Effective Sales Management training, System Mix and Up-Sell Mix Reporting, and Outlier Management • FW41 Contest on MPC was launched Since Margin per Call was the base metric of measuring margins and revenue per unit, significant increase was also observed on TMU, TRU, SRU and SPRU. Full Cycle Performance Management is still observed, priority is on bottom performers. Mentoring sessions are also conducted by top performers to their buddy bottom performer. Additional incentives are given to top performers. Agents are now confident in doing the system-mix and the up-sell mix.