2. ii
AUTHOR'S DECLARATION
I hereby declare that I am the sole author of this thesis. This is a true copy of the thesis, including any
required final revisions, as accepted by my examiners.
I understand that my thesis may be made electronically available to the public.
3. iii
Abstract
Optimization problems in two different application fields are investigated: the first one is the popular
portfolio optimization problem and the second one is the newly developed online display advertising
problem.
The portfolio optimization problem has two main concerns: an appropriate statistical input data,
which is improved with the use of factor model and, the inclusion of the transaction cost function into
the original objective function. Two methods are applied to solve the optimization problem, namely,
the conditional value at risk (CVaR) method and the reliability based (RB) method.
Asset allocation problem in finance continues to be of practical interest because decisions as to
where to invest must be made to maximize the total return and minimizing the risk of not attaining the
target return. However, the commonly used Markowitz method, also known as the mean-variance
approach, uses historic stock prices data and has been facing problems of parameter estimation and
short sample errors. An alternative method that attempts to overcome this problem is the use of factor
models. This thesis will explain this model in addition to explaining the basic portfolio optimization
problem.
Conditional value at risk and the reliability based optimization method are applied to solve the
portfolio optimization problem with the consideration of transaction costs in the objective function.
They are applied and evaluated by simulation in terms of their convergence, efficiency and results.
The online display advertising problem extends a normal deterministic revenue optimization model
to a stochastic allocation model. The incorporation of randomness makes it more realistic for the
estimation of demand, supply and market price. Revenues are considered as a combination of gains
from guaranteed contracts and unguaranteed spot market. The objective is not only to maximize the
revenue but also to consider the quality of ads, so that the whole market obtains long-term benefits
and stability. The thesis accomplishes in solving the online display advertising allocation problem in a
stochastic case with the measure of conditional value at risk algorithm.
4. iv
Acknowledgements
I would like to give my sincere thanks to my supervisor Kumaraswamy Ponnambalam for his
guidance and help on improving my thesis work. He has been patiently helping me with background
study, optimization fundamentals, programming, writing and so on. I’ve learned from him the attitude
for research and study: curiosity, diligence and critical thinking based on a solid knowledge of the
research area.
I would also like to express my gratitude to my colleagues in the lab. They are always helpful in
discussions and creative ideas.
5. v
Dedication
I would like to dedicate my thesis to my family and friends, who have been helping all the way
through my master studies.
6. vi
Table of Contents
AUTHOR'S DECLARATION................................................................................................................ii
Abstract ................................................................................................................................................. iii
Acknowledgements................................................................................................................................iv
Dedication ...............................................................................................................................................v
Table of Contents...................................................................................................................................vi
List of Figures ........................................................................................................................................ix
List of Tables ..........................................................................................................................................x
Chapter 1 Introduction ............................................................................................................................1
Introduction to Optimization.........................................................................................................1
1.1
Optimization Steps........................................................................................................................1
1.2
Problem Statement ........................................................................................................................2
1.3
Contribution ..................................................................................................................................3
1.4
Content organization.....................................................................................................................3
1.5
Chapter 2 Case Study 1:
Portfolio optimization with transaction costs..................................................5
Introduction...................................................................................................................................5
2.1
Statement of Problem....................................................................................................................5
2.2
Defining Transaction Costs...........................................................................................................6
2.3
Two-Part.................................................................................................................................6
2.3.1
Two-Block .............................................................................................................................6
2.3.2
All Units Quantity Discount ..................................................................................................6
2.3.3
With Caps and Floors.............................................................................................................6
2.3.4
Literature Review..........................................................................................................................7
2.4
Basic Theory of Techniques applied.............................................................................................8
2.5
VaR (Value at Risk)...............................................................................................................8
2.5.1
CVaR (Conditional Value at Risk) ........................................................................................8
2.5.2
Reliability based optimization method (RBO).......................................................................9
2.5.3
Factor Model........................................................................................................................10
2.5.4
Application Problem ...................................................................................................................13
2.6
CVaR....................................................................................................................................13
2.6.1
Reliability based optimization method ................................................................................14
2.6.2
The Factor Model.................................................................................................................15
2.6.3
7. vii
Example Application........................................................................................................... 17
2.6.4
Data Analysis.............................................................................................................................. 18
2.7
Convergence Proof ..................................................................................................................... 20
2.8
Case1: CVaR ....................................................................................................................... 21
2.8.1
Case2: RBO......................................................................................................................... 25
2.8.2
Result Analysis........................................................................................................................... 30
2.9
Case1: CVaR ....................................................................................................................... 30
2.9.1
Case2: RBO......................................................................................................................... 32
2.9.2
Computational Efficiency......................................................................................................... 35
2.10
Case1: CVaR ..................................................................................................................... 35
2.10.1
Case2: RBO....................................................................................................................... 35
2.10.2
Conclusion................................................................................................................................ 36
2.11
Chapter 3 Case study 2: Online Display Advertising Allocation Problem .......................................... 37
Introduction ................................................................................................................................ 37
3.1
Types of Advertising .................................................................................................................. 37
3.2
Goals of Publishers and Advertisers........................................................................................... 38
3.3
The Revenue Model ................................................................................................................... 39
3.4
CPM..................................................................................................................................... 39
3.4.1
CPC...................................................................................................................................... 39
3.4.2
CPA ..................................................................................................................................... 40
3.4.3
Statement of Problem ................................................................................................................. 40
3.5
Guaranteed contracts and unguaranteed contracts...................................................................... 42
3.6
Guaranteed Contracts .......................................................................................................... 42
3.6.1
Unguaranteed Contracts ...................................................................................................... 42
3.6.2
Uncertainty ................................................................................................................................. 42
3.7
Literature Review ....................................................................................................................... 42
3.8
Remodel for media selection problem........................................................................................ 43
3.9
Ad Rank............................................................................................................................... 45
3.9.1
The optimization problem ........................................................................................................ 46
3.10
Reasonable data........................................................................................................................ 46
3.11
Optimization Techniques.......................................................................................................... 48
3.12
Results Analysis ....................................................................................................................... 48
3.13
8. viii
Case1: Sensitivity to the number of sample used ..............................................................48
3.13.1
Case1: Sensitivity to competitor numbers .........................................................................50
3.13.2
Case3: Sensitivity to risk ratio ...........................................................................................53
3.13.3
Case4: Sensitivity to penalty value ....................................................................................56
3.13.4
Conclusion ................................................................................................................................58
3.14
Chapter 4 Conclusion and Future Work ...............................................................................................59
Summary of work........................................................................................................................59
4.1
Future approach...........................................................................................................................59
4.2
Appendix A Predictor Importance Figures ...........................................................................................61
Appendix B Coefficients table for 7 assets...........................................................................................65
Bibliography..........................................................................................................................................69
9. ix
List of Figures
Figure 1.1 Optimization Process (Diwekar, 2008)................................................................................. 2
Figure 2.1 Predictor importance for GE returns (exported from software: SPSS)............................... 16
Figure 2.2 Convergence demonstration of CVaR with differnet risk levels and samples ................... 24
Figure 2.3 Convergence demonstration of RBO with different risk levels and samples ..................... 30
Figure 3.1 Functional process of the trading system............................................................................ 41
Figure 3.2 Total Revenue vs. sample number ..................................................................................... 50
Figure 3.3 Total Revenue versus the number of publishers ................................................................. 53
Figure 3.4 Total Revenue versus risk ratio......................................................................................... 56
Figure 3.5 Total Revenue versus penalty value.................................................................................... 58
Figure A 1 Predictor importance figure for UNP................................................................................. 61
Figure A 2 predictor importance figure for AAPL............................................................................... 62
Figure A 3 Predictor importance figure for ARTC .............................................................................. 62
Figure A 4 Predictor importance figure for XOM................................................................................ 63
Figure A 5 Predictor importance figure for PNBC .............................................................................. 63
Figure A 6 Predictor importance figure for ING.................................................................................. 64
Figure A 7 Predictor importance figure for WFC ................................................................................ 64
10. x
List of Tables
Table 2.1 : Input data number comparison (Sharpe, 2012)...................................................................11
Table 2.2 Definition of variables in factor model.................................................................................12
Table 2.3 Definition of variables in matrix form factor model.............................................................13
Table 2.4 Coefficients of GE factor model (exported from software: SPSS)......................................17
Table 2.5 equity code list ......................................................................................................................18
Table 2.6 mean return (4124 samples)..................................................................................................19
Table 2.7 covariance matrix (4124 samples) ........................................................................................19
Table 2.8 correlation coefficient (4124 samples)..................................................................................20
Table 2.9 data samples=1000, CVaR....................................................................................................31
Table 2.10 data samples = 2000, CVaR................................................................................................31
Table 2.11 data samples = 3000, CVaR................................................................................................32
Table 2.12 data samples = 4124, CVaR................................................................................................32
Table 2.13 Data samples = 1000, RBO.................................................................................................33
Table 2.14 Data samples = 2000, RBO.................................................................................................33
Table 2.15 Data samples = 3000, RBO.................................................................................................34
Table 2.16 Data samples = 4124, RBO.................................................................................................34
Table 2.17 Efficiency: CVaR................................................................................................................35
Table 2.18 Efficiency: RBO..................................................................................................................36
Table 3.1 Online Advertising Revenue.................................................................................................37
Table 3.2 Definition of parameters .......................................................................................................44
Table 3.3 Allocation result-sample number N=10................................................................................48
Table 3.4 Allocation result- sample number N=20...............................................................................49
Table 3.5 Allocation result- sample number N=30...............................................................................49
Table 3.6 Allocation result- publisher number N=5 .............................................................................50
Table 3.7 Allocation result- publisher number N=10 ...........................................................................51
Table 3.8 Allocation result- publisher number N=20 ...........................................................................52
Table 3.9 Allocation result-risk ratio θ=0.8..........................................................................................54
Table 3.10 Allocation result-risk ratio θ=0.9........................................................................................54
Table 3.11 Allocation result-risk ratio θ=0.95......................................................................................55
Table 3.12 Allocation result-risk ratio θ=0.99......................................................................................55
Table 3.13 Allocation result-penalty value h=0.8.................................................................................56
11. xi
Table 3.14 Allocation result-penalty value h=1.2 ................................................................................ 57
Table 3.15 Allocation result-penalty value h=1.5 ................................................................................ 57
Table A 1 code denotation for equity used........................................................................................... 61
Table B 1 Coefficients of UNP factor model ....................................................................................... 65
Table B 2 Coefficients of AAP factor model ....................................................................................... 65
Table B 3 Coefficients of ARTC factor model .................................................................................... 66
Table B 4 Coefficients of XOM factor model...................................................................................... 66
Table B 5 Coefficients of PNBC factor model..................................................................................... 67
Table B 6 Coefficients of ING factor model........................................................................................ 67
Table B 7 Coefficients of WFC factor model ...................................................................................... 68
12.
13. 1
Chapter 1
Introduction
Introduction to Optimization
1.1
Optimization is all around in our life, from industry supply chain operation to business investment,
from applications in Engineering to Finance. We need optimization techniques to make a better life
either to maximize our investment or minimize the use of resources.
Many of the engineering methods are being applied to financial areas because they share some
similar characteristics such as the need for modeling and design optimization. When the input
variables and model are deterministic, the solution is certain. While if the system becomes more
complex involving multiple objectives or several constraints to meet at the same time, and most
importantly if it has uncertainty in it, it is difficult to get an optimal decision with only a deterministic
implementation of the problem.
Depending on the features of decision variables, uncertainties, and the objective of the optimization
problem, optimization models can be classified into linear programming, dynamic programming,
integer programming, stochastic programming and so on.
Optimization Steps
1.2
In short, optimization is a systematic decision making process. (Diwekar, 2008)
According to (Beightler, Phillips, & Wilde, 1979), the optimization process can be summarized in 3
steps:
1) Get to know the background of the system, including all information of inputs, and model the
system using mathematical notations.
2) Define a measure of system effectiveness to this model, that is, determine the objective
function and constraints
3) Apply an appropriate optimization algorithm to solve the problem
The whole process can be intuitively described as in Figure 1.1:
14. 2
Figure 1.1 Optimization Process (Diwekar, 2008)
Problem Statement
1.3
We have two different applications to deal within this thesis. The first one is in portfolio optimization
and the other one in advertising allocation.
There has been a lot of research done in portfolio optimization and theories have been developed to
speed up computation and ensure better accuracy. Portfolio optimization is a decision-making
problem in how we allocate our funding to different possible investment options so that we can get
the maximum return. Both Conditional-Value-at-risk (CVaR), an advanced measure of risk technique
and the reliability method (RBO) , where the chances of failure in the system is low, will be applied
for investment allocation and results will be compared between two techniques..
The application in advertising allocation targets a more specific field and needs more background
in advertising marketing. Ad space, ad relevance and prices have to be taken into consideration
instead of return rate directly. The model is basically developed for the service providers of
Input
Data
op*miza*
on
Solver
Op*mal
Design
(Output)
Decision
Variables
Model
Constraints
and
Variables
Modifica*on
15. 3
advertising exchange trading system. The service providers share a certain percentage of return from
the publishers, who obtain cash inflows from the advertising opportunities, and thus all three parties-
the publishers, the advertisers and the service provider who offers the trading system, gain from the
system, either from the aspect of promoting business or increasing income.
The objectives for the two cases are about the same: maximize return. While the factors that affect
return on investment are quite diversified. They share some similarities in terms of optimization but
vary in modeling.
Contribution
1.4
The main contribution of the thesis is:
• Formalization of investment allocation model with transaction costs
• Optimization application with CVaR and RBO methods
• Transferring inputs into a Factor model
• Modeling of online display advertising
• Optimization formulation for the advertising problem with CVaR
• Experimental evaluation of proposed techniques
Content organization
1.5
The thesis is composed of four chapters. The first chapter gives a general idea of what an
optimization problem is and how to deal with it.
Chapter 2 deals with the portfolio optimization problem. It starts with a background introduction
and a problem statement. Section 3 in that chapter introduces the definition of transaction costs used.
After that, in Section 5, the basis of Value-at-risk (VaR), CVaR, RBO and factor models are defined.
Section 6 explains how CVaR, RBO and factor model apply in the asset allocation problem. Then in
the next section, a specific example is given implementing and comparing both methods from the
aspects of data analysis, efficiency, result analysis and convergence proof. The final conclusion is
summarized in Section 2.11.
Chapter 3 presents the online display advertising problem. Description of types of advertising,
advertising goals, revenue models, guaranteed and unguaranteed contracts are included. Uncertainty
16. 4
in the problem is also defined. Then the model is set up based on case study 2 described in the
previous sections and CVaR is applied to solve this problem.
The last chapter is a summary and conclusion of all thesis work done so far as well as expected
future work.
17. 5
Chapter 2
Case Study 1:
Portfolio optimization with transaction costs
Introduction
2.1
Change is certain, future is uncertain. –Bertrand Russell (Diwekar, 2008)
This is especially true with the financial market. The volatility of the market makes it interesting as
well as challenging to researchers and investors. The future of any of those instruments in the market
cannot be perfectly predicted but instead should be considered random or uncertain. Stochastic
programming applications refer to this branch of optimization where there are uncertainties involved
in the data (inputs) or the model.
Because the asset allocation problem has its practical relevance in the financial industry, it has
aroused intense interest and focus for years and will continue to do so, in coming decades.
Researchers from both educational and financial institutions aim at setting up a model designed to
maximize the benefits of investments. The more efficient the forecast is, the better. Because of
randomness in return, many ways of approximation have been tried to consider uncertainty.
Statement of Problem
2.2
The problem of interest can be generalized as follows:
max
!,!
𝑡
𝑆𝑢𝑏𝑗𝑒𝑐𝑡 𝑡𝑜:
𝑃𝑟𝑜𝑏 𝑔 𝑥, 𝑐 ≥ 𝑡 𝑥, 𝑡 ≥ 1 − 𝛼 (1)
𝑒!
𝑥 = 1
𝑥 ≥ 0
in which x∈Rn
is the vector of decision variables, i.e., the percentage of asset allocations; c∈Rn
is
the vector of returns of the uncertain assets. The vector e is defined as:
𝑒 = 1,1, … 1 !
(2)
The objective function that is maximized is g(x,c) and t is the desired target of function g. The risk
level set by users is designed by 𝛼.
The goal is to maximize the target return under such probabilistic constraint.
18. 6
Defining Transaction Costs
2.3
The transaction cost (Burghardt, 2008) (Markowitz, 1952) involved in this thesis is the contracting
cost, which primarily means buying and selling expenses related to the purchase and sale of trading
instruments, excluding interest income. We assume that it is nonlinear with respect to x, the
percentage holdings of assets. We define the transaction cost function named h(x) next.
The transaction cost function h(x) will later be used as an addition to the loss function.
Two-Part
2.3.1
This type of transaction cost consists of two parts: a base constant rate as well as a floating fee
depending upon the amount traded.
ℎ 𝑥 =
𝑐 + 𝑝𝑥 𝑤ℎ𝑒𝑛 𝑥 ≻ 0
0 𝑤ℎ𝑒𝑛 𝑥 = 0
(3)
Two-Block
2.3.2
A threshold criterion is held for this 'two-block' type. The fee rate differs after the trading amount
exceeds a certain amount q, but remains the same for the part smaller than the threshold value.
ℎ 𝑥 =
𝑝!𝑥 𝑤ℎ𝑒𝑛 0 ≼ 𝑥 ≼ 𝑞
𝑝!𝑞 + 𝑝! 𝑥 − 𝑞 𝑤ℎ𝑒𝑛 𝑥 ≻ 𝑞
4
All Units Quantity Discount
2.3.3
The fee rate depends upon the volume executed and, thus, two different rates are used, depending on
whether it exceeds the threshold or not. This type of transaction cost function is especially introduced
and practiced in the example in section 2.6.
ℎ 𝑥 =
𝑝!𝑥 𝑤ℎ𝑒𝑛 0 ≤ 𝑥 < 𝑞
𝑝!𝑥 𝑤ℎ𝑒𝑛 𝑥 ≥ 𝑞
5
With Caps and Floors
2.3.4
The way of calculating transaction costs in this case is much more complex: several threshold criteria
are used and a maximum constant value is set for all trading activities.
19. 7
ℎ 𝑥 =
0 𝑤ℎ𝑒𝑛 𝑥 = 0
𝑝!𝑞! 𝑤ℎ𝑒𝑛 0 < 𝑥 ≤ 𝑞!
𝑝!𝑥 𝑤ℎ𝑒𝑛 𝑞! < 𝑥 ≤ 𝑞
𝑝!𝑞 + 𝑝! 𝑥 − 𝑞 𝑤ℎ𝑒𝑛 𝑞 < 𝑥 ≤ 𝑞!
𝑐𝑜𝑛𝑠𝑡𝑎𝑛𝑡 𝑤ℎ𝑒𝑛 𝑥 > 𝑞!
6
Literature Review
2.4
The theory of portfolio optimization has come a long way from the Mean-Variance theory of
Markowitz (Markowitz, 1952) who first introduced his mathematical model in 1951 It regards
expected return as a desirable thing and variance of return as an undesirable thing, or in other words,
risk. Despite its pioneering importance to modern portfolio theory, it suffers some limitations in
practice. In mean variance analysis, only the first two moments are considered in the portfolio model.
Furthermore, the expected return µ is hard to estimate. The measure of risk by variance places equal
weight on upside deviations and downside deviations (HKUST), but volatility that makes the prices
increase is good. This idea suggests that it may be more appropriate to minimize downside risk only
for a long position.
Evaluating investments using expected return and variance of return is a simplification because
returns do not simply follow a normal distribution; it has a distribution that is negatively skewed and
with greater kurtosis than a normal distribution.
Next, value-at-risk (VaR), a widely used performance measure came on stage and answers the
question: what is the maximum loss with a specified confidence level. Value at Risk (VaR) is a
widely used measure of the risk of loss on a specific portfolio of financial assets. For a given
portfolio, probability and time horizon, VaR is defined as a threshold value such that the probability
that the mark-to-market loss on the portfolio over the given time horizon exceeds this value
(assuming normal markets and no trading in the portfolio) which is the given probability level.
An alternative to VaR, is the Conditional Value at risk (CVaR). Rockafellar and Uryasev
(Rockafellar & Uryasev, 2000) propose this new technique for portfolio optimization. It calculates
VaR and optimizes CVaR simultaneously. CVaR comes with attractive properties such as transition-
equivariant, positively homogenous and convex, which are absent from VaR. But this kind of
scenario-based stochastic programming method becomes inefficient when dimension gets larger, or in
other words, the number of assets grows.
20. 8
The other proposed reliability method (Hanafizadeh & Ponnambalam, 2009) separates the space of
decision variables from the space of random returns and thus forms a two step recursive optimization
problem.
Basic Theory of Techniques applied
2.5
One underlying assumption underlying modern portfolio theory and the capital asset pricing model is
that investors have homogeneous expectations, which means they have the same estimates and thus
face the same efficient frontiers of risky portfolios and will all have the same optimal risky portfolio.
VaR (Value at Risk)
2.5.1
Let f(x,y) be the loss associated with the decision vector x of Rn
and the random vector y in Rm
.
The underlying probability distribution of y in Rm
will be assumed for convenience to have
probability density p(y).
The probability of f(x,y), not exceeding a threshold α, is then given by
𝛹 𝑥, 𝛼 = 𝑝 𝑦 𝑑𝑦
! !,! !!
7
As a function of α for fixed x, Ψ is the cumulative distribution function for the loss associated with
x. It completely determines the behavior of this random variable and is fundamental in defining VaR
and CVaR.
𝛹 𝑥, 𝛼 is nondecreasing with respect to α and continuous from the right.
The β-VaR is then given by
𝛼! 𝑥 = min 𝛼 ∈ 𝑅: Ψ 𝑥, 𝛼 ≥ 𝛽 8
β is the given probability level.
CVaR (Conditional Value at Risk)
2.5.2
Although VaR is a very popular measure of risk, and has been applied in the financial industry, there
does exist some undesirable features such as a lack of sub-additivity and convexity (Artzner, Delbaen,
Eber, & Heath, 1997) (Artzner, Delbaen, Eber, & Heath, 1999). Sub-additivity and convexity are
especially important in the study of optimization problems. In mathematics, sub-additivity is a
property of a function that evaluating the function for the sum of two elements of the domain always
21. 9
returns something less than or equal to the sum of the function's values at each element, which is
essential when it comes to the computation of the optimization problem. Convexity brings about a
number of convenient properties, where particularly, a convex function on an open set has no more
than one minimum.
CVaR is based on VaR, which can be regarded as an extension to the notion of the worst case
(Quaranta & Zaffaroni, 2008) . It produces a portfolio based on a tail of the mean loss distribution
(Zhu, Coleman, & Li, 2009).
The β-CVaR is given by
𝜙! 𝑥 = 1 − 𝛽 !!
𝑓 𝑥, 𝑦 𝑝 𝑦 𝑑𝑦
! !,! !!! !
9
Define the auxiliary function:
𝐹! 𝑥, 𝛼 = 𝛼 + 1 − 𝛽 !!
𝑓 𝑥, 𝑦 − 𝛼 !
𝑝 𝑦 𝑑𝑦
!∈!!
10
Where
𝑡 !
=
𝑡, 𝑤ℎ𝑒𝑛 𝑡 > 0
0, 𝑤ℎ𝑒𝑛 𝑡 ≤ 0
11
The β-CVaR of the loss associated with any x∈X can be determined from
𝜙! 𝑥 = min
!∈!
𝐹! 𝑥, 𝛼 12
Reliability based optimization method (RBO)
2.5.3
This method takes the first two statistical moments of a linear approximation of the performance
function and attempts to find the minimal distance from the given nominal point to the tangent hyper-
plane. This distance provides a measure of the yield. (Seifi, Ponnambalam, & Vlach, 1999)
Let c* be the reference point at the minimal distance from the nominal point 𝑐 where g(c*
|x) =t,
then linearize g(c|x) about the reference point c*:
𝑔!
𝑐 𝑥 = 𝑔 𝑐∗
𝑥 + 𝑐 − 𝑐∗ !
∇!𝑔 𝑐∗
𝑥 13
The first and second moment of 𝑔!
𝑐 𝑥 can then be computed as:
𝐸 𝑔!
= 𝑡 + 𝑐 − 𝑐∗ !
∇!𝑔 𝑐∗
𝑥 14
22. 10
𝑣𝑎𝑟 𝑔!
= ∇!𝑔 𝑐∗
𝑥 !
𝐶∇!𝑔 𝑐∗
𝑥 15
Assume that the random vector c follows Gaussian distribution, and then rewrite the original
problem into two separate but combined optimization problems.
The so called outer optimization problem is solved in the space of decision variables x and t, when
c* is assumed to be known and is defined as follows:
max
!,!
𝑔 𝑥, 𝑐∗
𝑠. 𝑡.
𝑐 − 𝑐∗ !
∇!𝑔 𝑐∗
𝑥 ≥ Φ!!
1 − 𝛼 ∇!𝑔 𝑐∗
𝑥 !
𝐶∇!𝑔 𝑐∗
𝑥
!
!
𝑒!
𝑥 = 1
𝑥 ≥ 0
16
The inner optimization problem tries to find the value of c* assuming x and t are given.
It is defined as:
𝛽 = min
!
𝑐 − 𝑐 !
𝐶 !!
𝑐 − 𝑐
!
! 𝑔 𝑐 𝑥 = 𝑡 17
The final optimum set is obtained through iteration of these two optimization problems.
Factor Model
2.5.4
2.5.4.1 The definition of a factor model
The factor model is a way of decomposing the forces that influence a security's rate of return into
market and firm-specific influences (Harvey, 2009).
2.5.4.2 Input data issue
There are basically two problems resulting from input data in optimization models.
1) The number of estimates needed for mean-variance analyses
a. Generally, with N different assets, we require a total of (N^2+3*N)/2 different
estimates
2) The use of historic data
First, historic data must be smoothed to try to focus on underlying relationships that are more likely
to be true in the future and to ignore deviations from those relationships that are more likely to be due
23. 11
to random noise or errors. The tools used most often to accomplish this are factor models. (Sharpe,
2012)
N T Available/Estimated
10 60 9.23
100 60 1.17
1000 60 0.12
10 120 18.46
100 120 2.33
1000 120 0.24
10 840 129.23
100 840 16.31
1000 840 1.68
10000 840 0.17
Table 2.1 : Input data number comparison (Sharpe, 2012)
The variable N in the table stands for the number of samples; T is the number of sampling time.
The table above is a specific example showing comparative ratios of parameter estimates available
divided by needed given different sample levels.
As N, the number of samples increases as large as 1000, the number of data available divided by
the number of estimates we need is smaller than 1, which means we are short of data. This is
demonstrated by the case in T=60 and T=120. As for the case in T=840, the shortage becomes a
problem when N reaches 10000.
24. 12
2.5.4.3 The need for Factor model
• Problems involving large numbers of assets require a great many estimates.
• It’s too difficult to estimate each of the required values explicitly.
2.5.4.4 Framework
The Linear Factor Model can be written mathematically as (Sharpe):
𝑅! = 𝑏!! ∗ 𝑓! + 𝑏!! ∗ 𝑓! + ⋯ + 𝑏!" ∗ 𝑓! + 𝑒! (18)
Variable Definition
Ri return of asset i
fm value of factor m
bim factor loadings
M number of factors
ei portion of the return on asset i not related to the m factors
Table 2.2 Definition of variables in factor model
Factor models are also capable of transferring into matrix forms. The matrix representation of
factor model is (Sharpe):
𝑅 = 𝐵 ∗ 𝐹 + 𝐸 (19)
25. 13
Variable Definition
R N*T matrix, where R(i,t) is the return on asset i in realization t
B N*m matrix, where B(i,j) is the exposure of asset i to factor j
F m*T matrix, where F(j,t) is the value of factor j in realization t
E N*T matrix, where E(i,t) is the residual return on asset i in realization t
Table 2.3 Definition of variables in matrix form factor model
2.5.4.5 Factor based portfolio
Factor model can make up a portfolio in the way of a return model (Stubbs, 2012).
As of the matrix form of the factor model shown in equation (19), the expected return model can be
derived as:
𝐸 𝑅 = 𝐵 ∗ 𝐸 𝐹 20
The risk model is:
𝑉𝑎𝑟 𝑅 = 𝐵 ∗ 𝐸 𝐹𝐹!
∗ 𝐵!
+ 𝐸 𝐸𝐸!
= 𝐵Ω𝐵 + Δ (21)
2.5.4.6 Summary
Our factor models are used to estimate the expected returns and variances on risky assets based on
specific factors. For each asset, we need to estimate the sensitivity to each specific factor. In this way
we transform the return data into a basket multiplication of factors and its factor loadings.
Factors that explain asset returns can be classified as macroeconomic, fundamental and statistical
factors. We would go further into that in the next section.
Application Problem
2.6
CVaR
2.6.1
Let µ∈Rn
be the vector of the mean returns of n risky assets. Let xi, 1≤i≤n denote the percentage
holding of the ith
asset. A portfolio allocation is considered to be efficient if it has the minimum risk
for the given level of expected return. Furthermore, the integral in (10) of F can be approximated in
26. 14
various ways (Krokhmal, Palmquist, & Uryasev, 1999). We take advantage of the historical data
obtained from the TSX market recorded on the Yahoo! Finance website as samples for the
distribution of the mean return.
Then the corresponding approximation to F is
𝐹! 𝑥, 𝛼 = 𝛼 +
1
𝑞 1 − 𝛽
𝑓 𝑥, 𝑦! − 𝛼 !
!
!!!
22
In this case, let 𝑓 𝑥, 𝑦 = −𝜇!
𝑥 + ℎ 𝑥 , where the transaction cost function h(x) is also taken into
account.
Rewrite as follows:
𝐹! 𝑥, 𝛼 = 𝛼 +
1
𝑞 1 − 𝛽
−𝜇!
𝑥 + ℎ 𝑥 − 𝛼 !
!
!!!
23
The above conclusions are made under following assumptions:
• The underlying probability distribution of y in Rm
are assumed for convenience to have
probability density p(y).
• We also assume that the probability distribution Ψ(x,α) is non-decreasing with respect to α
and such that no jumps occur, or in other words that Ψ(x,α) is everywhere continuous with
respect to α.
• As a function of α for fixed x, F(x,α) is convex and continuously differentiable.
• 𝐹! 𝑥, 𝛼 is convex and piecewise linear with respect to α.
Reliability based optimization method
2.6.2
In this case, let 𝑔 𝑥, 𝑐 = 𝜇!
𝑥 − ℎ 𝑥 , in which the transaction cost function h(x) is also taken into
account.
In for our case, g(x,c) is a linear function with respect to c( i.e. ∇!𝑔 𝑐 𝑥 = 𝑥), then the outer
optimization problem does not depend on the reference point c*
. Thus, we do not need to solve the
inner optimization problem.
The corresponding deterministic counterpart of the uncertain inequality is
27. 15
𝑐 − 𝑐∗ !
𝑥 ≥ Φ!!
1 − 𝛼 𝑥!
𝐶𝑥
!
! 24
Then the asset allocation problem is simplified to
max
!,!
𝑡
𝑠. 𝑡.
𝑐!
𝑥 − ℎ 𝑥 − Φ!!
1 − 𝛼 𝑥!
𝐶𝑥
!
! ≥ 𝑡
𝑒!𝑥 = 1
𝑥 ≥ 0
25
The Factor Model
2.6.3
The methodology of setting up a factor model can be summarized into several steps.
1) Range of selection for factors
2) Determining number of factors
3) Regression, parameters estimates
4) Model set up
In the factor model, the choices of factors are determined based on two concerns:
1) The economic approach
• macroeconomic and financial market variables (Chen, Roll, & Ross, 1986)
• Characteristics of firms (Fama & French, 1993) (Fama & French, 1992)
2) The statistical approach includes principal component analysis and factor analysis.
For instance, we determine the factor portfolio model for GE company from a range of factors
including gold price, 3-month treasury bill price, unemployment rate, earnings per share of GE,
commodity food & beverage index, consumer price index-oil, export price, book value of GE and
consumer price index all inclusive. Our example would be to use regression analysis to estimate the
relationship between return and these factors. Research has found that stock returns are related to
known economic fundamentals such as interest rates and dividend yields. This is expected to occur in
efficient markets.
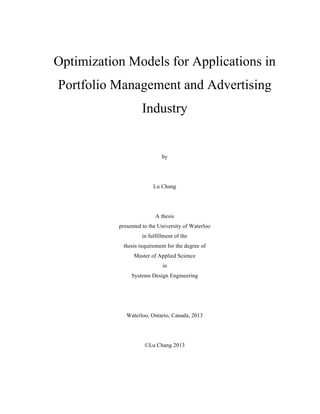
28. 16
Figure 2.1 Predictor importance for GE returns (exported from software: SPSS)
After conducting a regression analysis in the SPSS statistical software, we can obtain the output
shown above. Then the five most influential factors: gold price, 3-month treasury bill price, earnings
per share, unemployment rate and cpi-oil price should be put in the factor model for GE monthly
return model. All applications for the other four equities are shown in appendix A.
Considering the factor model for a portfolio, which is composed of 8 different assets, we would
need to pick the factors that are essential overall. Gold price, unemployment rate and book value for
each company are selected as key factors. In that way, the monthly return of every company, which is
part of the portfolio, are written in the form of a linear factor model with three factors.
Detailed coefficients of GE company are shown in the table below. Bvge stands for book value of
GE company.
29. 17
Coefficientsa
Model Unstandardized Coefficients Standardized
Coefficients
t Sig.
B Std. Error Beta
1
(Constant) .056 .045 1.254 .212
Gold -.302 .191 -.156 -1.579 .117
unemployment -.008 .009 -.083 -.831 .408
Bvge -.001 .003 -.031 -.292 .771
a. Dependent Variable: ge monthly return
Table 2.4 Coefficients of GE factor model (exported from software: SPSS)
All other coefficients are shown in appendix B.
The factor model can be applied to get the data inputs we need for the model. But the application of
factor model for generating data for the portfolio optimization problem is not included in this thesis.
Example Application
2.6.4
Both of the methods (CVaR and RBO) are presented to find optimal solutions for the asset allocation
problem. The results from both methods are compared in terms of efficiency and optimum return
levels. Calculation, simulation, and test are realized via Matlab R2009b in a PC ( intel core i5
processor 2.26GHZ ). The percentage holding of each asset within the n-asset portfolio is denoted by
x=(x1,…xn)T
.
0 ≤ 𝑥! ≤ 1 𝑓𝑜𝑟 𝑗 = 1, … , 𝑛, 𝑤𝑖𝑡ℎ 𝑥! = 1
!
!!!
26
The risk levels are assigned the three most possible values: 0.9, 0.95 and 0.99. The number of
sample data tested is 1000,2000,3633. 3633 is the largest sample we can get ever since the objectives
are listed companies in the market.
30. 18
Data Analysis
2.7
An example is provided in which the optimal portfolio is composed of five equities from Toronto
Stock Exchange Market: Royal Bank of Canada, Suncor Energy Inc., Bank of Nova Scotia, Teck
Resources ltd, Canadian Natural Resources Ltd (Yahoo! Finance). There is diversity in the equities in
the sense that the components of the portfolio are of different industries, e.g. Finance as well as
Resources and Energy. In addition, all of them have been active in the Toronto Stock Exchange
Market ever since 1995. We use daily return data on these five stocks as sources of µ, to set up the
program for different risk levels.
In the following chapters, we will be using the short forms of the equities for simplicity, as shown
in the table below.
Equity Code
Suncor Energy su
Royal Bank of Canada ry
Canadian Natural Resources cnq
Bank of Nova Scotia bns
Teck Resources tck-bo
Table 2.5 equity code list
The mean and covariance information are shown in Table 2.5 and Table 2.6 below, respectively.
According to Table 2.5, all of the five stocks are price gainers, or more specifically, equities that
have positive daily return. Moreover, all of the entries in the covariance matrix are non-zero.
31. 19
Equity mean return
Suncor Energy 0.0010
Royal Bank of Canada 0.0007
Canadian Natural Resources 0.0011
Bank of Nova Scotia 0.0008
Teck Resources 0.0008
Table 2.6 mean return (4124 samples)
Furthermore, all of the entries in the correlation coefficient matrix are non-zero according to Table
2.8. These all show that there is correlation (linear dependence) among these five stocks.
All in all, all five equities with correlation set up the targeted portfolio.
su ry cnq bns tck-bo
su 0.0005 0.0001 0.0004 0.0001 0.0003
ry 0.0001 0.0002 0.0001 0.0002 0.0002
cnq 0.0004 0.0001 0.0006 0.0001 0.0004
bns 0.0001 0.0002 0.0001 0.0003 0.0002
tck-bo 0.0003 0.0002 0.0004 0.0002 0.0010
Table 2.7 covariance matrix (4124 samples)
32. 20
su ry cnq bns tck-bo
su 1.0000 -0.9102 0.7374 -0.8729 0.3924
ry -0.9102 1.0000 -0.8136 0.7038 -0.2737
cnq 0.7374 -0.8136 1.0006 -0.7804 0.3681
bns -0.8729 0.7038 -0.7804 1.0003 -0.2736
tck-bo 0.3924 -0.2737 0.3681 -0.2736 1.0010
Table 2.8 correlation coefficient (4124 samples)
One other alternative for data entry is to use the factor model. The factor model can be applied to
the get the data inputs we need for the model. The application of factor model for generating data for
the optimization problem is not included in this thesis.
Convergence Proof
2.8
To carry out the convergence study of the RBO method and the CVaR when they are applied to this
asset allocation problem, tests for different risk levels are conducted.
Figure 1 and 2 in the next few pages show the trend of f(x) as the algorithm iterates. All of them do
converge after a small number of iterations, with little difference in different risk levels. Data are
obtained through Matlab’s internal computation process. For the CVaR method, the y-label f(x)
displayed in the curve stands for the 𝐹!(𝑥, 𝛼) in equation (23), but not the loss function mentioned
before; In the RBO method, f(x) stands for −𝑐!
𝑥 + ℎ 𝑥 + Φ!!
(1 − 𝛼)(𝑥!
𝐶𝑥)!/!
.
In comparison, the RBO reliability method converges much more quickly than the CVaR method
after approximately four to five iterations. By examining the convergence curve for both methods, we
can determine that, in some cases, oscillations are introduced into the CVaR method. As the number
of sample data increases, oscillations seem to be more obvious and magnified. Another finding is that
RBO arrives at a faster convergence rate when the optimization problem turns out to be in high
dimension. This is good news for its value in industrial applications.
38. 26
Figure 2.3-(3) RBO with risk level 0.99, samples: 1000
Figure 2.3-(4) RBO with risk level 0.9, samples: 2000
39. 27
Figure 2.3-(5) RBO with risk level 0.95, samples: 2000
Figure 2.3-(6) RBO with risk level 0.99, samples: 2000
40. 28
Figure 2.3-(7) RBO with risk level 0.9, samples: 3000
Figure 2.3-(8) RBO with risk level 0.95, samples: 3000
41. 29
Figure 2.3-(9) RBO with risk level 0.99, samples: 3000
Figure 2.3-(10) RBO with risk level 0.9, samples: 4124
42. 30
Figure 2.3-(11) RBO with risk level 0.95, samples: 4124
Figure 2.3-(12) RBO with risk level 0.99, samples: 4124
Figure 2.3 Convergence demonstration of RBO with different risk levels and samples
Result Analysis
2.9
Case1: CVaR
2.9.1
VaR is obtained as a byproduct of this optimization problem programmed in Matlab. The unique
solutions for the optimal portfolio x*
, VaR as well as CVaR for three different risk levels, are
displayed in the tables below (Tables 2.9-2.12).
For a specific risk level, VaR and CVaR differ only slightly depending upon the number of
samples.
43. 31
For different risk levels, 0.9, 0.95 and 0.99 in the same scale of data, as the value of the risk level
increases, the corresponding VaR and CVaR also increase. This finding coincides with the fact that
the risk level naturally corresponds to an investor's tolerance to estimation risk.
β=0.9 β=0.95 β=0.99
x*
su 0.5446 0.5197 0.5769
ry 0.4393 0.4751 0.4231
cnq 0.0058 0.0000 0.0000
bns 0.0000 0.0000 0.0000
tck-bo 0.0102 0.0052 0.0000
VaR 0.0115 0.0172 0.0318
CVaR 0.0198 0.0254 0.0396
Table 2.9 data samples=1000, CVaR
β=0.9 β=0.95 β=0.99
x*
su 0.2883 0.3310 0.3206
ry 0.4802 0.4402 0.5290
cnq 0.0955 0.0505 0.0813
bns 0.0843 0.1330 0.0691
tck-bo 0.0518 0.0452 0.0000
VaR 0.0139 0.0190 0.0332
CVaR 0.0219 0.0277 0.0395
Table 2.10 data samples = 2000, CVaR
44. 32
β=0.9 β=0.95 β=0.99
x*
su 0.2437 0.2584 0.3325
ry 0.5015 0.4730 0.5211
cnq 0.0644 0.0256 0.0928
bns 0.1447 0.1889 0.0536
tck-bo 0.0457 0.0541 0.0000
VaR 0.0129 0.0176 0.0315
CVaR 0.0201 0.0252 0.0371
Table 2.11 data samples = 3000, CVaR
β=0.9 β=0.95 β=0.99
x*
su 0.1992 0.1499 0.0448
ry 0.5205 0.5334 0.5984
cnq 0.0243 0.0467 0.0000
bns 0.2560 0.2700 0.3568
tck-bo 0.0000 0.0000 0.0000
VaR 0.0142 0.0211 0.0393
CVaR 0.0250 0.0326 0.0538
Table 2.12 data samples = 4124, CVaR
Case2: RBO
2.9.2
In this method, t is the target of the total investment, or the net return of the portfolio.
The unique solutions for the optimal portfolio x, as well as t for three different risk levels and three
different data dimensions, are displayed in the tables below (Table 2.13-2.16). For different risk
levels, 0.9, 0.95 and 0.99 in the same scale of data, as the value of the risk level increases, the
corresponding t also increases greatly. For a specific risk level, t differs only slightly depending upon
the number of samples.
45. 33
β=0.9 β=0.95 β=0.99
x*
su 0.4121 0.4093 0.3955
ry 0.4848 0.4795 0.4865
cnq 0.0852 0.0854 0.0752
bns 0.0000 0.0000 0.0000
tck-bo 0.0180 0.0259 0.0428
t 0.0138 0.0177 0.0251
Table 2.13 Data samples = 1000, RBO
β=0.9 β=0.95 β=0.99
x*
su 0.2955 0.2778 0.2753
ry 0.4042 0.4202 0.4217
cnq 0.1327 0.1322 0.1313
bns 0.1223 0.1215 0.1167
tck-bo 0.0452 0.0482 0.0551
t 0.0155 0.0199 0.0280
Table 2.14 Data samples = 2000, RBO
46. 34
β=0.9 β=0.95 β=0.99
x*
su 0.2378 0.2361 0.2160
ry 0.4176 0.4211 0.4397
cnq 0.0875 0.0868 0.0960
bns 0.2090 0.2073 0.1957
tck-bo 0.0481 0.0487 0.0526
t 0.0142 0.0183 0.0258
Table 2.15 Data samples = 3000, RBO
β=0.9 β=0.95 β=0.99
x*
su 0.1530 0.1527 0.1840
ry 0.3867 0.3881 0.4140
cnq 0.0942 0.0928 0.0668
bns 0.3661 0.3664 0.3352
tck-bo 0.0000 0.0000 0.0000
t 0.0180 0.0231 0.0325
Table 2.16 Data samples = 4124, RBO
47. 35
Computational Efficiency
2.10
The following table shows exactly how much time each algorithm takes in terms of data scale and
risk levels.
CVaR takes more time and space, especially when the dimension grows since CVaR is a kind of
scenario-based stochastic programming method. However, the number of decision variables in RBO
remains the same irrespective of number of samples, so it is more efficient.
When we consider accuracy, the better solution must always be traded-off with higher computing
costs.
As Table 2.18 shows, as samples increase from 1000, 2000 to 4124, CVaR has a larger growth in
time, which implies difficulties for large-scale problems solving in the real financial market. The
RBO reliability method is so efficient that its speed remains about the same. This method takes just a
few seconds as the sample doubles. Furthermore, CVaR needs to store the whole data matrix in the
process of computation. On the other hand, RBO needs to obtain only the mean and variance vectors
on hand before calculation.
Case1: CVaR
2.10.1
β=0.9 β=0.95 β=0.99
Sample number cputime(s)
1000 7.3008 6.3960 9.7657
2000 21.6685 22.7605 26.4578
3000 26.8166 19.7653 32.6510
4124 20.8573 37.0502 30.3734
Table 2.17 Efficiency: CVaR
Case2: RBO
2.10.2
48. 36
β=0.9 β=0.95 β=0.99
Sample number cputime(s)
1000 4.9296 3.4944 3.9156
2000 4.9920 5.1480 5.1168
3000 5.8032 5.6316 8.3773
4124 3.8064 4.0560 4.5084
Table 2.18 Efficiency: RBO
Conclusion
2.11
This Chapter presented methods for solving the portfolio optimization problem in which the investors
pay a transaction cost as a function of the trading volume of the risky assets. The main contribution
goes to the extension of both the Conditional Value at Risk method and the reliability based
optimization method, with an application in asset allocation considering nonlinear transaction costs.
The RBO method is faster especially in higher dimensions; The CVaR risk measurement can be more
accurate since it is entirely based on historical data.
49. 37
Chapter 3
Case study 2: Online Display Advertising Allocation Problem
Introduction
3.1
As is shown in the Actual +2011 Estimated Canadian online Advertising Revenue Survey detailed
report supported by IAB Canada, in 2010, online ad revenues surpassed Daily Newspaper ad
revenues. As a result, the Internet is now second only to Television in terms of share of total
Canadian media advertising revenue (15.9%). This is a convincible fact showing the critical role of
online advertising in the advertising industry. (IAB Canada, 2012)
Moreover, the potential expansion of business in online advertising is inevitable. Online
advertising’s 23% increase from 2009 to 2010 also bested other major media, all but one experiencing
only single-digit growth rates during this time. Online advertising growth as is surprisingly high,
which we can see clearly in the table below.
Total 2010 Online Advertising Revenue
2009 2010 %growth
Millions($) 1822 2232 23
Table 3.1 Online Advertising Revenue
Nobody could resist this “big tasty cake”. Canadian Online Advertising Revenues for 2010
exceeded budgeted expectations of $2.1 billion and grew by 23% to $2.23 billion for 2010, while it
still remains underdeveloped (IAB Canada, 2012). Algorithms as well as techniques need
advancement and attention of mathematicians, financial engineers and IT specialists.
The automation platform for the online media exchange system boosts the values of the publishers’
remnant inventory and tries to produce the most competitive outcomes for both parties, advertisers
and publishers, through the allocation process.
Types of Advertising
3.2
Normally, advertisements are grouped into three different categories: display advertising, networking
and affiliation advertising and search-based advertising. What we are focusing on in this thesis is the
50. 38
first type: display advertising, and more specifically, online display advertising. The “online” feature
indicates how it differs from traditional media in the advertising industry. Meanwhile, “display”
shows that advertisement could be shown in different formats, such as text, picture, music, video and
etc.
Search advertising continues to lead in terms of share of dollars booked by Online Publishers ($907
million/41%), followed by Display ($688 million/31%) and Classifieds ($587 million/26%).
Together, these three advertising vehicles represent 98% of all online advertising booked in Canada.
Online advertising eliminates transportation cost and at the same time enjoys all convenience of
online business. The advancement of information technology now enables and guarantees easy access
to advertisements at anytime anywhere to any web users. The immediate publishing of information is
not limited by geography or time (Hanafizadeh, Online Advertising and Promotion: Modern
Technologies For Marketing, 2012).
It’s also user-friendly as it offers several options to users. For example, the ads could be opened or
closed, clicked or expanded, paused or downloaded according to user’s preferences.
There are a series of targeting tools available including contextual targeting, placement targeting,
remarketing, demographic targeting and interest categories that matches contents of ads with contents
of websites to the right people. “Right” here mean audiences with the same age, gender, interests or
region. By design, the system uses cookie and browser history to determine geographic and interests.
Goals of Publishers and Advertisers
3.3
On the one hand, the advertisers try to put their ads on the publisher’s website with the lowest
possible cost. On the other hand, the publishers are seeking competitive revenues for all their
available resources. This involves the basic demand-supply economic relationships between
publishers and advertisers.
Besides this, advertisers has certain goals to accomplish, whether it’s to generate brand awareness,
target certain customer groups or promote direct purchases, there are different models to support each
mission.
• If you want to generate traffic to your website, focusing on clicks could be ideal for you.
Cost-per-click (CPC) bidding, manual or automatic, may be right for your campaign.
51. 39
• If you want to increase brand awareness, not driving traffic to your site, focusing on
impressions may be your strategy. You can use cost per thousand impressions (CPM)
bidding to put your message in front of customers.
• If you want customers to take a direct action on your site, and you're using conversion
tracking, then it may be best to focus on conversions. The advanced bidding option,
namely, the cost-per-acquisition (CPA) bidding allows for such a possibility (Google Inc,
2012)
The Revenue Model
3.4
CPM
3.4.1
Cost per impression, often abbreviated to CPI or CPM (Cost per mille) are terms used in online
advertising and marketing related to web traffic. They refer to the cost of internet marketing
campaigns where advertisers pay for every time their ad is displayed, usually in the form of a banner
ad on a website (Wiki).
An impression is the display of an ad to a user while viewing a web page. A single web page may
contain multiple ads. In such cases, a single page view would result in one impression for each ad
displayed. In order to count the impressions served as accurately as possible and prevent fraud, an ad
server may exclude certain non-qualifying activities such as page-refreshes or other user actions from
counting as impressions. When advertising rates are described as CPM or CPI, this is the amount paid
for every thousand qualifying impressions served.
Cost per mille is one of the most common marketing practices used on the internet along with CPC
and CPA described below.
CPC
3.4.2
Pay per click (PPC) (also called Cost per click) is an internet advertising model used to direct traffic
to websites, where advertisers pay the publisher (typically a website owner) when the ad is clicked.
There are two primary models for determining cost per click: flat rate and bid-based. In both cases
the advertiser must consider the potential value of a click from a given source. This value is based on
the type of individual the advertiser is expecting to receive as a visitor to his or her website, and what
the advertiser can gain from that visit, usually revenue, both in the short term as well as in the long
52. 40
term. As with other forms of advertising targeting is key, and factors that often play into PPC
campaigns include the target's interest, intent (e.g., to purchase or not), location and the day and time
that they are browsing (Wiki, 2012).
CPA
3.4.3
Cost Per Action or CPA (sometimes known as Pay Per Action or PPA) is an online
advertising pricing model, where the advertiser pays for each specified action (a purchase, a form
submission, and so on) linked to the advertisement (Wiki, 2012).
Statement of Problem
3.5
The functioning process of the system can be described as follows: in general, there are two basic
types of buying and selling: guaranteed and unguaranteed. All advertisers and publishers could
exchange and trade either in the guaranteed contract system or the unguaranteed (spot) market or
both. Advertisers may manage their ads at the beginning of each trading period by setting up budgets
and bid types. Normally, advertisers are allowed to set up daily budget, monthly budget, bi-monthly
budget or for an even longer period. These budgets can be represented in terms of monetary value or
numbers of advertisements. The options of bidding types range from cost-per-click (CPC), cost-per-
view (CPV), cost-per-acquisition (CPA) and so on. Trading periods vary from one day, one month,
and two months to a longer time period and it is related to the advertisers’ preferences.
At the beginning of each trading period, all advertisers who are willing to conduct financial
transactions in the guaranteed contract system would send a request to the trading system platform
announcing how many advertisements they would like to purchase for their personalized contracts.
Meanwhile, there are a lot of activities going on from the publishers’ side (seller’s side). When a
visitor visits a publisher’s web site, a new “session” begins and there are one or several iterations of
the following sequences of events:
The visitor requests a certain page to the web server (via its URL), and then the requested page is
displayed to this visitor with an advertisement embedded in it within a very short period of time.
The visitor clicks on the advertisement with probability ctrbc where b denotes the user profile of the
visitor (i.e. a Bernoulli trial with success probability pi,k) and c denotes the feature of the advertiser;
this probability is usually called the click-through rate and the click-through rate (CTR) is
summarized and updated right after each page view (impression) occurred. If there is a click, then the
53. 41
revenue associated with the advertisement, that is pricebc, is obtained. After a certain number of page
requests, the visitor leaves the web site and the session terminates. The website will keep recording
all the statistics of click-through-rate as well as the number of impressions and clicks.
At the beginning of the transaction, the publishers will make an estimate of how many
advertisements they are supposed to exchange with the advertisers, which is probably going to be the
amount of transaction signed for the contract. Then the system helps to match both the advertisers’
need and the publishers’ supply with a reasonable contract that clearly identifies duties, trading
amount, trading value, maturity date and any other restricted elements so that they could maximize
their revenues.
Figure 3.1 Functional process of the trading system
Adver*ser
Ad1
Ad2
Ad3
Ad4
Ad5
Ad
n
Publisher
Pub1
Pub2
Pub3
Pub4
Pub5
Pub
n
User
visit
system
plaIorm
54. 42
Guaranteed contracts and unguaranteed contracts
3.6
Guaranteed Contracts
3.6.1
Guaranteed contracts are contracts signed at different points of time before they start. It is a
standardized contract between two parties issued at a fixed rate agreed today with a specified amount
of trading volume guaranteed to deliver during a predetermined period of time, i.e., the publishers
guarantee certain number of impressions, clicks or actions according to the signed contract before the
contract terminates and the advertisers agree to make payment at the beginning of the period.
Advertiser’s inventory and audience preferences are diverse; therefore it’s hard to determine
demand categorization.
Unguaranteed Contracts
3.6.2
Unguaranteed contracts refer to those occurred in the spot market, they are operated by auction
through exchange. The prices are flexible and volatile, which is similar to other trading systems, and
the trading volume varies among different trading activities.
Uncertainty
3.7
There is bias coming from variations in advertiser inventory requirements and noise from changes in
current economy, seasonality and management decisions.
The uncertainty in this problem lies in the random nature of demand and supply, but we do not
need to concern about the changes in demand because the spot market price is quite unpredictable.
There are basically two problems involving the supply-demand relationship: How much inventory is
available? What is the cost for advertiser? The first question varies by seasonal effects, user growth
and economic environment.
Literature Review
3.8
Google Adwords, Yahoo! search marketing, Google Adsense and Microsoft adCenter are popular
network systems that are most competitive in the ad market and they enable ads to be shown on
relevant web pages or alongside search results.
In the research paper by Roles and Fridgeirsdottir (Roels & Fridgeirsdottir, 2009), the authors
propose dynamic optimization model for web publishers to maximize their revenue from online
display advertising. Similar to airline revenue management, in this model, the authors propose
55. 43
methods for web publishers to decide whether or not to accept an advertising request. Also, certainty
equivalent heuristic is proposed to solve dynamic optimization problem.
Most of the past work simply uses strictly deterministic models or linear multi objective
programming (Yang, et al., 2010) (Ahmed & Kwon, 2012) which neglects the fact that there’s
uncertainty in the problem.
Remodel for media selection problem
3.9
The model solving the allocation problem among all advertisers and publishers will be going from a
deterministic case to a stochastic case.
The deterministic model, based on the allocation model that is commonly used, has been modified
and can be described as:
max!.!. 𝑟𝑎𝑛𝑘!"
!,! ∗ 𝑝𝑟𝑖𝑐𝑒!" ∗ 𝑥!! + 𝑠𝑝𝑜𝑡! ∗ max 𝑧!, 0
! + ℎ ∗ 𝑚𝑖𝑛 𝑧!, 0
!
𝑥!"
! + 𝑧! ≤ 𝑠!
𝑥!"
! ≤ 𝑑!
𝑥!" ≥ 0
(27)
The variables are defined in Table 3.2 below. It indeed combines both the revenues gained from the
guaranteed contracts and the unguaranteed part, and deducts a penalty value if existing.
But this deterministic model regards supply and demand of advertisements in the future as a
constant value; it also ignores the uncertain nature of the parameters rank, price and spot.
Moving forward to the stochastic model, the problem of online display advertising can be
generalized as follows:
max!.!. 𝑡
𝑃𝑟 𝑔(𝑥, 𝑧) ≥ 𝑡 ≥ 1 − 𝜃
𝑔 𝑥, 𝑧 = 𝑟𝑎𝑛𝑘!"
!,! ∗ 𝑝𝑟𝑖𝑐𝑒!" ∗ 𝑥!" + 𝑠𝑝𝑜𝑡! ∗ max 𝑧!, 0
! + ℎ ∗ 𝑚𝑖𝑛 𝑧!, 0
!
𝑃𝑟 𝑥!"
! + 𝑧! ≤ 𝑠! ≥ 1 − 𝛼
𝑥!"
! ≤ 𝑑!
𝑥!" ≥ 0
(28)
The probability of gaining a maximum revenue at specific optimal x and z is set by 𝜃. Because of
the randomness in contract prices and spot prices, we cannot say for sure that we can obtain a
maximized income every time we set the output x and z as our selection. Instead, we can guarantee
that with probability (1- 𝜃) we can reach our target.
56. 44
The other addition to the model is the stochastic form of supply.
The definitions of parameters are also summarized as:
Parameter Definition
i i=1..n, the subscript representing the ith
publisher
j j=1..m, the subscript representing the jth
advertiser
𝜃 risk ratio
rank combines both quality and price
price contract price per click for guaranteed contracts
x the decision variable, i.e., the number of impressions allocated to guaranteed contracts
spot spot price offers on trading system for thousand impressions
z the number of impressions displayed for unguaranteed spot market
s the number of user visits (impressions) available for the ith ad unit
𝛼 ratios for chance constraints
d current market demand for guaranteed contracts for the jth ad opportunity
h penalty ratio per unit
Table 3.2 Definition of parameters
xij, zi are the decision variables and they can be combined into one when setting z as the last row in
the matrix formulation of x.
The system needs to decide upon how to allocate ads to publishers so that the whole system,
including all advertisers and publishers, could obtain a maximum return.
57. 45
The thesis tries to match ad opportunities with each ad unit (space) available. They are not in a one-
by-one relationship. Each advertiser could sign contracts with different publishers for displaying their
ads. The publishers could also take advantage of available user visits to allocate to different ads if
possible.
All publishers would be trading off among guaranteed contracts (represented by the number of x)
and spot markets (represented by the number of z). We also assume that there is always enough ad
opportunities to fill out each ad space.
Ad Rank
3.9.1
The ad rank parameter used in our model is not simply the same with click through rate. Ideally, it is
composed of click through rate as well as ad quality. Moreover, ad quality refers to the relevance of
an ad to the user.
Click-through rate of an advertisement is defined as the number of clicks on an ad divided by the
number of times the ad is shown (impressions), expressed as a percentage
So ad rank can be represented by a factor model, which looks like:
𝐴𝑑 𝑟𝑎𝑛𝑘 = 𝛼 ∗ 𝑐𝑡𝑟 + 𝛽 ∗ 𝑟𝑒𝑙𝑒𝑣𝑎𝑛𝑐𝑒 + 𝛾 ∗ 𝑏𝑖𝑑 𝑝𝑟𝑖𝑐𝑒 + ⋯ (29)
Ctr in the equation (29) is the click-through-rate. Advertisers would only bid what an ad is worth to
them. But ad price is only one part of the story. A more important measure for advertisers large and
small is the return on investment of their advertising dollar. The ad rank which includes ad relevance
will help advertisers convert more clicks into customers by showing more relevant ads on publishers’
website, giving advertisers a better return for every dollar they invest.
Unlike other systems that are advertiser-driven or publisher-driven, this system deals with it all in a
whole and there are no conflicts in earning more revenues. It will allow publishers to show more ads
on pages where they previously showed no ads or only a few ads. Furthermore, advertisers will get
more clicks on ads because the quality and relevance of those ads will be better. As is true today,
advertisers are ultimately in control of how much they spend because they only pay what an ad is
worth to them. So consumers will see more relevant ads and advertisers will attract more customers as
a result.
The ad rank in the model, which is used as an affecting factor in decision-making, helps ensure that
users see the most relevant ads not just the most expensive. It is a formula that reflects which ads
58. 46
consumers prefer based on how they respond to the ads. By using ad rank in addition to ad price in
our advertising system, smaller companies can more effectively compete with larger businesses by
creating highly relevant ads and websites.
The optimization problem
3.10
The main idea of the selection process is to pay the lowest amount possible for the highest position
you can get given your quality score and bid price.
We’ve already known from the CVaR part that if we are minimizing F in Equation (30), it is
equivalent to minimizing the inverse of our original objective that is represented in equation (9).
The approximation to F is
𝐹! 𝑥, 𝛼 = 𝛼 +
!
! !!!
𝑔 𝑥, 𝑧 − 𝛼 !
!
!!! (30)
In this case, let
𝑔 𝑥, 𝑧 = − 𝑟𝑎𝑛𝑘!"
!,! ∗ 𝑝𝑟𝑖𝑐𝑒!" ∗ 𝑥!" − 𝑠𝑝𝑜𝑡! ∗ max 𝑧!, 0
! − ℎ ∗ 𝑚𝑖𝑛 𝑧!, 0
! ,
Rewrite as follows:
𝐹! 𝑥, 𝛼 = 𝛼 +
!
! !!!
− 𝑟𝑎𝑛𝑘!"
!,! ∗ 𝑝𝑟𝑖𝑐𝑒!" ∗ 𝑥!" − 𝑠𝑝𝑜𝑡! ∗ max 𝑧!, 0
! − ℎ ∗
!
!!!
𝑚𝑖𝑛 𝑧!, 0
! − 𝛼
!
(31)
Then we could solve the online display advertising problem taking advantage of the CVaR method.
Reasonable data
3.11
We consider the case that has five samples, five publishers and five advertisers.
The demand for guaranteed contracts of each advertiser participating in the market is assumed to be
d=mu2= [3500,3500,3500,3500,3500].
Besides, the page-view (supply) of each publisher is considered to follow a normal distribution
whose mean value is µ=mu1=[2800, 3000, 3000, 3400, 2700] and the variance is
σ=var1=[300,100,200,200,150] for the normal random variable s.
Using the third constraint in the optimization problem, it can be further stated as:
𝑃𝑟 𝑠 − 𝜇 /𝜎 ≥ 𝑥!" + 𝑧! − 𝜇
! /𝜎 ≥ 1 − 𝛼 (32)
59. 47
Using the cumulative density function of the standard normal random variable, it can be simplified
as:
1 − Φ 𝑥!" + 𝑧! − 𝜇
! /𝜎 ≥ 1 − 𝛼 (33)
where Φ is the inverse normal distribution function.
This can be further simplified as:
Φ 𝑥!" + 𝑧! − 𝜇
! /𝜎 ≤ Φ −𝐾! (34)
The chance constraint can now be transformed into a deterministic constraint as:
𝑥!" + 𝑧! ≤ 𝜇 − 𝜎
! 𝐾! (35)
Using the same method, the second constraint in the optimization problem can also be simplified
as:
𝑥!" ≤ 𝜇! − 𝜎!
! 𝐾! (36)
Data entries for input parameters are assumed as follows:
rank=unifrnd(0.1,0.3,5,5)
unifrnd is a built-in function in Matlab to produce continuous uniform distribution, so that ad rank
is randomly distributed between the range of [0.1%,0.3%], which matches market statistics report:
The average click-through rate of 3% in the 1990s declined to 0.1%-0.3% by 2011. The contract price
is considered identical and follows normal distribution with randomly chosen mean value of
[5,6,6,7,8] and variance [0.3,0.1,0.2,0.3,0.3]. The spot price in the unguaranteed market is also
assumed to be following normal distribution with mean [0.9,1,1.1,1.3,1.5] and variance
[0.1,0.1,0.1,0.1,0.1]. The penalty ratio h is chosen as 1.2. There exist a relationship among the value
of contract price, spot price and penalty h:
Spot price<contract price<penalty value
This makes sense because business contracts involve more risk and promised duties, and that’s
exactly why contract price is greater than spot price in the exchange market. Besides this, the penalty
value is also set above the contract price, which is intended to constraint publishers from breaking
contracts so easily.
60. 48
One another option of generating data is to use the factor model, which requires in-depth research
in the relationship of supply, demand, market price with.major economic and statistical factors. But
this application of data inputs with the use of factor model is not included in this thesis.
Optimization Techniques
3.12
In principle, a stochastic programming approach under the current assumptions is a little more
computationally difficult than the deterministic model. In this thesis, we are applying CVaR to this
online advertising case.
Results Analysis
3.13
Case1: Sensitivity to the number of sample used
3.13.1
1) sample number N=10
Advertiser/Publisher 1 2 3 4 5
1 145 1641 83
2 1549 34 652 718 502
3 41 655 1426 1378
4 1521 2 1425 552
5 541 303 1215
Spot/penalty 114 2365 5 4 -755
Table 3.3 Allocation result-sample number N=10
Objective=19443.60416
2) sample number N=20
61. 49
Advertiser/Publisher 1 2 3 4 5
1 852 33 157
2 292 503 2411 294
3 1939 400 32 338
4 329 70 184 893
5 705 426 2
Spot/penalty -228 1417 230 3132 1705
Table 3.4 Allocation result- sample number N=20
Objective=16419.28355
3) sample number N=30
Advertiser/Publisher 1 2 3 4 5
1 586 78 2
2 1422 838 645 580
3 281 162 1213
4 893 324 4 1
5 433 586 274
Spot/penalty 2 1293 2666 1795 2038
Table 3.5 Allocation result- sample number N=30
Objective=15779.24828
From Figure 3.2 we can see that the revenue of the total market does not vary much as the sample
numbers go up. It only slightly decreases as more samples show more statistical characteristics of
both publishers and advertisers.
62. 50
Figure 3.2 Total Revenue vs. sample number
Case1: Sensitivity to competitor numbers
3.13.2
1) publisher number N=5
Publisher/Advertiser 1 2 3 4 5 Spot/penalty
1 852 292 1939 329 -228
2 33 503 400 70 705 1417
3 157 2411 32 426 230
4 338 184 2 3132
5 294 893 1705
Table 3.6 Allocation result- publisher number N=5
Objective=16419.28355
2) publisher number N=10
65. 53
As we keep adding more publishers, and introducing more competition into the market, the supply
goes up and the output of the objective function shows that our total revenue for both advertisers and
publishers dramatically increases. This can be shown clearly from the figure below:
Figure 3.3 Total Revenue versus the number of publishers
One more interesting fact is that the system tends to give more availability to the spot market
instead of signing guaranteed contracts. The three tables for publishers with the number of 5, 10 and
20 show that the number of allocation for spot contracts is obviously increasing for each publisher.
Case3: Sensitivity to risk ratio
3.13.3
1) θ=0.8
67. 55
Advertiser/Publisher 1 2 3 4 5
1 1896 145 1142
2 1249 64 251
3 1953
4 1 2 83
5 599
Spot/penalty 1 1564 1303 3570 2293
Table 3.11 Allocation result-risk ratio θ=0.95
Objective=12539.04
4) θ=0.99
Advertiser/Publisher 1 2 3 4 5
1 2831 1343
2 1 200 358 33
3 825 367 339
4 78 741 330 475
5 971 239
Spot/penalty -990 1492 1187 1682
Table 3.12 Allocation result-risk ratio θ=0.99
Objective=12963.25672
The risk ratio θ stands for the probability of gaining a maximum revenue, or the preference of the
investor’s risk acceptance. The more θ reaches 1, that is 100% probability, the more safe and secure
the investment is. On the other hand, if θ goes far below 1, the investment will be regarded as quite
risky.
The figure shows exactly how our advertising allocation goes when θ changes.
68. 56
Figure 3.4 Total Revenue versus risk ratio
Case4: Sensitivity to penalty value
3.13.4
1) h=0.8
Advertiser/Publisher 1 2 3 4 5
1 8 881 663
2 3 619 497
3 3 260 44 33 105
4 60 23 149 107 29
5 23 337
Spot/penalty 1352 30 1128 1128
Table 3.13 Allocation result-penalty value h=0.8
Objective=4047.241051
2) h=1.2
69. 57
Advertiser/Publisher 1 2 3 4 5
1 852 33 157
2 292 503 2411 294
3 1939 400 32 338
4 329 70 184 893
5 705 426 2
Spot/penalty -228 1417 230 3132 1705
Table 3.14 Allocation result-penalty value h=1.2
Objective=16419.28355
3) h=1.5
Advertiser/Publisher 1 2 3 4 5
1 342 998 1663
2 723 620
3 1133 33 460 1
4 1266 394
5 157 662 773 285
Spot/penalty 1 1615 1629 454 1014
Table 3.15 Allocation result-penalty value h=1.5
Objective=5691.287371
Comparing the objective function values of the three cases of different penalty values, we can see
that total revenue reaches the maximum at h=1.2, but drops when it gets smaller to 0.8 or goes up to
1.5.
The decrease in revenue is resulted from a low spot price when compared to contract price and
penalty terms. So even if penalty gets smaller, gain from spot market is not as profitable as it is in the
70. 58
guaranteed contract market. For the second case, that is penalty gets higher and strict, the market will
tend to be more cautious, and hence limits the growth of revenue.
Figure 3.5 Total Revenue versus penalty value
Conclusion
3.14
This chapter deals with the online display advertising problem in which publishers and advertisers
engage in the online display advertising trading system. The main contribution here is the stochastic
formulation of the online display advertising model, the optimization formulation of the advertising
problem with CVaR and the experimental evaluation of proposed techniques. The simulations are
conducted under scenarios with different parameter values. The model, which incorporates
uncertainty into it, has the ability to respond to volatility in the trading market.
71. 59
Chapter 4 Conclusion and Future Work
Summary of work
4.1
In this study, we have presented stochastic formulations of optimization models utilizing advanced
mathematical and statistical techniques for problems in Finance. One of the case studies is a portfolio
optimization; the other one is an online display advertising case.
In chapter 2, the objective of the portfolio optimization model is set up with a transaction cost
function. This is derived from the fact that we cannot make our investment decisions solely on the
basis of our preferences of return and risk levels. From a more realistic aspect, the final optimal result
will also be affected by transaction costs and taxes.
Both the Conditional Value at Risk and reliability based optimization method are applied to solve
the optimization problem and including a risk measure.
The use of factor model to replace original return data is also addressed for the optimization
problem. It overcomes the bias in historical data, which may not be a perfect representative for the
future. Moreover, it makes up for the shortage of availability of data resources.
In Chapter 3, the thesis contributes in constructing the modeling of online display advertising. This
approach puts uncertainty into the supply, demand and price volatilities into the model, which makes
it a random complex problem to solve. The algorithm of Conditional Value at Risk is applied to the
optimization formulation for the advertising problem for the first time in literature. Experimental
evaluations of the proposed techniques are applied to test the efficiency and reliability of the system.
From the result of the portfolio optimization problem we could see that The RBO method comes to
a faster solution especially in higher dimension. The CVaR risk measurement can be more accurate
for a specific case since it is entirely based on every single historical data. From the experimental
result of the online display advertising problem, we obtained the breakeven point for the penalty ratio
which goes to maximum total revenue at this point.
Future approach
4.2
1. The CVaR and the reliability based optimization method are both applied for a single period
transaction. We may extend the model to a multi-period problem so that it carries on as a
series of investment decisions under a long-term investment plan.
72. 60
2. It’s also possible to go from a linear factor model to time-varying factor model which is
dynamic; another option is an augmented risk model which adds one additional risk factor to
the original factor model which captures the effect of the missing factors.
3. Data resources of online display advertising are limited as a result of its commercial privacy
constraints from service providers.
73. 61
Appendix A
Predictor Importance Figures
Equity Code
Union pacific corporation UNP
Apple Inc. AAPL
ArthroCare Corporation ARTC
Exxon Mobil Corporation XOM
Princeton National Bancorp Inc. PNBC
ING Groep NV ING
Wells Fargo & Company WFC
Table A 1 code denotation for equity used
Figure A 1 Predictor importance figure for UNP
74. 62
Figure A 2 predictor importance figure for AAPL
Figure A 3 Predictor importance figure for ARTC
75. 63
Figure A 4 Predictor importance figure for XOM
Figure A 5 Predictor importance figure for PNBC
76. 64
Figure A 6 Predictor importance figure for ING
Figure A 7 Predictor importance figure for WFC
77. 65
Appendix B Coefficients table for 7 assets
Model Unstandardized Coefficients Standardized
Coefficients
t Sig.
B Std. Error Beta
1
(Constant) .021 .049 .420 .675
gold .173 .196 .087 .879 .381
unemployment -.009 .011 -.096 -.867 .388
bvunp .001 .001 .082 .710 .479
a. Dependent Variable: unp
Table B 1 Coefficients of UNP factor model
Model Unstandardized Coefficients Standardized
Coefficients
t Sig.
B Std. Error Beta
1
(Constant) -.038 .103 -.375 .708
gold .566 .436 .126 1.299 .197
unemployment .035 .022 .159 1.559 .122
bvaapl -.021 .010 -.213 -2.007 .047
a. Dependent Variable: aapl
Table B 2 Coefficients of AAP factor model
78. 66
Model Unstandardized Coefficients Standardized
Coefficients
t Sig.
B Std. Error Beta
1
(Constant) .137 .129 1.062 .291
gold .479 .557 .086 .860 .392
unemployment -.013 .027 -.049 -.492 .624
artcbv -.007 .008 -.098 -.924 .357
a. Dependent Variable: artc
Table B 3 Coefficients of ARTC factor model
Model Unstandardized Coefficients Standardized
Coefficients
t Sig.
B Std. Error Beta
1
(Constant) .001 .036 .026 .979
gold -.084 .148 -.057 -.564 .574
unemployment .000 .007 .006 .064 .949
bvxom .001 .002 .041 .391 .696
a. Dependent Variable: xom
Table B 4 Coefficients of XOM factor model
79. 67
Table B 5 Coefficients of PNBC factor model
Model Unstandardized Coefficients Standardized
Coefficients
t Sig.
B Std. Error Beta
1
(Constant) .034 .131 .262 .794
gold -.073 .264 -.027 -.278 .781
unemployment -.005 .017 -.039 -.302 .763
bving .001 .004 .016 .125 .900
a. Dependent Variable: ing
Table B 6 Coefficients of ING factor model
Model Unstandardized Coefficients Standardized
Coefficients
t Sig.
B Std. Error Beta
1
(Constant) -.041 .043 -.953 .343
gold .126 .183 .070 .692 .491
unemployment .013 .010 .154 1.387 .168
bvpnbc -.001 .003 -.043 -.366 .715
a. Dependent Variable: pnbc
80. 68
Model Unstandardized Coefficients Standardized
Coefficients
t Sig.
B Std. Error Beta
1
(Constant) .054 .047 1.144 .255
gold .058 .204 .029 .285 .776
unemployment -.004 .010 -.044 -.430 .668
bvwfc -.001 .002 -.083 -.761 .449
a. Dependent Variable: wfc
Table B 7 Coefficients of WFC factor model
81. 69
Bibliography
Ahmed, M., & Kwon, C. (2012). Pricing game of online display advertisement publishers. European
Journal of Operational Research , 477-487.
Artzner, P., Delbaen, F., Eber, J., & Heath, D. (1999). Coherent Measure of Risk. Mathematical
Finance , 9, 203-228.
Artzner, P., Delbaen, F., Eber, J., & Heath, D. (1997). Thinking Coherently. Risk , 10, 68-71.
Beightler, C., Phillips, D., & Wilde, D. (1979). Foundations of Optimization (2nd Edition ed.).
Englewood Cliffs, NJ, USA: Prentice Hall.
Burghardt, M. (2008). An Experiment on Investor Behavior in Markets with Nonlinear Transaction
Fees. In M. Burghardt, Negotiation, Auctions, and Market Engineering (Vol. 2, pp. 150-163).
Springer Berlin Heidelberg.
Chen, N., Roll, R., & Ross, S. (1986). Economic Forces and the Stock Market. Journal of Business ,
59, 383-403.
Diwekar, U. (2008). Introduction To Applied Optimization (Second Edition ed.). Clarendon Hills, IL,
USA: Springer Science+Business Media, LLC.
Fama, E., & French, K. (1993). Common Risk Factors in the Returns on Stocks and Bonds. Journal
of Financial Economics , 33, 3-56.
Fama, E., & French, K. (1992). The Cross-Section of Expected Stock Returns. Journal of Finance ,
47, 427-465.
Google Inc. (2012). Google Adwords Help. Retrieved from Google Adwords Help:
http://support.google.com/adwords/bin/answer.py?hl=en&answer=2472725
Hanafizadeh, P. (2012). Online Advertising and Promotion: Modern Technologies For Marketing. Igi
Global.
Hanafizadeh, P., & Ponnambalam, K. (2009). Asset allocation using reliability method. Mathematical
and Computer Modelling , 50, 21-31.
Harvey, C. (2009). Campbell R. Harvey's Hypertextual Finance Glossary. Retrieved from
http://www3.thestar.com/static/Business/glossary/bfglosf.htm
HKUST. (n.d.). Mean-variance portfolio theory. Retrieved from Mean-variance portfolio theory:
www.math.ust.hk/ maykwok/courses/ma362/Topic2.pdf
IAB Canada. (2012). 2010 Actual + 2011 Estimated Canadian Online Advertising Revenue Survey
Detailed Report. Toronto.
82. 70
Krokhmal, P., Palmquist, J., & Uryasev, S. (1999). Portfolio Optimization with Conditional Value-at-
Risk Objective and Constraints. Retrieved from
http://www.engineering.uiowa.edu/~krokhmal/pdf/cvar.pdf
Markowitz, H. (1952). Portfolio Selection. The Journal of Finance , 7, 77-91.
Quaranta, A., & Zaffaroni, A. (2008). Robust optimization of conditional value at risk and portfolio
selection. Journal of Banking & Finance , 32.
Rockafellar, R., & Uryasev, S. (2000). Optimization of conditional value-at-risk. Journal of Risk , 2,
21-41.
Roels, G., & Fridgeirsdottir, K. (2009). Dynamic revenue management for online display advertising.
Journal of Revenue and pricing management , 452-466.
Seifi, A., Ponnambalam, K., & Vlach, J. (1999). Probabilistic Design of Integrated Circuits with
Correlated Input Parameters. IEEE .
Sharpe, W. (n.d.). Linear factor Models. Retrieved from
http://www.stanford.edu/~wfsharpe/mia/fac/mia_fac2.htm#A Generic Linear Factor Model
Sharpe, W. (n.d.). Linear Factor Models. Retrieved from
http://www.stanford.edu/~wfsharpe/mia/fac/mia_fac2.htm#Matrix Representations of Factor Models
Sharpe, W. (2012). The need for factor models. Retrieved from
http://www.stanford.edu/~wfsharpe/mia/fac/mia_fac1.htm
Stubbs, R. (2012). Factor Alignment Problems in Optimized Portfolio Construction. Industry-
Academic Workshop on Optimization in Finance and Risk Management.
Wiki. (2012). Cost Per Action. Retrieved from Wikipedia:
http://en.wikipedia.org/wiki/Cost_per_action
Wiki. (n.d.). Cost Per Impression. Retrieved from wikipedia:
http://en.wikipedia.org/wiki/Cost_per_impression
Wiki. (2012). Pay Per Click. Retrieved from Wikipedia: http://en.wikipedia.org/wiki/Pay_per_click
Yahoo. (n.d.). Yahoo! Finance. Retrieved from Yahoo! Finance: ca.finance.yahoo.com
Yang, J., Vee, E., Vassilvitskii, S., Tomlin, ,., Shanmugasundaram, J., Anastasakos, T., et al. (2010).
Inventory Allocation For Online Graphical Display Advertising. Technical Report, YAHOO! LABS.
Zhu, L., Coleman, T., & Li, Y. (2009). Min-Max Robust and CVaR Robust Mean-Variance
Portfolios. The Journal of Risk , 11, 1-31.