

Recomendados
Recomendados
Mais conteúdo relacionado
Mais procurados
Mais procurados (15)
Destaque
Destaque (20)
Semelhante a Bharti airtel ratios
Semelhante a Bharti airtel ratios (20)
Último
Último (20)
Bharti airtel ratios
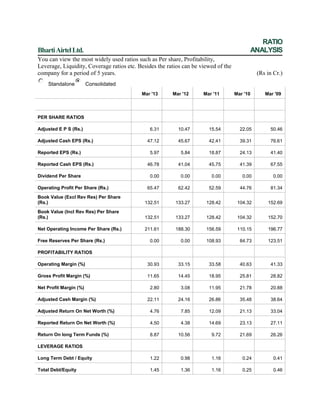
- 1. RATIO ANALYSIS Bharti Airtel Ltd. You can view the most widely used ratios such as Per share, Profitability, Leverage, Liquidity, Coverage ratios etc. Besides the ratios can be viewed of the company for a period of 5 years. Standalone (Rs in Cr.) Consolidated Mar '13 Mar '12 Mar '11 Mar '10 Mar '09 6.31 10.47 15.54 22.05 50.46 47.12 45.67 42.41 39.31 76.61 5.97 5.84 18.87 24.13 41.40 46.78 41.04 45.75 41.39 67.55 0.00 0.00 0.00 0.00 0.00 65.47 62.42 52.59 44.76 81.34 Book Value (Excl Rev Res) Per Share (Rs.) 132.51 133.27 128.42 104.32 152.69 Book Value (Incl Rev Res) Per Share (Rs.) 132.51 133.27 128.42 104.32 152.70 Net Operating Income Per Share (Rs.) 211.61 188.30 156.59 110.15 196.77 0.00 0.00 108.93 84.73 123.51 Operating Margin (%) 30.93 33.15 33.58 40.63 41.33 Gross Profit Margin (%) 11.65 14.45 18.95 25.81 28.82 2.80 3.08 11.95 21.78 20.88 22.11 24.16 26.86 35.48 38.64 Adjusted Return On Net Worth (%) 4.76 7.85 12.09 21.13 33.04 Reported Return On Net Worth (%) 4.50 4.38 14.69 23.13 27.11 Return On long Term Funds (%) 8.87 10.56 9.72 21.69 26.26 Long Term Debt / Equity 1.22 0.98 1.16 0.24 0.41 Total Debt/Equity 1.45 1.36 1.16 0.25 0.46 PER SHARE RATIOS Adjusted E P S (Rs.) Adjusted Cash EPS (Rs.) Reported EPS (Rs.) Reported Cash EPS (Rs.) Dividend Per Share Operating Profit Per Share (Rs.) Free Reserves Per Share (Rs.) PROFITABILITY RATIOS Net Profit Margin (%) Adjusted Cash Margin (%) LEVERAGE RATIOS
- 2. Owners fund as % of total Source 40.81 42.30 46.26 79.38 68.19 0.64 0.61 0.73 0.61 0.67 Current Ratio 0.59 0.62 0.44 0.67 0.64 Current Ratio (Inc. ST Loans) 0.43 0.38 0.44 0.65 0.59 Quick Ratio 0.44 0.47 0.32 0.67 0.63 724.61 546.68 278.01 864.48 388.00 19.59 19.90 6.15 4.84 5.65 2.50 2.83 2.54 2.82 3.46 Earning Retention Ratio 81.47 88.90 92.52 94.70 95.37 Cash Earnings Retention Ratio 97.52 97.46 97.26 97.03 96.95 Adjusted Cash Flow Time Total Debt 4.08 3.98 3.52 0.68 0.92 Financial Charges Coverage Ratio 5.14 5.87 8.07 22.39 24.89 Fin. Charges Cov.Ratio (Post Tax) 4.59 4.82 7.85 21.42 21.31 Material Cost Component(% earnings) 0.00 0.00 1.37 0.09 0.21 Selling Cost Component 0.00 0.00 0.00 6.66 6.58 Exports as percent of Total Sales 0.00 0.00 0.00 0.23 0.69 Import Comp. in Raw Mat. Consumed 0.00 0.00 0.00 0.00 0.00 Long term assets / Total Assets 0.76 0.76 0.79 0.82 0.79 82.49 82.49 82.49 82.49 82.51 Fixed Assets Turnover Ratio LIQUIDITY RATIOS Inventory Turnover Ratio PAYOUT RATIOS Dividend payout Ratio (Net Profit) Dividend payout Ratio (Cash Profit) COVERAGE RATIOS COMPONENT RATIOS Bonus Component In Equity Capital (%)