1. 1 | P a g e
Aashish Mishra, SSA, UN DESA OESC, aashmishra@nyu.edu
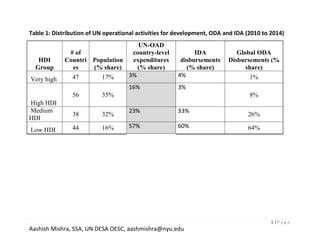
Table 1: Distribution of UN operational activities for development, ODA and IDA (2010 to 2014)
HDI
Group
# of
Countri
es
Population
(% share)
UN-OAD
country-level
expenditures
(% share)
IDA
disbursements
(% share)
Global ODA
Disbursements (%
share)
Very high 47 17% 3% 4% 1%
High HDI
56 35%
16% 3%
8%
Medium
HDI
38 32%
23% 33%
26%
Low HDI 44 16% 57% 60% 64%
2. 2 | P a g e
Aashish Mishra, SSA, UN DESA OESC, aashmishra@nyu.edu
Table 2: UN-OAD Expenditures per capita (2010 to 2014)
HDI Group
Average annual
expenditures
($US Million)
Population
(billions)
Expenditures per capita
($US per person)
Average for
group
High outliers
Low outliers
Very High $ 567 1.17 0.48 Argentina 7.32
Cyprus 20.20
Montenegro 22.98
Liechtenstein 210.39
Norway 0.02
United
States
0.02
Portugal 0.03
United
Kingdom
0.03
High HDI $2,833 2.45 1.15 Samoa 50.73
Mauritius 57.56
Jordan 64.75
Lebanon 91.11
Mexico 0.09
China 0.12
Russian
Federation
0.33
Romania 0.45
Medium HDI $ 4,055 2.24 1.80 Syrian Arab
Republic
21.76
Bhutan 24.25
Timor0Leste 46.99
Micronesia
(Federated
States of)
671.27
India 0.21
Indonesia 0.68
Viet Nam 1.11
Uzbekistan 1.11
Low HDI $ 10,051 1.14 8.82 Liberia 35.38
South Sudan 41.05
Afghanistan 42.42
Djibouti 47.93
Nigeria 2.02
Myanmar 3.25
Tanzania 3.36
Angola 3.43
3. 3 | P a g e
Aashish Mishra, SSA, UN DESA OESC, aashmishra@nyu.edu
Table 3: Mean UN-ODA Outliers with HDI, ODA and IDA Disbursements
Outlier Mean UN-OAD with ODA and IDA Disbursements Per Capita 2010-2014 (USD)
HDI UN_OAD
%
UN_OAD
Total ODA
%
ODA
Total IDA
% IDA
Total
Very
High HDI
Mean 0.87 0.48 3% 0.59 1% 0.28 4%
High
Outliers
Chile
0.82 1.39 0.1% 4.31 0.01
Croatia
0.81 2.94 0.1% 8.59 5.79
Argentina
0.83 7.32 2% 1.62
Montenegro
0.80 22.98 0.1% 58.06 80.46
Low
Outliers
France
0.89 0.05 .05% 1.02 0.08%
Slovenia
0.88 0.20 .02% 1.68 0.04
Spain
0.87 0.22 0.02% 5.61 0.30%
Belgium
0.89 0.33 .03% 0.83 0.01%
High HDI Mean 0.75 1.15 15% 2.97 8% 0.00
3%
High
Outliers
Maldives
0.70 29.72 0.1% 50.56 0.02% 16.70 0.08%
Palau
0.77 39.77 0.004% 1201.05 0.03% 0.11%
Mauritius
0.77 57.56 0.4% 17.02 0.91% 0.39 0.01%
Jordan
0.75 64.75 2.2% 125.49 0.42% 0.32 0.03%
Low Mexico
0.75 0.09 0% 3.11 0.44%
4. 4 | P a g e
Aashish Mishra, SSA, UN DESA OESC, aashmishra@nyu.edu
Outliers China
0.71 0.12 1% 0.67 1.04% 0.62 ######
Thailand
0.72 0.82 0% 2.89 0.22% 0.18 0.15%
Ukraine
0.74 0.94 0% 8.94 0.47% 0.03 0.02%
Medium
HDI
Mean 0.62 1.80 22% 9.92 26% 0.03 35%
High
Outliers
Congo
0.57 15.14 0.4% 351.79 0.4% 5.04 0.27%
Syrian Arab
Republic
0.62 21.76 2.5% 835.82 1.0% 0.02 0.01%
Bhutan
0.60 24.25 0.1% 58.01 0.1% 22.83 0.21%
Timor Leste
0.64 46.99 0.3% 218.69 0.3% 4.29 0.06%
Low
Outliers
India
0.60 0.21 1.5% 0.70 1.0% 0.30 4.75%
Indonesia
0.68 0.68 0.9% 4.68 1.3% 0.33 1.04%
Viet Nam
0.66 1.11 0.5% 9.68 1.0% 12.12 ######
Uzbekistan
0.67 1.11 0.2% 2.50 0.1% 1.78 0.66%
Low HDI Mean 0.47 8.82 55% 48.92 64% 0.12 65%
High
Outliers
Liberia
0.42 115.79 0.8% 13.82 0.55% 13.82 0.72%
South Sudan
0.46 76.38 2.5% 0.55 0.96% 0.55 0.08%
Afghanistan
0.46 171.43 6.9% 5.47 5.86% 5.47 2.04%
Djibouti
0.46 101.84 0.2% 4.47 0.10% 4.47 0.05%
5. 5 | P a g e
Aashish Mishra, SSA, UN DESA OESC, aashmishra@nyu.edu
Low
Outliers
Nigeria
0.50 2.02 1.8% 5.55 1.1% 4.21 8.86%
Myanmar
0.53 3.25 0.9% 26.15 1.6% 0.34 0.22%
Tanzania
0.51 3.36 0.9% 33.81 1.9% 11.45 6.97%
Angola
0.52 3.43 0.4% 0.04 0.001% 1.18 0.33%