Hispanic Heritage Month Data Overview

25 Largest Combined Statistical Area (CSA) Shares of Race/ Ethnicity: 2020 Census
Hispanic/ Latinx share of the Atlanta CSA’s population is at 12.2% for the 2020 Census, surging from just over 6 percent at the time of
the 2000 Census. However, this share is fairly low (the 10th lowest) when ranked against the comparable shares in the other 24
largest combined statistical areas (based on 2020 Census populations). Note: The Atlanta CSA is larger than the 29-county MSA, and
includes the Gainesville and Cartersville areas.
Change in Population by Race/ Ethnicity 25 Largest CSAs: 2020 Census
Hispanic/ Latinx population increased in each of the 25 largest CSAs 2010-2020, while White Non-Hispanic population declined in eight of
the CSAs. Hispanic increase led race/ ethnicity categories in net increase in 14 of the 25 CSAs. In Atlanta, the Black population grew
substantially faster, and Asian and multiracial growth approached absolute increase for Hispanic/ Latinx.
2020 Census Race/Ethnicity Totals: State of Georgia and Subareas
Hispanic/ Latinx concentration as of the 2020 Census is significantly higher in the Atlanta MSA (at 12% of
total population) than in the rest of the state of Georgia (at 8.2%). Hispanic/ Latinx share of the five core
counties was highest among the “larger than county” aggregations, at 14%. At the county level, nearly 1 in 4
Gwinnett residents reported as Hispanic/ Latinx. The City of Atlanta (at 6%) and Henry County (at 7.7%) have
the lowest Hispanic shares among ARC jurisdictions.
2020 Public School Enrollment by District: 13-County Atlanta Area
So we just saw that Hispanic/ Latinx population represents healthy shares of total populations of counties in the Atlanta area. And
yet the shares are significantly higher—in each area—when the public school enrollment is assessed. Hispanic/ Latinx children are
more than 1 in 5 of all October, 2020 enrollees in Marietta and Buford City, as well as in Gwinnett, Clayton, Cobb, and Cherokee
County public schools. Only Decatur and Atlanta City schools have less than 10% Hispanic/ Latinx students.
Change in Population by Race/Ethnicity Totals: 2010-20: State of Georgia and Subareas
Hispanic/ Latinx populations accounted for more than 1 in 5 of net new persons in the 11-county region between 2010 and
2020. In Gwinnett County, nearly 4 of 10 net new residents 2010-2020 was Hispanic/ Latino, and over 1 in 3 were such in
Cobb County. In the state outside the Atlanta MSA, with many counties declining in size overall 2010-20, Hispanic population
was the group that provided the second largest source of population increase. Only in Fulton County as a whole, driven by
low inflow of Hispanics to the City of Atlanta, were fewer than 1 in 10 of net new residents Hispanic. While only the City of
Atlanta and Cherokee added white, non-Hispanic populations, every jurisdiction added Hispanic/ Latinx.
Percentage Increase, 2010-2020 by Race/ Ethnicity: 11-County Area
As noted on the prior slide, Hispanic/ Latinx populations grew in every 11-county jurisdiction from 2010-2020, surging by
more than 50 percent in Cherokee, Forsyth, and Henry Counties. These areas were (in 2010) some of the area with the
lowest shares of Hispanic population overall, and remain so—even with the rapid increases of the last decade—in 2020. In
Cherokee County, Hispanic populations grew faster than any othere race/ ethnic group. In most others, percentage increases
trailed those of Asian, non-Hispanic and Mom-Hispanic, Other (including multiracial).
Percentage Point Increases in Race/ Etnhnicity Shares, 2010-2020: Comparative Areas
Hispanic populations (blue shading) increased their share of population in every area analyzed above, and by the most in
Gwinnett County (3 percent) . But in all areas, other race/ ethnic growup gained more population share than did Hispanic/
Latjinx—an indication that while growth is very strong, it is beginning to slow in a relative sense over the past decade.
Hispanic Latino Foreign-Born Population by Country, 2019 ACS
Those born in Mexico made up just over 1 of every 2 Hispanic foreign-born in the 11-county region in 2019. This is
actually lower than the over 6 in 10 for the rest of the state outside of the Atlanta MSA. An even hgher share of the
state’s Central Americans reside in the Atlanta MSA.
Change 2010-2019: Hispanic/Latino Foreign-Born Population by Country, 2010-19 ACS
Growth rates 2010-2019 for those born in Mexico, however, were much lower than for those born in many other
Hispanic/ Latinx countries. Increases for the Puerto Rican, Dominican and Venezuelan populations in the Atlanta
metro and state are more notable over the period. Venezuelan and Dominican increase is overwhelmingly within the
Atlanta MSA. Growth in the Cuban and Salvadoran, as well as Mexican population, is almost as strong outside the
Atlanta metro (in Georgia) as within it.
Diving down to the census tract level, we see more detail on the 2020 concentrations of Hispanic populations
along the Buford Highway corridor through north-central Gwinnett, in the northern part of Clayton County, and in
cities of Cobb County and Cherokee County. Source: DataNexus at neighborhoodnexus.org
Share of Hispanic Population by Census Tract: 11-County ARC Region, 2020 Census
Numeric Change in Hispanic Population by Census Tract: 11-County ARC Region, 2010- 2020
Absolute increase of Hispanic populations 2010-2020 is indicative of the wide spatial spread of diversity in the
region. Almost all tracts in Gwinnett have added Hispanic persons, as well as all but a few in Cobb. And it’s notable
that, even though shares of Hispanic population in the south of the region remain fairly low, absolute increases
2010-2020 have been strong in that portion of Atlanta. (Source: DataNexus at neighborhoodnexus.org)
Percentage Point Change in Hispanic Popby Census Tract: 11-County ARC Region, 2010- 2020
Source: DataNexus at neighborhoodnexus.org
Looking at (Census Bureau) Long-Range National Forecasts, by Race/ Ethnicity and Age
So what is coming? More growth in our Hispanic population, as an element of this century’s explosion of racial and ethnic
diversity. In the last national forecast by race/ethnicity and age done in 2017, Hispanic/ Latino population is projected to
grow more than three times faster than the population as a whole from 2020-2040, then a little over three times faster
over the last 20 years of the forecast horizon (2040-2060). And though Hispanics in 2060 continue to represent a larger
share of the population as a whole (at 27.5%) than the 65+ segment (21%), the Hispanic 65+ population is expected to
increase four times over by 2060.
ARC Series 16 Forecast: 2015 and 2050 Race/ Ethnicity Shares
Our forecast Series 16 baseline year is 2015, and Hispanic population made up only 11.6% of our 21-
county modeling area’s population at that time. By 2050, we forecast that that share will be 21.4%, or
that over 1 in 5 people in the general Atlanta area will be of Hispanic/ Latinx ethnicity.
A Reprise: 2020 Public School Enrollments by District: Race/ Ethnicity Shares
And to remind you about a slide we showed you earlier—locally, the “leading edge” of this increase in Hispanic share
is visible in our 2020 public school enrollments .
The Details!
Hispanic/ Latino Forecasts:
ARC Series 16
2015-2050
ARC forecasts that
Hispanic population
will increase nearly
three times over,
across our 21-
county modeling
area, between
2015-50. Gwinnett
will again be a
leader, matched by
significant gains in
Fulton and Forsyth.
https://33n.atlantaregional.com/arc-series-16-forecast
1 de 16

Recomendados

Regional Snapshot: Metro Atlanta's Hispanic and Latino Community por
Regional Snapshot: Metro Atlanta's Hispanic and Latino CommunityRegional Snapshot: Metro Atlanta's Hispanic and Latino Community
Regional Snapshot: Metro Atlanta's Hispanic and Latino CommunityARCResearch
2.8K visualizações25 slides
Hispanic heritage month 1-population por
Hispanic heritage month 1-populationHispanic heritage month 1-population
Hispanic heritage month 1-populationARCResearch
434 visualizações7 slides
Latino Profiles por
Latino ProfilesLatino Profiles
Latino ProfilesInstituto Diáspora Brasil (IDB)
166 visualizações72 slides
FY17 population report HCAD por
FY17 population report HCADFY17 population report HCAD
FY17 population report HCADcutmytaxes
53 visualizações5 slides
2018 State of the Community Report Presentation por
2018 State of the Community Report Presentation2018 State of the Community Report Presentation
2018 State of the Community Report PresentationThe Chamber For a Greater Chapel Hill-Carrboro
1.3K visualizações231 slides
Puerto Ricans - 2017 por
Puerto Ricans - 2017Puerto Ricans - 2017
Puerto Ricans - 2017Instituto Diáspora Brasil (IDB)
98 visualizações12 slides

Mais conteúdo relacionado

Mais procurados

Boston's Latino Population por
Boston's Latino PopulationBoston's Latino Population
Boston's Latino PopulationInstituto Diáspora Brasil (IDB)
797 visualizações20 slides
Boston's Shifting Demographics por
Boston's Shifting Demographics Boston's Shifting Demographics
Boston's Shifting Demographics Instituto Diáspora Brasil (IDB)
2K visualizações68 slides
Our Shared Future: Charting a Path for Immigrant Advancement in a New Politic... por
Our Shared Future: Charting a Path for Immigrant Advancement in a New Politic...Our Shared Future: Charting a Path for Immigrant Advancement in a New Politic...
Our Shared Future: Charting a Path for Immigrant Advancement in a New Politic...Instituto Diáspora Brasil (IDB)
114 visualizações37 slides
Trends in the Atlanta Region and Buckhead — Demographics and Growth Seminar –... por
Trends in the Atlanta Region and Buckhead — Demographics and Growth Seminar –...Trends in the Atlanta Region and Buckhead — Demographics and Growth Seminar –...
Trends in the Atlanta Region and Buckhead — Demographics and Growth Seminar –...Livable Buckhead / BATMA
1.5K visualizações105 slides
The Diversity Explosion por
The Diversity ExplosionThe Diversity Explosion
The Diversity ExplosionBrookings Metropolitan Policy Program
4.1K visualizações23 slides
Racial wealth snapshot: latino americans | prosperity now por
Racial wealth snapshot: latino americans | prosperity nowRacial wealth snapshot: latino americans | prosperity now
Racial wealth snapshot: latino americans | prosperity nowJoseMacias86
257 visualizações8 slides

Mais procurados(18)

Our Shared Future: Charting a Path for Immigrant Advancement in a New Politic... por Instituto Diáspora Brasil (IDB)
Our Shared Future: Charting a Path for Immigrant Advancement in a New Politic...Our Shared Future: Charting a Path for Immigrant Advancement in a New Politic...
Our Shared Future: Charting a Path for Immigrant Advancement in a New Politic...
Instituto Diáspora Brasil (IDB)114 visualizações
Trends in the Atlanta Region and Buckhead — Demographics and Growth Seminar –... por Livable Buckhead / BATMA
Trends in the Atlanta Region and Buckhead — Demographics and Growth Seminar –...Trends in the Atlanta Region and Buckhead — Demographics and Growth Seminar –...
Trends in the Atlanta Region and Buckhead — Demographics and Growth Seminar –...
Livable Buckhead / BATMA1.5K visualizações
Racial wealth snapshot: latino americans | prosperity now por JoseMacias86
Racial wealth snapshot: latino americans | prosperity nowRacial wealth snapshot: latino americans | prosperity now
Racial wealth snapshot: latino americans | prosperity now
JoseMacias86257 visualizações
Demography of Texas with Dr. Lloyd Potter por Greenlights
Demography of Texas with Dr. Lloyd PotterDemography of Texas with Dr. Lloyd Potter
Demography of Texas with Dr. Lloyd Potter
Greenlights1.4K visualizações
2018 State of Hispanic Homeownership Report by NAHREP GREATER LAS VEGAS por Jesse B. Lucero
2018 State of Hispanic Homeownership Report by NAHREP GREATER LAS VEGAS 2018 State of Hispanic Homeownership Report by NAHREP GREATER LAS VEGAS
2018 State of Hispanic Homeownership Report by NAHREP GREATER LAS VEGAS
Jesse B. Lucero 8 visualizações
Why politics and people are at antipodes in india por Shantanu Basu
Why politics and people are at antipodes in indiaWhy politics and people are at antipodes in india
Why politics and people are at antipodes in india
Shantanu Basu256 visualizações
Brazilians in the U.S. and Massachusetts: A Demographic and Economic Profile por Instituto Diáspora Brasil (IDB)
Brazilians in the U.S. and Massachusetts:  A Demographic and Economic ProfileBrazilians in the U.S. and Massachusetts:  A Demographic and Economic Profile
Brazilians in the U.S. and Massachusetts: A Demographic and Economic Profile
Instituto Diáspora Brasil (IDB)502 visualizações
Brazil report por José Rodrigues
Brazil reportBrazil report
Brazil report
José Rodrigues271 visualizações

Similar a Hispanic Heritage Month Data Overview

2014-15 Hispanic Demographic Trends Report por
2014-15 Hispanic Demographic Trends Report2014-15 Hispanic Demographic Trends Report
2014-15 Hispanic Demographic Trends ReportLeland T. Holcomb
264 visualizações13 slides
Hispanic Market Presentation 2015 7.23.15 por
Hispanic Market Presentation 2015 7.23.15Hispanic Market Presentation 2015 7.23.15
Hispanic Market Presentation 2015 7.23.15Rebecca Lambert
1.4K visualizações35 slides
Latino Profile - Merged por
Latino Profile - Merged Latino Profile - Merged
Latino Profile - Merged Instituto Diáspora Brasil (IDB)
58 visualizações72 slides
Austin Tx Demographics - Census 2010 por
Austin Tx Demographics - Census 2010Austin Tx Demographics - Census 2010
Austin Tx Demographics - Census 2010Kristen Carney
1.3K visualizações78 slides
The Hispanic American Market Report 2019 por
The Hispanic American Market Report 2019The Hispanic American Market Report 2019
The Hispanic American Market Report 2019Depo Consulting
836 visualizações17 slides
Geoscape Market Snapshot of the Charleston, South Carolina DMA por
Geoscape Market Snapshot of the Charleston, South Carolina DMA Geoscape Market Snapshot of the Charleston, South Carolina DMA
Geoscape Market Snapshot of the Charleston, South Carolina DMA Maria Padron
304 visualizações5 slides

Similar a Hispanic Heritage Month Data Overview(20)

2014-15 Hispanic Demographic Trends Report por Leland T. Holcomb
2014-15 Hispanic Demographic Trends Report2014-15 Hispanic Demographic Trends Report
2014-15 Hispanic Demographic Trends Report
Leland T. Holcomb264 visualizações
Hispanic Market Presentation 2015 7.23.15 por Rebecca Lambert
Hispanic Market Presentation 2015 7.23.15Hispanic Market Presentation 2015 7.23.15
Hispanic Market Presentation 2015 7.23.15
Rebecca Lambert1.4K visualizações
Austin Tx Demographics - Census 2010 por Kristen Carney
Austin Tx Demographics - Census 2010Austin Tx Demographics - Census 2010
Austin Tx Demographics - Census 2010
Kristen Carney1.3K visualizações
The Hispanic American Market Report 2019 por Depo Consulting
The Hispanic American Market Report 2019The Hispanic American Market Report 2019
The Hispanic American Market Report 2019
Depo Consulting 836 visualizações
Geoscape Market Snapshot of the Charleston, South Carolina DMA por Maria Padron
Geoscape Market Snapshot of the Charleston, South Carolina DMA Geoscape Market Snapshot of the Charleston, South Carolina DMA
Geoscape Market Snapshot of the Charleston, South Carolina DMA
Maria Padron304 visualizações
Geoscape Market Snapshot of Charleston, South Carolina por Maria Padron
Geoscape Market Snapshot of Charleston, South CarolinaGeoscape Market Snapshot of Charleston, South Carolina
Geoscape Market Snapshot of Charleston, South Carolina
Maria Padron178 visualizações
Latino heritage month: economic inequality and latinos | prosperity now por JoseMacias86
Latino heritage month: economic inequality and latinos | prosperity nowLatino heritage month: economic inequality and latinos | prosperity now
Latino heritage month: economic inequality and latinos | prosperity now
JoseMacias86219 visualizações
According to the 2010 Census, the number of Hispanics in the US has increased. por Alcance Media Group
According to the 2010 Census, the number of Hispanics in the US has increased.According to the 2010 Census, the number of Hispanics in the US has increased.
According to the 2010 Census, the number of Hispanics in the US has increased.
Alcance Media Group491 visualizações
Creció el número de hispanos en EE.UU. Según el censo 2010 por Alcance Media Group
Creció el número de hispanos en EE.UU. Según el censo 2010Creció el número de hispanos en EE.UU. Según el censo 2010
Creció el número de hispanos en EE.UU. Según el censo 2010
Alcance Media Group405 visualizações
Current issues and trends por leofolds
Current issues and trendsCurrent issues and trends
Current issues and trends
leofolds362 visualizações
The Changing Face of lincoln por Jon Swanson
The Changing Face of lincolnThe Changing Face of lincoln
The Changing Face of lincoln
Jon Swanson105 visualizações
wh_hispanic_action_summits_report por Paul Berumen
wh_hispanic_action_summits_reportwh_hispanic_action_summits_report
wh_hispanic_action_summits_report
Paul Berumen185 visualizações
LatinCon: Future of Spanish Media in US 2014-AdrianaPeña por Adriana Peña Johansson
LatinCon: Future of Spanish Media in US 2014-AdrianaPeñaLatinCon: Future of Spanish Media in US 2014-AdrianaPeña
LatinCon: Future of Spanish Media in US 2014-AdrianaPeña
Adriana Peña Johansson884 visualizações
Color Of Cuts por Jeff Cravy
Color Of CutsColor Of Cuts
Color Of Cuts
Jeff Cravy353 visualizações
LDC 2016 Fact Book por William Fernandez
LDC 2016 Fact BookLDC 2016 Fact Book
LDC 2016 Fact Book
William Fernandez81 visualizações
Powering Greater Boston's Economy - Why the Latino Community Is Critical to o... por Instituto Diáspora Brasil (IDB)
Powering Greater Boston's Economy - Why the Latino Community Is Critical to o...Powering Greater Boston's Economy - Why the Latino Community Is Critical to o...
Powering Greater Boston's Economy - Why the Latino Community Is Critical to o...
Instituto Diáspora Brasil (IDB)123 visualizações

Mais de ARCResearch

Regionalsnapshot_HealthDisparities_Oct2023 por
Regionalsnapshot_HealthDisparities_Oct2023Regionalsnapshot_HealthDisparities_Oct2023
Regionalsnapshot_HealthDisparities_Oct2023ARCResearch
69 visualizações22 slides
MAS 2023 SORB Slides Final.pdf por
MAS 2023 SORB Slides Final.pdfMAS 2023 SORB Slides Final.pdf
MAS 2023 SORB Slides Final.pdfARCResearch
535 visualizações13 slides
COLI snapshot por
COLI snapshotCOLI snapshot
COLI snapshotARCResearch
254 visualizações17 slides
2023 Population Estimates: ARC Region por
2023 Population Estimates: ARC Region2023 Population Estimates: ARC Region
2023 Population Estimates: ARC RegionARCResearch
705 visualizações9 slides
Housing Snapshot Final June30 2023df por
Housing Snapshot Final June30 2023dfHousing Snapshot Final June30 2023df
Housing Snapshot Final June30 2023dfARCResearch
456 visualizações22 slides
test2 por
test2test2
test2ARCResearch
170 visualizações2 slides

Mais de ARCResearch(20)

Regionalsnapshot_HealthDisparities_Oct2023 por ARCResearch
Regionalsnapshot_HealthDisparities_Oct2023Regionalsnapshot_HealthDisparities_Oct2023
Regionalsnapshot_HealthDisparities_Oct2023
ARCResearch69 visualizações
MAS 2023 SORB Slides Final.pdf por ARCResearch
MAS 2023 SORB Slides Final.pdfMAS 2023 SORB Slides Final.pdf
MAS 2023 SORB Slides Final.pdf
ARCResearch535 visualizações
COLI snapshot por ARCResearch
COLI snapshotCOLI snapshot
COLI snapshot
ARCResearch254 visualizações
2023 Population Estimates: ARC Region por ARCResearch
2023 Population Estimates: ARC Region2023 Population Estimates: ARC Region
2023 Population Estimates: ARC Region
ARCResearch705 visualizações
Housing Snapshot Final June30 2023df por ARCResearch
Housing Snapshot Final June30 2023dfHousing Snapshot Final June30 2023df
Housing Snapshot Final June30 2023df
ARCResearch456 visualizações
test2 por ARCResearch
test2test2
test2
ARCResearch170 visualizações
ARC Aging Snapshot Final 2023.pdf por ARCResearch
ARC Aging Snapshot Final 2023.pdfARC Aging Snapshot Final 2023.pdf
ARC Aging Snapshot Final 2023.pdf
ARCResearch284 visualizações
100 Metros Update por ARCResearch
100 Metros Update100 Metros Update
100 Metros Update
ARCResearch649 visualizações
Economy Snapshot por ARCResearch
Economy SnapshotEconomy Snapshot
Economy Snapshot
ARCResearch156 visualizações
Migration Presentation - Final.pdf por ARCResearch
Migration Presentation - Final.pdfMigration Presentation - Final.pdf
Migration Presentation - Final.pdf
ARCResearch283 visualizações
Regional S17 Forecast Snapshot.pdf por ARCResearch
Regional S17 Forecast Snapshot.pdfRegional S17 Forecast Snapshot.pdf
Regional S17 Forecast Snapshot.pdf
ARCResearch895 visualizações
Rental presentation - with annotation.pdf por ARCResearch
Rental presentation - with annotation.pdfRental presentation - with annotation.pdf
Rental presentation - with annotation.pdf
ARCResearch130 visualizações
Cost of Living Snapshot Sept. 2022 por ARCResearch
Cost of Living Snapshot Sept. 2022Cost of Living Snapshot Sept. 2022
Cost of Living Snapshot Sept. 2022
ARCResearch229 visualizações
2022 Population Estimates ARC por ARCResearch
2022 Population Estimates ARC2022 Population Estimates ARC
2022 Population Estimates ARC
ARCResearch985 visualizações
Aging Snapshot May 2022 Final.pdf por ARCResearch
Aging Snapshot May 2022 Final.pdfAging Snapshot May 2022 Final.pdf
Aging Snapshot May 2022 Final.pdf
ARCResearch250 visualizações
Economy jan 22 snapshot web por ARCResearch
Economy jan 22 snapshot webEconomy jan 22 snapshot web
Economy jan 22 snapshot web
ARCResearch284 visualizações
Economy jan 22 snapshot web por ARCResearch
Economy jan 22 snapshot webEconomy jan 22 snapshot web
Economy jan 22 snapshot web
ARCResearch25 visualizações
Home Ownership snapshot (september 2021) v oct 1 por ARCResearch
Home Ownership snapshot (september 2021) v oct 1Home Ownership snapshot (september 2021) v oct 1
Home Ownership snapshot (september 2021) v oct 1
ARCResearch255 visualizações
Home ownership snapshot (september 2021) por ARCResearch
Home ownership snapshot (september 2021)Home ownership snapshot (september 2021)
Home ownership snapshot (september 2021)
ARCResearch137 visualizações
A First Look at Atlanta's 2020 Census Results: Counties and "Up" por ARCResearch
A First Look at Atlanta's 2020 Census Results: Counties and "Up"A First Look at Atlanta's 2020 Census Results: Counties and "Up"
A First Look at Atlanta's 2020 Census Results: Counties and "Up"
ARCResearch2.5K visualizações

Último

Dr Jean Paul Latyr FAYE - 2023 ReSAKSS Conference.pptx por
Dr Jean Paul Latyr FAYE - 2023 ReSAKSS Conference.pptxDr Jean Paul Latyr FAYE - 2023 ReSAKSS Conference.pptx
Dr Jean Paul Latyr FAYE - 2023 ReSAKSS Conference.pptxAKADEMIYA2063
6 visualizações24 slides
IEA Report: The Oil and Gas Industry in NetZero Transitions por
IEA Report: The Oil and Gas Industry in NetZero TransitionsIEA Report: The Oil and Gas Industry in NetZero Transitions
IEA Report: The Oil and Gas Industry in NetZero TransitionsEnergy for One World
10 visualizações224 slides
How can the social and solidarity economy help refugees along their journey? por
How can the social and solidarity economy help refugees along their journey?How can the social and solidarity economy help refugees along their journey?
How can the social and solidarity economy help refugees along their journey?OECD CFE
63 visualizações7 slides
Permit & Zoning Tech 2023 1116.pdf por
Permit & Zoning Tech 2023 1116.pdfPermit & Zoning Tech 2023 1116.pdf
Permit & Zoning Tech 2023 1116.pdfNorthwestBOCA
54 visualizações1 slide
Sponsor for Child Bright Future por
Sponsor for Child Bright FutureSponsor for Child Bright Future
Sponsor for Child Bright FutureSERUDS INDIA
10 visualizações1 slide
Arrow Adoption Training for Kinship Families por
Arrow Adoption Training for Kinship FamiliesArrow Adoption Training for Kinship Families
Arrow Adoption Training for Kinship FamiliesArrowMarketing
39 visualizações46 slides

Último(20)

Dr Jean Paul Latyr FAYE - 2023 ReSAKSS Conference.pptx por AKADEMIYA2063
Dr Jean Paul Latyr FAYE - 2023 ReSAKSS Conference.pptxDr Jean Paul Latyr FAYE - 2023 ReSAKSS Conference.pptx
Dr Jean Paul Latyr FAYE - 2023 ReSAKSS Conference.pptx
AKADEMIYA20636 visualizações
IEA Report: The Oil and Gas Industry in NetZero Transitions por Energy for One World
IEA Report: The Oil and Gas Industry in NetZero TransitionsIEA Report: The Oil and Gas Industry in NetZero Transitions
IEA Report: The Oil and Gas Industry in NetZero Transitions
Energy for One World10 visualizações
How can the social and solidarity economy help refugees along their journey? por OECD CFE
How can the social and solidarity economy help refugees along their journey?How can the social and solidarity economy help refugees along their journey?
How can the social and solidarity economy help refugees along their journey?
OECD CFE63 visualizações
Permit & Zoning Tech 2023 1116.pdf por NorthwestBOCA
Permit & Zoning Tech 2023 1116.pdfPermit & Zoning Tech 2023 1116.pdf
Permit & Zoning Tech 2023 1116.pdf
NorthwestBOCA54 visualizações
Sponsor for Child Bright Future por SERUDS INDIA
Sponsor for Child Bright FutureSponsor for Child Bright Future
Sponsor for Child Bright Future
SERUDS INDIA10 visualizações
Arrow Adoption Training for Kinship Families por ArrowMarketing
Arrow Adoption Training for Kinship FamiliesArrow Adoption Training for Kinship Families
Arrow Adoption Training for Kinship Families
ArrowMarketing39 visualizações
2023 Veterans Day Exhibit.pptx por lday4
2023 Veterans Day Exhibit.pptx2023 Veterans Day Exhibit.pptx
2023 Veterans Day Exhibit.pptx
lday448 visualizações
ST-15631-2023-INIT_en.pdf por Société Tripalio
ST-15631-2023-INIT_en.pdfST-15631-2023-INIT_en.pdf
ST-15631-2023-INIT_en.pdf
Société Tripalio2K visualizações
Autumn (Statement) Watch por ResolutionFoundation
Autumn (Statement) WatchAutumn (Statement) Watch
Autumn (Statement) Watch
ResolutionFoundation244 visualizações
Dr. Ousmane Badiane - 2023 ReSAKSS Conference.pptx por AKADEMIYA2063
Dr. Ousmane Badiane - 2023 ReSAKSS Conference.pptxDr. Ousmane Badiane - 2023 ReSAKSS Conference.pptx
Dr. Ousmane Badiane - 2023 ReSAKSS Conference.pptx
AKADEMIYA20636 visualizações
ecb.sp231121_1~8df317dc17.en.pdf por Société Tripalio
ecb.sp231121_1~8df317dc17.en.pdfecb.sp231121_1~8df317dc17.en.pdf
ecb.sp231121_1~8df317dc17.en.pdf
Société Tripalio409 visualizações
Creation of Policy, Ordinance, Minutes of Meeting and Activity Design for San... por AlvaroTojongDioquino
Creation of Policy, Ordinance, Minutes of Meeting and Activity Design for San...Creation of Policy, Ordinance, Minutes of Meeting and Activity Design for San...
Creation of Policy, Ordinance, Minutes of Meeting and Activity Design for San...
AlvaroTojongDioquino15 visualizações
NGO awareness programs por SERUDS INDIA
NGO awareness programsNGO awareness programs
NGO awareness programs
SERUDS INDIA8 visualizações
2023 First Tee - Greater Richmond Holiday Gift Guide por bill151498
2023 First Tee - Greater Richmond Holiday Gift Guide2023 First Tee - Greater Richmond Holiday Gift Guide
2023 First Tee - Greater Richmond Holiday Gift Guide
bill15149880 visualizações
UNiTE- Invest to Prevent Violence against Women & Girls! por Christina Parmionova
UNiTE- Invest to Prevent Violence against Women & Girls!UNiTE- Invest to Prevent Violence against Women & Girls!
UNiTE- Invest to Prevent Violence against Women & Girls!
Christina Parmionova9 visualizações
Dr Getaw Tadesse - 2023 ReSAKSS Conference .pptx por AKADEMIYA2063
Dr Getaw Tadesse - 2023 ReSAKSS Conference .pptxDr Getaw Tadesse - 2023 ReSAKSS Conference .pptx
Dr Getaw Tadesse - 2023 ReSAKSS Conference .pptx
AKADEMIYA20638 visualizações
Taking care for elders por SERUDS INDIA
Taking care for eldersTaking care for elders
Taking care for elders
SERUDS INDIA7 visualizações
Taking care of the elders por SERUDS INDIA
Taking care of the eldersTaking care of the elders
Taking care of the elders
SERUDS INDIA6 visualizações
2023-11-17-building_inspector_posting (1).pdf por NorthwestBOCA
2023-11-17-building_inspector_posting (1).pdf2023-11-17-building_inspector_posting (1).pdf
2023-11-17-building_inspector_posting (1).pdf
NorthwestBOCA54 visualizações

Hispanic Heritage Month Data Overview

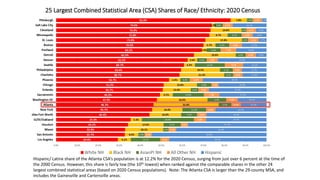
  • 1. 25 Largest Combined Statistical Area (CSA) Shares of Race/ Ethnicity: 2020 Census Hispanic/ Latinx share of the Atlanta CSA’s population is at 12.2% for the 2020 Census, surging from just over 6 percent at the time of the 2000 Census. However, this share is fairly low (the 10th lowest) when ranked against the comparable shares in the other 24 largest combined statistical areas (based on 2020 Census populations). Note: The Atlanta CSA is larger than the 29-county MSA, and includes the Gainesville and Cartersville areas.
  • 2. Change in Population by Race/ Ethnicity 25 Largest CSAs: 2020 Census Hispanic/ Latinx population increased in each of the 25 largest CSAs 2010-2020, while White Non-Hispanic population declined in eight of the CSAs. Hispanic increase led race/ ethnicity categories in net increase in 14 of the 25 CSAs. In Atlanta, the Black population grew substantially faster, and Asian and multiracial growth approached absolute increase for Hispanic/ Latinx.
  • 3. 2020 Census Race/Ethnicity Totals: State of Georgia and Subareas Hispanic/ Latinx concentration as of the 2020 Census is significantly higher in the Atlanta MSA (at 12% of total population) than in the rest of the state of Georgia (at 8.2%). Hispanic/ Latinx share of the five core counties was highest among the “larger than county” aggregations, at 14%. At the county level, nearly 1 in 4 Gwinnett residents reported as Hispanic/ Latinx. The City of Atlanta (at 6%) and Henry County (at 7.7%) have the lowest Hispanic shares among ARC jurisdictions.
  • 4. 2020 Public School Enrollment by District: 13-County Atlanta Area So we just saw that Hispanic/ Latinx population represents healthy shares of total populations of counties in the Atlanta area. And yet the shares are significantly higher—in each area—when the public school enrollment is assessed. Hispanic/ Latinx children are more than 1 in 5 of all October, 2020 enrollees in Marietta and Buford City, as well as in Gwinnett, Clayton, Cobb, and Cherokee County public schools. Only Decatur and Atlanta City schools have less than 10% Hispanic/ Latinx students.
  • 5. Change in Population by Race/Ethnicity Totals: 2010-20: State of Georgia and Subareas Hispanic/ Latinx populations accounted for more than 1 in 5 of net new persons in the 11-county region between 2010 and 2020. In Gwinnett County, nearly 4 of 10 net new residents 2010-2020 was Hispanic/ Latino, and over 1 in 3 were such in Cobb County. In the state outside the Atlanta MSA, with many counties declining in size overall 2010-20, Hispanic population was the group that provided the second largest source of population increase. Only in Fulton County as a whole, driven by low inflow of Hispanics to the City of Atlanta, were fewer than 1 in 10 of net new residents Hispanic. While only the City of Atlanta and Cherokee added white, non-Hispanic populations, every jurisdiction added Hispanic/ Latinx.
  • 6. Percentage Increase, 2010-2020 by Race/ Ethnicity: 11-County Area As noted on the prior slide, Hispanic/ Latinx populations grew in every 11-county jurisdiction from 2010-2020, surging by more than 50 percent in Cherokee, Forsyth, and Henry Counties. These areas were (in 2010) some of the area with the lowest shares of Hispanic population overall, and remain so—even with the rapid increases of the last decade—in 2020. In Cherokee County, Hispanic populations grew faster than any othere race/ ethnic group. In most others, percentage increases trailed those of Asian, non-Hispanic and Mom-Hispanic, Other (including multiracial).
  • 7. Percentage Point Increases in Race/ Etnhnicity Shares, 2010-2020: Comparative Areas Hispanic populations (blue shading) increased their share of population in every area analyzed above, and by the most in Gwinnett County (3 percent) . But in all areas, other race/ ethnic growup gained more population share than did Hispanic/ Latjinx—an indication that while growth is very strong, it is beginning to slow in a relative sense over the past decade.
  • 8. Hispanic Latino Foreign-Born Population by Country, 2019 ACS Those born in Mexico made up just over 1 of every 2 Hispanic foreign-born in the 11-county region in 2019. This is actually lower than the over 6 in 10 for the rest of the state outside of the Atlanta MSA. An even hgher share of the state’s Central Americans reside in the Atlanta MSA.
  • 9. Change 2010-2019: Hispanic/Latino Foreign-Born Population by Country, 2010-19 ACS Growth rates 2010-2019 for those born in Mexico, however, were much lower than for those born in many other Hispanic/ Latinx countries. Increases for the Puerto Rican, Dominican and Venezuelan populations in the Atlanta metro and state are more notable over the period. Venezuelan and Dominican increase is overwhelmingly within the Atlanta MSA. Growth in the Cuban and Salvadoran, as well as Mexican population, is almost as strong outside the Atlanta metro (in Georgia) as within it.
  • 10. Diving down to the census tract level, we see more detail on the 2020 concentrations of Hispanic populations along the Buford Highway corridor through north-central Gwinnett, in the northern part of Clayton County, and in cities of Cobb County and Cherokee County. Source: DataNexus at neighborhoodnexus.org Share of Hispanic Population by Census Tract: 11-County ARC Region, 2020 Census
  • 11. Numeric Change in Hispanic Population by Census Tract: 11-County ARC Region, 2010- 2020 Absolute increase of Hispanic populations 2010-2020 is indicative of the wide spatial spread of diversity in the region. Almost all tracts in Gwinnett have added Hispanic persons, as well as all but a few in Cobb. And it’s notable that, even though shares of Hispanic population in the south of the region remain fairly low, absolute increases 2010-2020 have been strong in that portion of Atlanta. (Source: DataNexus at neighborhoodnexus.org)
  • 12. Percentage Point Change in Hispanic Popby Census Tract: 11-County ARC Region, 2010- 2020 Source: DataNexus at neighborhoodnexus.org
  • 13. Looking at (Census Bureau) Long-Range National Forecasts, by Race/ Ethnicity and Age So what is coming? More growth in our Hispanic population, as an element of this century’s explosion of racial and ethnic diversity. In the last national forecast by race/ethnicity and age done in 2017, Hispanic/ Latino population is projected to grow more than three times faster than the population as a whole from 2020-2040, then a little over three times faster over the last 20 years of the forecast horizon (2040-2060). And though Hispanics in 2060 continue to represent a larger share of the population as a whole (at 27.5%) than the 65+ segment (21%), the Hispanic 65+ population is expected to increase four times over by 2060.
  • 14. ARC Series 16 Forecast: 2015 and 2050 Race/ Ethnicity Shares Our forecast Series 16 baseline year is 2015, and Hispanic population made up only 11.6% of our 21- county modeling area’s population at that time. By 2050, we forecast that that share will be 21.4%, or that over 1 in 5 people in the general Atlanta area will be of Hispanic/ Latinx ethnicity.
  • 15. A Reprise: 2020 Public School Enrollments by District: Race/ Ethnicity Shares And to remind you about a slide we showed you earlier—locally, the “leading edge” of this increase in Hispanic share is visible in our 2020 public school enrollments .
  • 16. The Details! Hispanic/ Latino Forecasts: ARC Series 16 2015-2050 ARC forecasts that Hispanic population will increase nearly three times over, across our 21- county modeling area, between 2015-50. Gwinnett will again be a leader, matched by significant gains in Fulton and Forsyth. https://33n.atlantaregional.com/arc-series-16-forecast