SlideShare uma empresa Scribd logo
1 de 9
Comparative Populations: 2020 Census Totals-A Snapshot
Total
Population
Non-
Hispanic
White,
Non-
Hispanic
Black,
Non-
Hispanic
Asian,
Non-
Hispanic
Non-
Hispanic
Other*
Hispanic/
Latino
State of GA 10,711,908 9,588,451 5,362,156 3,278,119 475,680 472,496 1,123,457
Atlanta MSA 1/ 6,089,815 5,359,345 2,661,835 2,019,208 397,009 281,293 730,470
21 County Area 2/ 6,100,283 5,318,248 2,633,090 2,004,034 400,274 280,850 782,035
11 County ARC 3/ 4,967,514 4,314,666 1,912,447 1,791,664 381,987 228,568 652,848
Core 5 Counties 4/ 3,851,898 3,309,879 1,326,355 1,495,738 313,258 174,528 542,019
State less 11 County 5,744,394 5,273,785 3,449,709 1,486,455 93,693 243,928 470,609
ARC Counties:
Cherokee County 266,620 234,509 197,867 17,326 5,429 13,887 32,111
Clayton County 297,595 255,049 25,902 205,301 13,491 10,355 42,546
Cobb County 766,149 654,909 369,182 200,072 42,533 43,122 111,240
DeKalb County 764,382 682,911 215,895 384,438 50,076 32,502 81,471
Douglas County 144,237 128,202 49,877 68,763 2,313 7,249 16,035
Fayette County 119,194 109,714 68,144 29,166 6,362 6,042 9,480
Forsyth County 251,283 226,057 159,407 10,455 45,117 11,078 25,226
Fulton County 1,066,710 980,408 404,793 448,803 80,632 46,180 86,302
Gwinnett County 957,062 736,602 310,583 257,124 126,526 42,369 220,460
Henry County 240,712 222,275 86,297 116,431 7,976 11,571 18,437
Rockdale County 93,570 84,030 24,500 53,785 1,532 4,213 9,540
City of Atlanta 498,715 468,727 192,148 233,018 22,442 21,119 29,988
1/ 29-County Area
2/ARC Forecast Area, including 11 ARC Counties plus Barrow, Bartow, Carroll, Coweta,
3/ As listed below
4/ Clayton, Cobb, DeKalb. Fulton, Gwinnett
Source: US Census 2020, Processed by ARC Research & Analytics/ Neighborhood Nexus
Comparative Populations: Numerical Change 2010-2020 Census
Total
Population
Non-
Hispanic
White,
Non-
Hispanic
Black,
Non-
Hispanic
Asian,
Non-
Hispanic
Non-
Hispanic
Other*
Hispanic/
Latino
State of GA 1,024,255 754,487 -64,977 356,883 158,995 303,586 269,768
Atlanta MSA 1/ 803,087 620,511 -31,655 327,066 140,394 184,706 182,576
21 County Area 2/ 817,517 626,440 -31,132 331,608 141,301 184,663 191,077
11 County ARC 3/ 684,253 528,484 -47,194 290,308 135,965 149,405 155,769
Core 5 Counties 4/ 486,601 366,784 -37,556 196,882 95,529 111,929 119,817
State less 11 County 340,002 226,003 -17,783 66,575 23,030 154,181 113,999
ARC Counties:
Cherokee County 52,274 40,729 23,182 5,541 1,878 10,128 11,545
Clayton County 38,171 31,072 -10,900 35,833 566 5,573 7,099
Cobb County 78,071 51,161 -20,371 30,635 11,511 29,386 26,910
DeKalb County 72,489 58,842 11,715 12,098 14,314 20,715 13,647
Douglas County 11,834 6,924 -15,228 17,177 403 4,572 4,910
Fayette County 12,627 9,907 -4,216 7,944 2,142 4,037 2,720
Forsyth County 75,772 67,096 18,172 6,115 34,077 8,732 8,676
Fulton County 146,129 132,393 27,138 46,793 28,565 29,897 13,736
Gwinnett County 151,741 93,316 -45,138 71,523 40,573 26,358 58,425
Henry County 36,790 30,166 -21,106 42,052 1,927 7,293 6,624
Rockdale County 8,355 6,878 -10,442 14,597 9 2,714 1,477
City of Atlanta 78,712 70,564 39,687 8,736 9,422 12,719 8,148
1/ 29-County Area
2/ARC Forecast Area, including 11 ARC Counties plus Barrow, Bartow, Carroll, Coweta,
3/ As listed below
4/ Clayton, Cobb, DeKalb. Fulton, Gwinnett
Source: US Census 2020, Processed by ARC Research & Analytics/ Neighborhood Nexus
Historic Change: 1970-2020 Census
Part I of II
Total Population--Census Trends
1970 1980 1990 2000 2010 2020
Atlanta Region 1,517,751 1,924,140 2,601,883 3,527,779 4,283,261 4,967,514
Cherokee 31,059 51,699 91,000 141,903 214,346 266,620
Clayton 98,126 150,357 184,100 236,517 259,424 297,595
Cobb 196,793 297,718 453,400 607,751 688,078 766,149
DeKalb 415,387 483,024 553,800 665,865 691,893 764,382
Douglas 28,659 54,573 71,700 92,174 132,403 144,237
Fayette 11,364 29,043 62,800 91,263 106,567 119,194
Forsyth 16,928 27,958 44,083 98,400 175,511 251,283
Fulton 605,210 589,904 670,800 816,006 920,581 1,066,710
Gwinnett 72,349 166,808 356,500 588,448 805,321 957,062
Henry 23,724 36,309 59,200 119,341 203,922 240,712
Rockdale 18,152 36,747 54,500 70,111 85,215 93,570
City of Atlanta 495,039 424,922 415,200 416,474 420,003 498,175
1970 to 1980 to 1990 to 2000 to 2010 to
1980 1990 2000 2010 2020
Atlanta Region 40,639 67,774 92,590 75,548 68,425
Cherokee 2,064 3,930 5,090 7,244 5,227
Clayton 5,223 3,374 5,242 2,291 3,817
Cobb 10,093 15,568 15,435 8,033 7,807
DeKalb 6,764 7,078 11,207 2,603 7,249
Douglas 2,591 1,713 2,047 4,023 1,183
Fayette 1,768 3,376 2,846 1,530 1,263
Forsyth 1,103 1,613 5,432 7,711 7,577
Fulton -1,531 8,090 14,521 10,458 14,613
Gwinnett 9,446 18,969 23,195 21,687 15,174
Henry 1,259 2,289 6,014 8,458 3,679
Rockdale 1,860 1,775 1,561 1,510 836
City of Atlanta -7,012 -972 127 353 7,817
Average Annual Change
For the 11 counties, average annual increase
(numeric) in the 2010s has been strong, BUT
it is less than experienced during the 2000s or
1990s—the fastest growing decade that the
region has seen, and is likely to ever see.
Average Annual Percentage Increase
1970 to 1980 to 1990 to 2000 to 2010 to
1980 1990 2000 2010 2020
Atlanta Region 2.4 3.1 3.1 2.0 1.5
Cherokee 5.2 5.8 4.5 4.2 2.2
Clayton 4.4 2.0 2.5 0.9 1.4
Cobb 4.2 4.3 3.0 1.2 1.1
DeKalb 1.5 1.4 1.9 0.4 1.0
Douglas 6.7 2.8 2.5 3.7 0.9
Fayette 9.8 8.0 3.8 1.6 1.1
Forsyth 5.1 4.7 8.4 6.0 3.7
Fulton -0.3 1.3 2.0 1.2 1.5
Gwinnett 8.7 7.9 5.1 3.2 1.7
Henry 4.3 5.0 7.3 5.5 1.7
Rockdale 7.3 4.0 2.6 2.0 0.9
City of Atlanta -1.5 -0.2 0.0 0.1 1.7
Historic Change: 1970-2020 Census
Part I of II
On a average annual percentage basis, growth has dropped in the last decade to the lowest rate seen over the
last five decades…but it is still 1.5 percent per year! Forsyth continues to lead on this indicator as it has in the
last three 10-year periods. Prior to that, it was Fayette from 1970-80 and 1980-90.
Overall Population Change (in Percent): 2010-2020 Census
8.9%
9.8%
10.5%
11.3%
11.8%
14.7%
15.9%
16.0%
18.0%
18.7%
18.8%
24.4%
43.2%
0.0% 5.0% 10.0% 15.0% 20.0% 25.0% 30.0% 35.0% 40.0% 45.0% 50.0%
Douglas County
Rockdale County
DeKalb County
Cobb County
Fayette County
Clayton County
Fulton County
11co
Henry County
City of Atlanta
Gwinnett County
Cherokee County
Forsyth County
Forsyth has been one of the fastest growing counties in the
nation since the 1990s, and from 2010-2020, it led the region
with a growth rate nearly 20 percentage points above that of
Cherokee in second place. Douglas and Rockdale Counties were
the only jurisdictions to grow by less than 10% in the decade.
Race/ Ethnicity Shares: 2020 Census
8.7%
26.2%
28.2%
32.5%
34.6%
35.9%
37.9%
38.5%
38.5%
43.7%
48.2%
50.1%
57.2%
63.4%
74.2%
69.0%
57.5%
50.3%
26.9%
47.7%
48.4%
42.1%
36.1%
46.7%
33.2%
26.1%
30.6%
24.5%
4.2%
6.5%
4.5%
1.6%
6.6%
13.2%
1.6%
3.3%
7.6%
7.7%
4.5%
6.5%
5.6%
4.4%
5.3%
18.0%
2.0%
14.3%
10.2%
10.7%
23.0%
11.1%
7.7%
8.1%
13.1%
6.0%
12.0%
14.5%
10.5%
8.0%
10.0%
12.0%
3.5%
4.5%
4.3%
4.4%
5.0%
4.8%
4.3%
4.6%
4.3%
4.6%
5.6%
4.4%
5.1%
4.4%
5.2%
0.0% 10.0% 20.0% 30.0% 40.0% 50.0% 60.0% 70.0% 80.0% 90.0% 100.0%
Clayton County
Rockdale County
DeKalb County
Gwinnett County
Douglas County
Henry County
Fulton County
11 county
City of Atlanta
Atlanta MSA
Cobb County
State
Fayette County
Forsyth County
Cherokee County
White, Non-Hispanic Black, Non-Hispanic Asian,Non-Hispanic Hispanic Non-Hispanic, All Other
• The 2020 Census reports that only three of the eleven counties (Cherokee, Forsyth, and Fayette) are majority-White non-Hispanic , and
these shares are declining quickly compared to previous Census periods. For example, Forsyth was 92% white, non-Hispanic in 1990, but
has dropped to 63% as of the 2020 Census. Clayton, DeKalb, and Rockdale are over 50% Black, with Henry and Douglas just under that
threshold. Nine of eleven counties are 10% Hispanic of higher, while the region’s population was at 13% as of the 2020 Census
• Among the most prominent racial groups, the Asian population has grown the fastest by far in the last decade, to reach nearly 8 percent
of the region’s population, and soaring to 18% of Forsyth and 13% of Gwinnett
Percentage Point Change in Race/ Ethnicity Shares: 2010-2020
-7.3
-5.5
-8.4
-1.3
-14.6
-10.7
-17.0
-3.1
-11.7
-16.8
-14.8
2.2
-7.2
-6.0
-20.0
-15.0
-10.0
-5.0
0.0
5.0
10.0
15.0
Cherokee Clayton Cobb DeKalb Douglas Fayette Forsyth Fulton Gwinnett Henry Rockdale
City of
Atlanta MSA State
White, Non-Hispanic Black, Non-Hispanic Asian, Non-Hispanic All Other, Non-Hispanic Hispanic
• White, non-Hispanic population gained share, from 2010-2020, only in the City of Atlanta—it fell everywhere else. Five regional counties (with Forsyth the
greatest at 17 percentage points drop) had declining white, non-Hispanic shares over the last decade
• The share of “All Other, Non-Hispanic” grew in all areas 2010-2020—driven by gains in the number and share of people classifying as multiracial
• The Black share of the population increased everywhere but DeKalb County and the City of Atlanta, though those two areas remain at or just under 50%
Black. The largest share gains were in Henry and Rockdale, followed by Douglas County
• Hispanic population increased modestly, gaining less than 5 percentage points in all areas.
Percentage Change 2010-20:Population of Largest Race Groups
13.3%
-29.6%
-5.2%
5.7%
-23.4%
-5.8%
12.9%
7.2%
-12.7%
-19.7%
-29.9%
-2.4%
47.0%
21.1%
18.1%
3.2%
33.3%
37.4%
140.9%
11.6%
38.5%
56.5%
37.2%
19.3%
52.9%
4.4%
37.1%
40.0%
21.1%
50.8%
54.9%
47.2%
31.9%
0.6%
55.3%
56.1%
20.0%
31.9%
20.1%
44.1%
40.2%
52.4%
18.9%
36.1%
56.1%
18.3%
31.3%
-50.0%
0.0%
50.0%
100.0%
150.0%
Cherokee
County
Clayton
County
Cobb
County
DeKalb
County
Douglas
County
Fayette
County
Forsyth
County
Fulton
County
Gwinnett
County
Henry
County
Rockdale
County
11 County
White, Non-Hispanic Black, Non-Hispanic
Asian, Non-Hispanic Hispanic
300%
• Asian population increased by over 50 percent in the 11-county area from 2010-2020. Forsyth County saw a 300% increase in its Asian population, followed by Fulton
at 54%, Cherokee at 53%, and Fayette at 51%. White population had an absolute decline in all counties except DeKalb and Fulton (driven by increases in the City of
Atlanta). White population losses in Clayton and Rockdale approached 30%. Hispanic population grew by a third across the 11 counties, increasing by more than 50%
in Henry (at 66%), Cherokee at 56%, and Forsyth at 52%.Black population more than doubled in Forsyth, and increased by more than 50 percent in Henry. And we can’t
even put Non-Hispanic, Other on the same chart, so…
135.9%
188.5%
200.2%
203.4%
207.8%
208.2%
215.8%
217.9%
237.6%
243.7%
326.8%
446.2%
0.0% 50.0% 100.0% 150.0% 200.0% 250.0% 300.0% 350.0% 400.0% 450.0% 500.0%
Clayton County
Gwinnett County
Henry County
DeKalb County
Douglas County
Fulton County
Rockdale County
11 county
Fayette County
Cobb County
Cherokee County
Forsyth County
Percentage Increase 2010-2020: Non-Hispanic, Some Other Race, Two or More Races
• The number of persons classifying as some other race
or “two or more races”, with about 90% of this group
stating that they were multiracial) more than
quadrupled 2010-2020 in all but Gwinnett and Clayton
County—and Gwinnett had the highest share of such
persons in 2020 (and in 2010)
• As you see, the scale just would not work compared to
the increases in other racial/ ethnic groups, as rapid as
most of those increases were during the 2010s!

Mais conteúdo relacionado

Mais procurados

The State of Australia's fast-growing outer suburbs
The State of Australia's fast-growing outer suburbsThe State of Australia's fast-growing outer suburbs
The State of Australia's fast-growing outer suburbs.id - the population experts
 
The Changing Family Structure in the Atlanta Region
The Changing Family Structure in the Atlanta RegionThe Changing Family Structure in the Atlanta Region
The Changing Family Structure in the Atlanta RegionARCResearch
 
July Snapshot: Employment Trends & Establishment Growth in Metro Atlanta
July Snapshot: Employment Trends & Establishment Growth in Metro Atlanta July Snapshot: Employment Trends & Establishment Growth in Metro Atlanta
July Snapshot: Employment Trends & Establishment Growth in Metro Atlanta ARCResearch
 
Austin: Growth, Change & Promise
Austin: Growth, Change & PromiseAustin: Growth, Change & Promise
Austin: Growth, Change & PromiseCivic Analytics LLC
 
Williamson County, Texas: Changing Demographics and Implications of Growth
Williamson County, Texas: Changing Demographics and Implications of GrowthWilliamson County, Texas: Changing Demographics and Implications of Growth
Williamson County, Texas: Changing Demographics and Implications of GrowthCivic Analytics LLC
 
City of Asheville Housing Needs Assessment
City of Asheville Housing Needs AssessmentCity of Asheville Housing Needs Assessment
City of Asheville Housing Needs AssessmentGordon Smith
 
Housing prices snapshot 2016 final
Housing prices snapshot 2016 finalHousing prices snapshot 2016 final
Housing prices snapshot 2016 finalARCResearch
 
Public Health in Metro Atlanta
Public Health in Metro AtlantaPublic Health in Metro Atlanta
Public Health in Metro AtlantaARCResearch
 
October regional snapshot economy 2016
October regional snapshot economy 2016October regional snapshot economy 2016
October regional snapshot economy 2016ARCResearch
 
2019 Regional Economy RS: Slide Deck
2019 Regional Economy RS: Slide Deck2019 Regional Economy RS: Slide Deck
2019 Regional Economy RS: Slide DeckARCResearch
 
A look at housing in south africa.2018
A look at housing in south africa.2018A look at housing in south africa.2018
A look at housing in south africa.201871point4
 
December 2021 Metro Atlanta Speaks Regional Snapshot
December 2021 Metro Atlanta Speaks Regional SnapshotDecember 2021 Metro Atlanta Speaks Regional Snapshot
December 2021 Metro Atlanta Speaks Regional Snapshotlaylabellows
 
Housing Virginia Rural Report - Nov 2016
Housing Virginia Rural Report - Nov 2016Housing Virginia Rural Report - Nov 2016
Housing Virginia Rural Report - Nov 2016Alise Newman
 
Growth in Older Adult Population in Austin, Texas
Growth in Older Adult Population in Austin, TexasGrowth in Older Adult Population in Austin, Texas
Growth in Older Adult Population in Austin, TexasCivic Analytics LLC
 
Prof. F.C. Rosati, La statistica per la ricerca: caratteristiche, integrazion...
Prof. F.C. Rosati, La statistica per la ricerca: caratteristiche, integrazion...Prof. F.C. Rosati, La statistica per la ricerca: caratteristiche, integrazion...
Prof. F.C. Rosati, La statistica per la ricerca: caratteristiche, integrazion...Istituto nazionale di statistica
 
Living standards in Greater Manchester
Living standards in Greater ManchesterLiving standards in Greater Manchester
Living standards in Greater ManchesterResolutionFoundation
 

Mais procurados (20)

2021 State of the Community Report Presentation
2021 State of the Community Report Presentation2021 State of the Community Report Presentation
2021 State of the Community Report Presentation
 
The State of Australia's fast-growing outer suburbs
The State of Australia's fast-growing outer suburbsThe State of Australia's fast-growing outer suburbs
The State of Australia's fast-growing outer suburbs
 
The Changing Family Structure in the Atlanta Region
The Changing Family Structure in the Atlanta RegionThe Changing Family Structure in the Atlanta Region
The Changing Family Structure in the Atlanta Region
 
July Snapshot: Employment Trends & Establishment Growth in Metro Atlanta
July Snapshot: Employment Trends & Establishment Growth in Metro Atlanta July Snapshot: Employment Trends & Establishment Growth in Metro Atlanta
July Snapshot: Employment Trends & Establishment Growth in Metro Atlanta
 
Austin: Growth, Change & Promise
Austin: Growth, Change & PromiseAustin: Growth, Change & Promise
Austin: Growth, Change & Promise
 
Williamson County, Texas: Changing Demographics and Implications of Growth
Williamson County, Texas: Changing Demographics and Implications of GrowthWilliamson County, Texas: Changing Demographics and Implications of Growth
Williamson County, Texas: Changing Demographics and Implications of Growth
 
City of Asheville Housing Needs Assessment
City of Asheville Housing Needs AssessmentCity of Asheville Housing Needs Assessment
City of Asheville Housing Needs Assessment
 
Housing prices snapshot 2016 final
Housing prices snapshot 2016 finalHousing prices snapshot 2016 final
Housing prices snapshot 2016 final
 
Public Health in Metro Atlanta
Public Health in Metro AtlantaPublic Health in Metro Atlanta
Public Health in Metro Atlanta
 
October regional snapshot economy 2016
October regional snapshot economy 2016October regional snapshot economy 2016
October regional snapshot economy 2016
 
2019 Regional Economy RS: Slide Deck
2019 Regional Economy RS: Slide Deck2019 Regional Economy RS: Slide Deck
2019 Regional Economy RS: Slide Deck
 
A look at housing in south africa.2018
A look at housing in south africa.2018A look at housing in south africa.2018
A look at housing in south africa.2018
 
December 2021 Metro Atlanta Speaks Regional Snapshot
December 2021 Metro Atlanta Speaks Regional SnapshotDecember 2021 Metro Atlanta Speaks Regional Snapshot
December 2021 Metro Atlanta Speaks Regional Snapshot
 
Housing Virginia Rural Report - Nov 2016
Housing Virginia Rural Report - Nov 2016Housing Virginia Rural Report - Nov 2016
Housing Virginia Rural Report - Nov 2016
 
An Overview of Recent Population Trends Illinois
An Overview of Recent Population Trends IllinoisAn Overview of Recent Population Trends Illinois
An Overview of Recent Population Trends Illinois
 
Floyd County Snapshot
Floyd County SnapshotFloyd County Snapshot
Floyd County Snapshot
 
Floyd County Data Snapshot
Floyd County Data SnapshotFloyd County Data Snapshot
Floyd County Data Snapshot
 
Growth in Older Adult Population in Austin, Texas
Growth in Older Adult Population in Austin, TexasGrowth in Older Adult Population in Austin, Texas
Growth in Older Adult Population in Austin, Texas
 
Prof. F.C. Rosati, La statistica per la ricerca: caratteristiche, integrazion...
Prof. F.C. Rosati, La statistica per la ricerca: caratteristiche, integrazion...Prof. F.C. Rosati, La statistica per la ricerca: caratteristiche, integrazion...
Prof. F.C. Rosati, La statistica per la ricerca: caratteristiche, integrazion...
 
Living standards in Greater Manchester
Living standards in Greater ManchesterLiving standards in Greater Manchester
Living standards in Greater Manchester
 

Semelhante a A First Look at Atlanta's 2020 Census Results: Counties and "Up"

Heartland 2050 meeting 2
Heartland 2050 meeting 2 Heartland 2050 meeting 2
Heartland 2050 meeting 2 Heartland2050
 
Population Estimates, Methods, Procedures & Local Govt
Population Estimates, Methods, Procedures & Local GovtPopulation Estimates, Methods, Procedures & Local Govt
Population Estimates, Methods, Procedures & Local GovtRobert Hiett
 
FPS Demographics Presentation
FPS Demographics PresentationFPS Demographics Presentation
FPS Demographics PresentationFranklin Matters
 
Campstone Offering Memorandum 5-12-16
Campstone Offering Memorandum 5-12-16Campstone Offering Memorandum 5-12-16
Campstone Offering Memorandum 5-12-16Michael Brazill
 
Leadership Howard08
Leadership Howard08Leadership Howard08
Leadership Howard08lkenney
 
Salt Lake County Utilities
Salt Lake County UtilitiesSalt Lake County Utilities
Salt Lake County UtilitiesCassanda Banks
 
Examining the Housing Market in Metro Atlanta
Examining the Housing Market in Metro AtlantaExamining the Housing Market in Metro Atlanta
Examining the Housing Market in Metro AtlantaARCResearch
 
ARC's 2014 Population Estimates
ARC's 2014 Population EstimatesARC's 2014 Population Estimates
ARC's 2014 Population EstimatesARCResearch
 
5 steering 2-7-final
5 steering 2-7-final5 steering 2-7-final
5 steering 2-7-finalHeartland2050
 
Washington county demographics 3-10
Washington county demographics 3-10Washington county demographics 3-10
Washington county demographics 3-10Paul Roback
 
AGING IN NC PRESENTATION - ABROWN 2015-09
AGING IN NC PRESENTATION - ABROWN 2015-09AGING IN NC PRESENTATION - ABROWN 2015-09
AGING IN NC PRESENTATION - ABROWN 2015-09Allison Brown
 
2262015 Table 5 ­ Crime in the United States 2009http.docx
2262015 Table 5 ­ Crime in the United States 2009http.docx2262015 Table 5 ­ Crime in the United States 2009http.docx
2262015 Table 5 ­ Crime in the United States 2009http.docxeugeniadean34240
 
Somerset County: Embracing Diversity & Inclusion
Somerset County: Embracing Diversity & InclusionSomerset County: Embracing Diversity & Inclusion
Somerset County: Embracing Diversity & InclusionMelissa DeFreest
 
ENCORE Fayette - Fayette County Economic Overview
ENCORE Fayette - Fayette County Economic OverviewENCORE Fayette - Fayette County Economic Overview
ENCORE Fayette - Fayette County Economic OverviewMatt Forshee
 
Changing Demographics of Georgia and Metro Atlanta
Changing Demographics of Georgia and Metro AtlantaChanging Demographics of Georgia and Metro Atlanta
Changing Demographics of Georgia and Metro AtlantaARCResearch
 
Changing Demographics: The Meaning for Advertising and Marketing
Changing Demographics: The Meaning for Advertising and MarketingChanging Demographics: The Meaning for Advertising and Marketing
Changing Demographics: The Meaning for Advertising and MarketingAAF Northern Illinois
 

Semelhante a A First Look at Atlanta's 2020 Census Results: Counties and "Up" (20)

Heartland 2050 meeting 2
Heartland 2050 meeting 2 Heartland 2050 meeting 2
Heartland 2050 meeting 2
 
Population Estimates, Methods, Procedures & Local Govt
Population Estimates, Methods, Procedures & Local GovtPopulation Estimates, Methods, Procedures & Local Govt
Population Estimates, Methods, Procedures & Local Govt
 
FPS Demographics Presentation
FPS Demographics PresentationFPS Demographics Presentation
FPS Demographics Presentation
 
Campstone Offering Memorandum 5-12-16
Campstone Offering Memorandum 5-12-16Campstone Offering Memorandum 5-12-16
Campstone Offering Memorandum 5-12-16
 
Leadership Howard08
Leadership Howard08Leadership Howard08
Leadership Howard08
 
Salt Lake County Utilities
Salt Lake County UtilitiesSalt Lake County Utilities
Salt Lake County Utilities
 
Examining the Housing Market in Metro Atlanta
Examining the Housing Market in Metro AtlantaExamining the Housing Market in Metro Atlanta
Examining the Housing Market in Metro Atlanta
 
ARC's 2014 Population Estimates
ARC's 2014 Population EstimatesARC's 2014 Population Estimates
ARC's 2014 Population Estimates
 
5 steering 2-7-final
5 steering 2-7-final5 steering 2-7-final
5 steering 2-7-final
 
Washington county demographics 3-10
Washington county demographics 3-10Washington county demographics 3-10
Washington county demographics 3-10
 
AGING IN NC PRESENTATION - ABROWN 2015-09
AGING IN NC PRESENTATION - ABROWN 2015-09AGING IN NC PRESENTATION - ABROWN 2015-09
AGING IN NC PRESENTATION - ABROWN 2015-09
 
2262015 Table 5 ­ Crime in the United States 2009http.docx
2262015 Table 5 ­ Crime in the United States 2009http.docx2262015 Table 5 ­ Crime in the United States 2009http.docx
2262015 Table 5 ­ Crime in the United States 2009http.docx
 
Somerset County: Embracing Diversity & Inclusion
Somerset County: Embracing Diversity & InclusionSomerset County: Embracing Diversity & Inclusion
Somerset County: Embracing Diversity & Inclusion
 
ENCORE Fayette - Fayette County Economic Overview
ENCORE Fayette - Fayette County Economic OverviewENCORE Fayette - Fayette County Economic Overview
ENCORE Fayette - Fayette County Economic Overview
 
Leadership 2019 Session #3 "History and Governance" with Chamber President an...
Leadership 2019 Session #3 "History and Governance" with Chamber President an...Leadership 2019 Session #3 "History and Governance" with Chamber President an...
Leadership 2019 Session #3 "History and Governance" with Chamber President an...
 
2013 State of the Community Report
2013 State of the Community Report2013 State of the Community Report
2013 State of the Community Report
 
Changing Demographics of Georgia and Metro Atlanta
Changing Demographics of Georgia and Metro AtlantaChanging Demographics of Georgia and Metro Atlanta
Changing Demographics of Georgia and Metro Atlanta
 
2014 State of the Community Report
2014 State of the Community Report2014 State of the Community Report
2014 State of the Community Report
 
March 2010 market seminar
March 2010 market seminarMarch 2010 market seminar
March 2010 market seminar
 
Changing Demographics: The Meaning for Advertising and Marketing
Changing Demographics: The Meaning for Advertising and MarketingChanging Demographics: The Meaning for Advertising and Marketing
Changing Demographics: The Meaning for Advertising and Marketing
 

Mais de ARCResearch

Regional Snapshot Atlanta Aging Trends 2024
Regional Snapshot Atlanta Aging Trends 2024Regional Snapshot Atlanta Aging Trends 2024
Regional Snapshot Atlanta Aging Trends 2024ARCResearch
 
MC_forecasts_finals series 17_feb2024.pdf
MC_forecasts_finals series 17_feb2024.pdfMC_forecasts_finals series 17_feb2024.pdf
MC_forecasts_finals series 17_feb2024.pdfARCResearch
 
33N Blog Housing MAS 2023 Slide Deckpdf
33N Blog Housing MAS 2023  Slide Deckpdf33N Blog Housing MAS 2023  Slide Deckpdf
33N Blog Housing MAS 2023 Slide DeckpdfARCResearch
 
33N MAS 2023 BiggestProblemQuestionSlides
33N MAS 2023 BiggestProblemQuestionSlides33N MAS 2023 BiggestProblemQuestionSlides
33N MAS 2023 BiggestProblemQuestionSlidesARCResearch
 
Metro Atlanta Speaks Summary RS Jan 2024
Metro Atlanta Speaks  Summary RS Jan 2024Metro Atlanta Speaks  Summary RS Jan 2024
Metro Atlanta Speaks Summary RS Jan 2024ARCResearch
 
Final Jobs and Wages Snapshot Slide Deck2024
Final Jobs and Wages Snapshot Slide Deck2024Final Jobs and Wages Snapshot Slide Deck2024
Final Jobs and Wages Snapshot Slide Deck2024ARCResearch
 
Regionalsnapshot_HealthDisparities_Oct2023
Regionalsnapshot_HealthDisparities_Oct2023Regionalsnapshot_HealthDisparities_Oct2023
Regionalsnapshot_HealthDisparities_Oct2023ARCResearch
 
MAS 2023 SORB Slides Final.pdf
MAS 2023 SORB Slides Final.pdfMAS 2023 SORB Slides Final.pdf
MAS 2023 SORB Slides Final.pdfARCResearch
 
2023 Population Estimates: ARC Region
2023 Population Estimates: ARC Region2023 Population Estimates: ARC Region
2023 Population Estimates: ARC RegionARCResearch
 
Housing Snapshot Final June30 2023df
Housing Snapshot Final June30 2023dfHousing Snapshot Final June30 2023df
Housing Snapshot Final June30 2023dfARCResearch
 
ARC Aging Snapshot Final 2023.pdf
ARC Aging Snapshot Final 2023.pdfARC Aging Snapshot Final 2023.pdf
ARC Aging Snapshot Final 2023.pdfARCResearch
 
100 Metros Update
100 Metros Update100 Metros Update
100 Metros UpdateARCResearch
 
Economy Snapshot
Economy SnapshotEconomy Snapshot
Economy SnapshotARCResearch
 
Migration Presentation - Final.pdf
Migration Presentation - Final.pdfMigration Presentation - Final.pdf
Migration Presentation - Final.pdfARCResearch
 
Regional S17 Forecast Snapshot.pdf
Regional S17 Forecast Snapshot.pdfRegional S17 Forecast Snapshot.pdf
Regional S17 Forecast Snapshot.pdfARCResearch
 
Rental presentation - with annotation.pdf
Rental presentation - with annotation.pdfRental presentation - with annotation.pdf
Rental presentation - with annotation.pdfARCResearch
 
Cost of Living Snapshot Sept. 2022
Cost of Living Snapshot Sept. 2022Cost of Living Snapshot Sept. 2022
Cost of Living Snapshot Sept. 2022ARCResearch
 
2022 Population Estimates ARC
2022 Population Estimates ARC2022 Population Estimates ARC
2022 Population Estimates ARCARCResearch
 

Mais de ARCResearch (20)

Regional Snapshot Atlanta Aging Trends 2024
Regional Snapshot Atlanta Aging Trends 2024Regional Snapshot Atlanta Aging Trends 2024
Regional Snapshot Atlanta Aging Trends 2024
 
MC_forecasts_finals series 17_feb2024.pdf
MC_forecasts_finals series 17_feb2024.pdfMC_forecasts_finals series 17_feb2024.pdf
MC_forecasts_finals series 17_feb2024.pdf
 
33N Blog Housing MAS 2023 Slide Deckpdf
33N Blog Housing MAS 2023  Slide Deckpdf33N Blog Housing MAS 2023  Slide Deckpdf
33N Blog Housing MAS 2023 Slide Deckpdf
 
33N MAS 2023 BiggestProblemQuestionSlides
33N MAS 2023 BiggestProblemQuestionSlides33N MAS 2023 BiggestProblemQuestionSlides
33N MAS 2023 BiggestProblemQuestionSlides
 
Metro Atlanta Speaks Summary RS Jan 2024
Metro Atlanta Speaks  Summary RS Jan 2024Metro Atlanta Speaks  Summary RS Jan 2024
Metro Atlanta Speaks Summary RS Jan 2024
 
Final Jobs and Wages Snapshot Slide Deck2024
Final Jobs and Wages Snapshot Slide Deck2024Final Jobs and Wages Snapshot Slide Deck2024
Final Jobs and Wages Snapshot Slide Deck2024
 
Regionalsnapshot_HealthDisparities_Oct2023
Regionalsnapshot_HealthDisparities_Oct2023Regionalsnapshot_HealthDisparities_Oct2023
Regionalsnapshot_HealthDisparities_Oct2023
 
MAS 2023 SORB Slides Final.pdf
MAS 2023 SORB Slides Final.pdfMAS 2023 SORB Slides Final.pdf
MAS 2023 SORB Slides Final.pdf
 
COLI snapshot
COLI snapshotCOLI snapshot
COLI snapshot
 
2023 Population Estimates: ARC Region
2023 Population Estimates: ARC Region2023 Population Estimates: ARC Region
2023 Population Estimates: ARC Region
 
Housing Snapshot Final June30 2023df
Housing Snapshot Final June30 2023dfHousing Snapshot Final June30 2023df
Housing Snapshot Final June30 2023df
 
test2
test2test2
test2
 
ARC Aging Snapshot Final 2023.pdf
ARC Aging Snapshot Final 2023.pdfARC Aging Snapshot Final 2023.pdf
ARC Aging Snapshot Final 2023.pdf
 
100 Metros Update
100 Metros Update100 Metros Update
100 Metros Update
 
Economy Snapshot
Economy SnapshotEconomy Snapshot
Economy Snapshot
 
Migration Presentation - Final.pdf
Migration Presentation - Final.pdfMigration Presentation - Final.pdf
Migration Presentation - Final.pdf
 
Regional S17 Forecast Snapshot.pdf
Regional S17 Forecast Snapshot.pdfRegional S17 Forecast Snapshot.pdf
Regional S17 Forecast Snapshot.pdf
 
Rental presentation - with annotation.pdf
Rental presentation - with annotation.pdfRental presentation - with annotation.pdf
Rental presentation - with annotation.pdf
 
Cost of Living Snapshot Sept. 2022
Cost of Living Snapshot Sept. 2022Cost of Living Snapshot Sept. 2022
Cost of Living Snapshot Sept. 2022
 
2022 Population Estimates ARC
2022 Population Estimates ARC2022 Population Estimates ARC
2022 Population Estimates ARC
 

Último

Unique Value Prop slide deck________.pdf
Unique Value Prop slide deck________.pdfUnique Value Prop slide deck________.pdf
Unique Value Prop slide deck________.pdfScottMeyers35
 
3 May, Journalism in the face of the Environmental Crisis.
3 May, Journalism in the face of the Environmental Crisis.3 May, Journalism in the face of the Environmental Crisis.
3 May, Journalism in the face of the Environmental Crisis.Christina Parmionova
 
Election 2024 Presiding Duty Keypoints_01.pdf
Election 2024 Presiding Duty Keypoints_01.pdfElection 2024 Presiding Duty Keypoints_01.pdf
Election 2024 Presiding Duty Keypoints_01.pdfSamirsinh Parmar
 
31st World Press Freedom Day Conference.
31st World Press Freedom Day Conference.31st World Press Freedom Day Conference.
31st World Press Freedom Day Conference.Christina Parmionova
 
Top profile Call Girls In Haldia [ 7014168258 ] Call Me For Genuine Models We...
Top profile Call Girls In Haldia [ 7014168258 ] Call Me For Genuine Models We...Top profile Call Girls In Haldia [ 7014168258 ] Call Me For Genuine Models We...
Top profile Call Girls In Haldia [ 7014168258 ] Call Me For Genuine Models We...gajnagarg
 
Top profile Call Girls In Morena [ 7014168258 ] Call Me For Genuine Models We...
Top profile Call Girls In Morena [ 7014168258 ] Call Me For Genuine Models We...Top profile Call Girls In Morena [ 7014168258 ] Call Me For Genuine Models We...
Top profile Call Girls In Morena [ 7014168258 ] Call Me For Genuine Models We...gajnagarg
 
Peace-Conflict-and-National-Adaptation-Plan-NAP-Processes-.pdf
Peace-Conflict-and-National-Adaptation-Plan-NAP-Processes-.pdfPeace-Conflict-and-National-Adaptation-Plan-NAP-Processes-.pdf
Peace-Conflict-and-National-Adaptation-Plan-NAP-Processes-.pdfNAP Global Network
 
Competitive Advantage slide deck___.pptx
Competitive Advantage slide deck___.pptxCompetitive Advantage slide deck___.pptx
Competitive Advantage slide deck___.pptxScottMeyers35
 
Make a difference in a girl's life by donating to her education!
Make a difference in a girl's life by donating to her education!Make a difference in a girl's life by donating to her education!
Make a difference in a girl's life by donating to her education!SERUDS INDIA
 
Financing strategies for adaptation. Presentation for CANCC
Financing strategies for adaptation. Presentation for CANCCFinancing strategies for adaptation. Presentation for CANCC
Financing strategies for adaptation. Presentation for CANCCNAP Global Network
 
2024: The FAR, Federal Acquisition Regulations, Part 30
2024: The FAR, Federal Acquisition Regulations, Part 302024: The FAR, Federal Acquisition Regulations, Part 30
2024: The FAR, Federal Acquisition Regulations, Part 30JSchaus & Associates
 
A Press for the Planet: Journalism in the face of the Environmental Crisis
A Press for the Planet: Journalism in the face of the Environmental CrisisA Press for the Planet: Journalism in the face of the Environmental Crisis
A Press for the Planet: Journalism in the face of the Environmental CrisisChristina Parmionova
 
Time, Stress & Work Life Balance for Clerks with Beckie Whitehouse
Time, Stress & Work Life Balance for Clerks with Beckie WhitehouseTime, Stress & Work Life Balance for Clerks with Beckie Whitehouse
Time, Stress & Work Life Balance for Clerks with Beckie Whitehousesubs7
 
sponsor for poor old age person food.pdf
sponsor for poor old age person food.pdfsponsor for poor old age person food.pdf
sponsor for poor old age person food.pdfSERUDS INDIA
 
An Atoll Futures Research Institute? Presentation for CANCC
An Atoll Futures Research Institute? Presentation for CANCCAn Atoll Futures Research Institute? Presentation for CANCC
An Atoll Futures Research Institute? Presentation for CANCCNAP Global Network
 
2024 asthma jkdjkfjsdklfjsdlkfjskldfgdsgerg
2024 asthma jkdjkfjsdklfjsdlkfjskldfgdsgerg2024 asthma jkdjkfjsdklfjsdlkfjskldfgdsgerg
2024 asthma jkdjkfjsdklfjsdlkfjskldfgdsgergMadhuKothuru
 
Tuvalu Coastal Adaptation Project (TCAP)
Tuvalu Coastal Adaptation Project (TCAP)Tuvalu Coastal Adaptation Project (TCAP)
Tuvalu Coastal Adaptation Project (TCAP)NAP Global Network
 
2024 UN Civil Society Conference in Support of the Summit of the Future.
2024 UN Civil Society Conference in Support of the Summit of the Future.2024 UN Civil Society Conference in Support of the Summit of the Future.
2024 UN Civil Society Conference in Support of the Summit of the Future.Christina Parmionova
 

Último (20)

Unique Value Prop slide deck________.pdf
Unique Value Prop slide deck________.pdfUnique Value Prop slide deck________.pdf
Unique Value Prop slide deck________.pdf
 
3 May, Journalism in the face of the Environmental Crisis.
3 May, Journalism in the face of the Environmental Crisis.3 May, Journalism in the face of the Environmental Crisis.
3 May, Journalism in the face of the Environmental Crisis.
 
Election 2024 Presiding Duty Keypoints_01.pdf
Election 2024 Presiding Duty Keypoints_01.pdfElection 2024 Presiding Duty Keypoints_01.pdf
Election 2024 Presiding Duty Keypoints_01.pdf
 
31st World Press Freedom Day Conference.
31st World Press Freedom Day Conference.31st World Press Freedom Day Conference.
31st World Press Freedom Day Conference.
 
tOld settlement register shouldnotaffect BTR
tOld settlement register shouldnotaffect BTRtOld settlement register shouldnotaffect BTR
tOld settlement register shouldnotaffect BTR
 
Top profile Call Girls In Haldia [ 7014168258 ] Call Me For Genuine Models We...
Top profile Call Girls In Haldia [ 7014168258 ] Call Me For Genuine Models We...Top profile Call Girls In Haldia [ 7014168258 ] Call Me For Genuine Models We...
Top profile Call Girls In Haldia [ 7014168258 ] Call Me For Genuine Models We...
 
Top profile Call Girls In Morena [ 7014168258 ] Call Me For Genuine Models We...
Top profile Call Girls In Morena [ 7014168258 ] Call Me For Genuine Models We...Top profile Call Girls In Morena [ 7014168258 ] Call Me For Genuine Models We...
Top profile Call Girls In Morena [ 7014168258 ] Call Me For Genuine Models We...
 
Peace-Conflict-and-National-Adaptation-Plan-NAP-Processes-.pdf
Peace-Conflict-and-National-Adaptation-Plan-NAP-Processes-.pdfPeace-Conflict-and-National-Adaptation-Plan-NAP-Processes-.pdf
Peace-Conflict-and-National-Adaptation-Plan-NAP-Processes-.pdf
 
Competitive Advantage slide deck___.pptx
Competitive Advantage slide deck___.pptxCompetitive Advantage slide deck___.pptx
Competitive Advantage slide deck___.pptx
 
Make a difference in a girl's life by donating to her education!
Make a difference in a girl's life by donating to her education!Make a difference in a girl's life by donating to her education!
Make a difference in a girl's life by donating to her education!
 
Financing strategies for adaptation. Presentation for CANCC
Financing strategies for adaptation. Presentation for CANCCFinancing strategies for adaptation. Presentation for CANCC
Financing strategies for adaptation. Presentation for CANCC
 
2024: The FAR, Federal Acquisition Regulations, Part 30
2024: The FAR, Federal Acquisition Regulations, Part 302024: The FAR, Federal Acquisition Regulations, Part 30
2024: The FAR, Federal Acquisition Regulations, Part 30
 
A Press for the Planet: Journalism in the face of the Environmental Crisis
A Press for the Planet: Journalism in the face of the Environmental CrisisA Press for the Planet: Journalism in the face of the Environmental Crisis
A Press for the Planet: Journalism in the face of the Environmental Crisis
 
Panchayath circular KLC -Panchayath raj act s 169, 218
Panchayath circular KLC -Panchayath raj act s 169, 218Panchayath circular KLC -Panchayath raj act s 169, 218
Panchayath circular KLC -Panchayath raj act s 169, 218
 
Time, Stress & Work Life Balance for Clerks with Beckie Whitehouse
Time, Stress & Work Life Balance for Clerks with Beckie WhitehouseTime, Stress & Work Life Balance for Clerks with Beckie Whitehouse
Time, Stress & Work Life Balance for Clerks with Beckie Whitehouse
 
sponsor for poor old age person food.pdf
sponsor for poor old age person food.pdfsponsor for poor old age person food.pdf
sponsor for poor old age person food.pdf
 
An Atoll Futures Research Institute? Presentation for CANCC
An Atoll Futures Research Institute? Presentation for CANCCAn Atoll Futures Research Institute? Presentation for CANCC
An Atoll Futures Research Institute? Presentation for CANCC
 
2024 asthma jkdjkfjsdklfjsdlkfjskldfgdsgerg
2024 asthma jkdjkfjsdklfjsdlkfjskldfgdsgerg2024 asthma jkdjkfjsdklfjsdlkfjskldfgdsgerg
2024 asthma jkdjkfjsdklfjsdlkfjskldfgdsgerg
 
Tuvalu Coastal Adaptation Project (TCAP)
Tuvalu Coastal Adaptation Project (TCAP)Tuvalu Coastal Adaptation Project (TCAP)
Tuvalu Coastal Adaptation Project (TCAP)
 
2024 UN Civil Society Conference in Support of the Summit of the Future.
2024 UN Civil Society Conference in Support of the Summit of the Future.2024 UN Civil Society Conference in Support of the Summit of the Future.
2024 UN Civil Society Conference in Support of the Summit of the Future.
 

A First Look at Atlanta's 2020 Census Results: Counties and "Up"

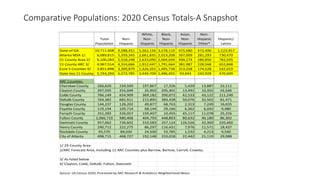
  • 1. Comparative Populations: 2020 Census Totals-A Snapshot Total Population Non- Hispanic White, Non- Hispanic Black, Non- Hispanic Asian, Non- Hispanic Non- Hispanic Other* Hispanic/ Latino State of GA 10,711,908 9,588,451 5,362,156 3,278,119 475,680 472,496 1,123,457 Atlanta MSA 1/ 6,089,815 5,359,345 2,661,835 2,019,208 397,009 281,293 730,470 21 County Area 2/ 6,100,283 5,318,248 2,633,090 2,004,034 400,274 280,850 782,035 11 County ARC 3/ 4,967,514 4,314,666 1,912,447 1,791,664 381,987 228,568 652,848 Core 5 Counties 4/ 3,851,898 3,309,879 1,326,355 1,495,738 313,258 174,528 542,019 State less 11 County 5,744,394 5,273,785 3,449,709 1,486,455 93,693 243,928 470,609 ARC Counties: Cherokee County 266,620 234,509 197,867 17,326 5,429 13,887 32,111 Clayton County 297,595 255,049 25,902 205,301 13,491 10,355 42,546 Cobb County 766,149 654,909 369,182 200,072 42,533 43,122 111,240 DeKalb County 764,382 682,911 215,895 384,438 50,076 32,502 81,471 Douglas County 144,237 128,202 49,877 68,763 2,313 7,249 16,035 Fayette County 119,194 109,714 68,144 29,166 6,362 6,042 9,480 Forsyth County 251,283 226,057 159,407 10,455 45,117 11,078 25,226 Fulton County 1,066,710 980,408 404,793 448,803 80,632 46,180 86,302 Gwinnett County 957,062 736,602 310,583 257,124 126,526 42,369 220,460 Henry County 240,712 222,275 86,297 116,431 7,976 11,571 18,437 Rockdale County 93,570 84,030 24,500 53,785 1,532 4,213 9,540 City of Atlanta 498,715 468,727 192,148 233,018 22,442 21,119 29,988 1/ 29-County Area 2/ARC Forecast Area, including 11 ARC Counties plus Barrow, Bartow, Carroll, Coweta, 3/ As listed below 4/ Clayton, Cobb, DeKalb. Fulton, Gwinnett Source: US Census 2020, Processed by ARC Research & Analytics/ Neighborhood Nexus
  • 2. Comparative Populations: Numerical Change 2010-2020 Census Total Population Non- Hispanic White, Non- Hispanic Black, Non- Hispanic Asian, Non- Hispanic Non- Hispanic Other* Hispanic/ Latino State of GA 1,024,255 754,487 -64,977 356,883 158,995 303,586 269,768 Atlanta MSA 1/ 803,087 620,511 -31,655 327,066 140,394 184,706 182,576 21 County Area 2/ 817,517 626,440 -31,132 331,608 141,301 184,663 191,077 11 County ARC 3/ 684,253 528,484 -47,194 290,308 135,965 149,405 155,769 Core 5 Counties 4/ 486,601 366,784 -37,556 196,882 95,529 111,929 119,817 State less 11 County 340,002 226,003 -17,783 66,575 23,030 154,181 113,999 ARC Counties: Cherokee County 52,274 40,729 23,182 5,541 1,878 10,128 11,545 Clayton County 38,171 31,072 -10,900 35,833 566 5,573 7,099 Cobb County 78,071 51,161 -20,371 30,635 11,511 29,386 26,910 DeKalb County 72,489 58,842 11,715 12,098 14,314 20,715 13,647 Douglas County 11,834 6,924 -15,228 17,177 403 4,572 4,910 Fayette County 12,627 9,907 -4,216 7,944 2,142 4,037 2,720 Forsyth County 75,772 67,096 18,172 6,115 34,077 8,732 8,676 Fulton County 146,129 132,393 27,138 46,793 28,565 29,897 13,736 Gwinnett County 151,741 93,316 -45,138 71,523 40,573 26,358 58,425 Henry County 36,790 30,166 -21,106 42,052 1,927 7,293 6,624 Rockdale County 8,355 6,878 -10,442 14,597 9 2,714 1,477 City of Atlanta 78,712 70,564 39,687 8,736 9,422 12,719 8,148 1/ 29-County Area 2/ARC Forecast Area, including 11 ARC Counties plus Barrow, Bartow, Carroll, Coweta, 3/ As listed below 4/ Clayton, Cobb, DeKalb. Fulton, Gwinnett Source: US Census 2020, Processed by ARC Research & Analytics/ Neighborhood Nexus
  • 3. Historic Change: 1970-2020 Census Part I of II Total Population--Census Trends 1970 1980 1990 2000 2010 2020 Atlanta Region 1,517,751 1,924,140 2,601,883 3,527,779 4,283,261 4,967,514 Cherokee 31,059 51,699 91,000 141,903 214,346 266,620 Clayton 98,126 150,357 184,100 236,517 259,424 297,595 Cobb 196,793 297,718 453,400 607,751 688,078 766,149 DeKalb 415,387 483,024 553,800 665,865 691,893 764,382 Douglas 28,659 54,573 71,700 92,174 132,403 144,237 Fayette 11,364 29,043 62,800 91,263 106,567 119,194 Forsyth 16,928 27,958 44,083 98,400 175,511 251,283 Fulton 605,210 589,904 670,800 816,006 920,581 1,066,710 Gwinnett 72,349 166,808 356,500 588,448 805,321 957,062 Henry 23,724 36,309 59,200 119,341 203,922 240,712 Rockdale 18,152 36,747 54,500 70,111 85,215 93,570 City of Atlanta 495,039 424,922 415,200 416,474 420,003 498,175 1970 to 1980 to 1990 to 2000 to 2010 to 1980 1990 2000 2010 2020 Atlanta Region 40,639 67,774 92,590 75,548 68,425 Cherokee 2,064 3,930 5,090 7,244 5,227 Clayton 5,223 3,374 5,242 2,291 3,817 Cobb 10,093 15,568 15,435 8,033 7,807 DeKalb 6,764 7,078 11,207 2,603 7,249 Douglas 2,591 1,713 2,047 4,023 1,183 Fayette 1,768 3,376 2,846 1,530 1,263 Forsyth 1,103 1,613 5,432 7,711 7,577 Fulton -1,531 8,090 14,521 10,458 14,613 Gwinnett 9,446 18,969 23,195 21,687 15,174 Henry 1,259 2,289 6,014 8,458 3,679 Rockdale 1,860 1,775 1,561 1,510 836 City of Atlanta -7,012 -972 127 353 7,817 Average Annual Change For the 11 counties, average annual increase (numeric) in the 2010s has been strong, BUT it is less than experienced during the 2000s or 1990s—the fastest growing decade that the region has seen, and is likely to ever see.
  • 4. Average Annual Percentage Increase 1970 to 1980 to 1990 to 2000 to 2010 to 1980 1990 2000 2010 2020 Atlanta Region 2.4 3.1 3.1 2.0 1.5 Cherokee 5.2 5.8 4.5 4.2 2.2 Clayton 4.4 2.0 2.5 0.9 1.4 Cobb 4.2 4.3 3.0 1.2 1.1 DeKalb 1.5 1.4 1.9 0.4 1.0 Douglas 6.7 2.8 2.5 3.7 0.9 Fayette 9.8 8.0 3.8 1.6 1.1 Forsyth 5.1 4.7 8.4 6.0 3.7 Fulton -0.3 1.3 2.0 1.2 1.5 Gwinnett 8.7 7.9 5.1 3.2 1.7 Henry 4.3 5.0 7.3 5.5 1.7 Rockdale 7.3 4.0 2.6 2.0 0.9 City of Atlanta -1.5 -0.2 0.0 0.1 1.7 Historic Change: 1970-2020 Census Part I of II On a average annual percentage basis, growth has dropped in the last decade to the lowest rate seen over the last five decades…but it is still 1.5 percent per year! Forsyth continues to lead on this indicator as it has in the last three 10-year periods. Prior to that, it was Fayette from 1970-80 and 1980-90.
  • 5. Overall Population Change (in Percent): 2010-2020 Census 8.9% 9.8% 10.5% 11.3% 11.8% 14.7% 15.9% 16.0% 18.0% 18.7% 18.8% 24.4% 43.2% 0.0% 5.0% 10.0% 15.0% 20.0% 25.0% 30.0% 35.0% 40.0% 45.0% 50.0% Douglas County Rockdale County DeKalb County Cobb County Fayette County Clayton County Fulton County 11co Henry County City of Atlanta Gwinnett County Cherokee County Forsyth County Forsyth has been one of the fastest growing counties in the nation since the 1990s, and from 2010-2020, it led the region with a growth rate nearly 20 percentage points above that of Cherokee in second place. Douglas and Rockdale Counties were the only jurisdictions to grow by less than 10% in the decade.
  • 6. Race/ Ethnicity Shares: 2020 Census 8.7% 26.2% 28.2% 32.5% 34.6% 35.9% 37.9% 38.5% 38.5% 43.7% 48.2% 50.1% 57.2% 63.4% 74.2% 69.0% 57.5% 50.3% 26.9% 47.7% 48.4% 42.1% 36.1% 46.7% 33.2% 26.1% 30.6% 24.5% 4.2% 6.5% 4.5% 1.6% 6.6% 13.2% 1.6% 3.3% 7.6% 7.7% 4.5% 6.5% 5.6% 4.4% 5.3% 18.0% 2.0% 14.3% 10.2% 10.7% 23.0% 11.1% 7.7% 8.1% 13.1% 6.0% 12.0% 14.5% 10.5% 8.0% 10.0% 12.0% 3.5% 4.5% 4.3% 4.4% 5.0% 4.8% 4.3% 4.6% 4.3% 4.6% 5.6% 4.4% 5.1% 4.4% 5.2% 0.0% 10.0% 20.0% 30.0% 40.0% 50.0% 60.0% 70.0% 80.0% 90.0% 100.0% Clayton County Rockdale County DeKalb County Gwinnett County Douglas County Henry County Fulton County 11 county City of Atlanta Atlanta MSA Cobb County State Fayette County Forsyth County Cherokee County White, Non-Hispanic Black, Non-Hispanic Asian,Non-Hispanic Hispanic Non-Hispanic, All Other • The 2020 Census reports that only three of the eleven counties (Cherokee, Forsyth, and Fayette) are majority-White non-Hispanic , and these shares are declining quickly compared to previous Census periods. For example, Forsyth was 92% white, non-Hispanic in 1990, but has dropped to 63% as of the 2020 Census. Clayton, DeKalb, and Rockdale are over 50% Black, with Henry and Douglas just under that threshold. Nine of eleven counties are 10% Hispanic of higher, while the region’s population was at 13% as of the 2020 Census • Among the most prominent racial groups, the Asian population has grown the fastest by far in the last decade, to reach nearly 8 percent of the region’s population, and soaring to 18% of Forsyth and 13% of Gwinnett
  • 7. Percentage Point Change in Race/ Ethnicity Shares: 2010-2020 -7.3 -5.5 -8.4 -1.3 -14.6 -10.7 -17.0 -3.1 -11.7 -16.8 -14.8 2.2 -7.2 -6.0 -20.0 -15.0 -10.0 -5.0 0.0 5.0 10.0 15.0 Cherokee Clayton Cobb DeKalb Douglas Fayette Forsyth Fulton Gwinnett Henry Rockdale City of Atlanta MSA State White, Non-Hispanic Black, Non-Hispanic Asian, Non-Hispanic All Other, Non-Hispanic Hispanic • White, non-Hispanic population gained share, from 2010-2020, only in the City of Atlanta—it fell everywhere else. Five regional counties (with Forsyth the greatest at 17 percentage points drop) had declining white, non-Hispanic shares over the last decade • The share of “All Other, Non-Hispanic” grew in all areas 2010-2020—driven by gains in the number and share of people classifying as multiracial • The Black share of the population increased everywhere but DeKalb County and the City of Atlanta, though those two areas remain at or just under 50% Black. The largest share gains were in Henry and Rockdale, followed by Douglas County • Hispanic population increased modestly, gaining less than 5 percentage points in all areas.
  • 8. Percentage Change 2010-20:Population of Largest Race Groups 13.3% -29.6% -5.2% 5.7% -23.4% -5.8% 12.9% 7.2% -12.7% -19.7% -29.9% -2.4% 47.0% 21.1% 18.1% 3.2% 33.3% 37.4% 140.9% 11.6% 38.5% 56.5% 37.2% 19.3% 52.9% 4.4% 37.1% 40.0% 21.1% 50.8% 54.9% 47.2% 31.9% 0.6% 55.3% 56.1% 20.0% 31.9% 20.1% 44.1% 40.2% 52.4% 18.9% 36.1% 56.1% 18.3% 31.3% -50.0% 0.0% 50.0% 100.0% 150.0% Cherokee County Clayton County Cobb County DeKalb County Douglas County Fayette County Forsyth County Fulton County Gwinnett County Henry County Rockdale County 11 County White, Non-Hispanic Black, Non-Hispanic Asian, Non-Hispanic Hispanic 300% • Asian population increased by over 50 percent in the 11-county area from 2010-2020. Forsyth County saw a 300% increase in its Asian population, followed by Fulton at 54%, Cherokee at 53%, and Fayette at 51%. White population had an absolute decline in all counties except DeKalb and Fulton (driven by increases in the City of Atlanta). White population losses in Clayton and Rockdale approached 30%. Hispanic population grew by a third across the 11 counties, increasing by more than 50% in Henry (at 66%), Cherokee at 56%, and Forsyth at 52%.Black population more than doubled in Forsyth, and increased by more than 50 percent in Henry. And we can’t even put Non-Hispanic, Other on the same chart, so…
  • 9. 135.9% 188.5% 200.2% 203.4% 207.8% 208.2% 215.8% 217.9% 237.6% 243.7% 326.8% 446.2% 0.0% 50.0% 100.0% 150.0% 200.0% 250.0% 300.0% 350.0% 400.0% 450.0% 500.0% Clayton County Gwinnett County Henry County DeKalb County Douglas County Fulton County Rockdale County 11 county Fayette County Cobb County Cherokee County Forsyth County Percentage Increase 2010-2020: Non-Hispanic, Some Other Race, Two or More Races • The number of persons classifying as some other race or “two or more races”, with about 90% of this group stating that they were multiracial) more than quadrupled 2010-2020 in all but Gwinnett and Clayton County—and Gwinnett had the highest share of such persons in 2020 (and in 2010) • As you see, the scale just would not work compared to the increases in other racial/ ethnic groups, as rapid as most of those increases were during the 2010s!

Notas do Editor

  1. Almost 80% of the state’s net population growth 2010-2020 has been in the Atlanta MSA, and two-thirds in the 11-county area. While the state as a whole grew at 11%, the 11-county region grew at 16% (with the state outside the 11 counties growing at 6% Six of eleven region counties saw a decline in whit non-Hispanic population 2010-2020. Population in all other groups in all other counties increased over the period.
  2. Forsyth has been one of the fastest growing counties in the nation since the 1990s, and from 2010-2020, it led the region with a growth rate nearly 20 percentage points above that of Cherokee in second place. Douglas and Rockdale Counties were the only jurisdictions to grow by less than 10% in the decade.
  3. Forsyth has been one of the fastest growing counties in the nation since the 1990s, and from 2010-2020, it led the region with a growth rate nearly 20 percentage points above that of Cherokee in second place. Douglas and Rockdale Counties were the only jurisdictions to grow by less than 10% in the decade.
  4. Forsyth has been one of the fastest growing counties in the nation since the 1990s, and from 2010-2020, it led the region with a growth rate nearly 20 percentage points above that of Cherokee in second place. Douglas and Rockdale Counties were the only jurisdictions to grow by less than 10% in the decade.
  5. The 2020 Census reports that only three of the eleven counties (Cherokee, Forsyth, and Fayette) are majority-White non-Hispanic , and these shares are declining quickly compared to previous Census periods. For example, Forsyth was 92% white, non-Hispanic in 1990, but has dropped to 63% as of the 2020 Census. Clayton, DeKalb, and Rockdale are over 50% Black, with Henry and Douglas just under that threshold Nine of eleven counties are 10% Hispanic of higher, while the region’s population was at 13% as of the 2020 Census Among the most prominent racial groups, the Asian population has grown the fastest by far in the last decade, to reach nearly 8 percent of the region’s population, and soaring to 18% of Forsyth and 13% of Gwinnett
  6. White, non-Hispanic population gained share, from 2010-2020, only in the City of Atlanta—it fell everywhere else. Five regional counties (with Forsyth the greatest at 17 percentage points drop) had declining white, non-Hispanic shares over the last decade The share of “All Other, Non-Hispanic” grew in all areas 2010-2020—driven by gains in the number and share of people classifying as multiracial The Black share of the population increased everywhere but DeKalb County and the City of Atlanta, though those two areas remain at or just under 50% Black. The largest share gains were in Henry and Rockdale, followed by Douglas County Hispanic population increased modestly, gaining less than 5 percentage points in all areas.
  7. Asian population increased by over 50 percent in the 11-county area from 2010-2020. Forsyth County saw a 300% increase in its Asian population, followed by Fulton at 54%, Cherokee at 53%, and Fayette at 51%. White population had an absolute decline in all counties except DeKalb and Fulton (driven by increases in the City of Atlanta). White population losses in Clayton and Rockdale approached 30%. Hispanic population grew by a third across the 11 counties, increasing by more than 50% in Henry (at 66%), Cherokee at 56%, and Forsyth at 52% Black population more than doubled in Forsyth, and increased by more than 50 percent in Henry And we can’t even put Non-Hispanic, Other on the same chart, so…
  8. The number of persons classifying as some other race or “two or more races”, with about 90% of this group stating that they wee multiracial) more than quadrupled 2010-2020 in all but Gwinnett and Clayton County—and Gwinnett had the highest share of such persons in 2020 (and in 2010) As you see, the scale just would not work compared to the increases in other racial/ etnic groups, as rapid as most of those were