Home Sales Pop in March - Real Estate Report April/May
•
0 gostou•698 visualizações

The Robb Fleischer’s Real Estate Report – Local Market Trends San Francisco includes monthly updates regarding mortgage rates, market statistics, sales momentum, pricing momentum, trends at a glance, foreclosure statistics and more.

Recomendados
Recomendados
Mais conteúdo relacionado
Mais procurados
Mais procurados (20)
Semelhante a Home Sales Pop in March - Real Estate Report April/May
Semelhante a Home Sales Pop in March - Real Estate Report April/May (20)
Último
Último (20)
Home Sales Pop in March - Real Estate Report April/May
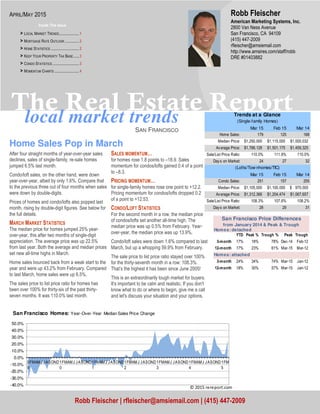
- 1. local market trends The Real Estate Report SAN FRANCISCO Home Sales Pop in March After four straight months of year-over-year sales declines, sales of single-family, re-sale homes jumped 6.5% last month. Condo/loft sales, on the other hand, were down year-over-year, albeit by only 1.6%. Compare that to the previous three out of four months when sales were down by double-digits. Prices of homes and condo/lofts also popped last month, rising by double-digit figures. See below for the full details. MARCH MARKET STATISTICS The median price for homes jumped 25% year- over-year, this after two months of single-digit appreciation. The average price was up 22.5% from last year. Both the average and median prices set new all-time highs in March. Home sales bounced back from a weak start to the year and were up 43.2% from February. Compared to last March, home sales were up 6.5%. The sales price to list price ratio for homes has been over 100% for thirty-six of the past thirty- seven months. It was 110.0% last month. SALES MOMENTUM… for homes rose 1.8 points to –18.9. Sales momentum for condos/lofts gained 0.4 of a point to –8.3. PRICING MOMENTUM… for single-family homes rose one point to +12.2. Pricing momentum for condos/lofts dropped 0.2 of a point to +12.53. CONDO/LOFT STATISTICS For the second month in a row, the median price of condos/lofts set another all-time high. The median price was up 0.5% from February. Year- over-year, the median price was up 13.9%. Condo/loft sales were down 1.6% compared to last March, but up a whopping 59.9% from February. The sale price to list price ratio stayed over 100% for the thirty-seventh month in a row: 108.3%. That’s the highest it has been since June 2005! This is an extraordinarily tough market for buyers. It's important to be calm and realistic. If you don't know what to do or where to begin, give me a call and let's discuss your situation and your options. American Marketing Systems, Inc. 2800 Van Ness Avenue San Francisco, CA 94109 (415) 447-2009 rfleischer@amsiemail.com http://www.amsires.com/staff/robb DRE #01403882 Robb Fleischer Robb Fleischer | rfleischer@amsiemail.com | (415) 447-2009 APRIL/MAY 2015 Inside This Issue > LOCAL MARKET TRENDS.....................1 > MORTGAGE RATE OUTLOOK ...............2 > HOME STATISTICS ..............................2 > KEEP YOUR PROPERTY TAX BASE......3 > CONDO STATISTICS ............................3 > MOMENTUM CHARTS ..........................4 Mar 15 Feb 15 Mar 14 Home Sales: 179 125 168 Median Price: 1,250,000$ 1,115,000$ 1,000,032$ Average Price: 1,788,128$ 1,501,175$ 1,459,325$ Sale/List Price Ratio: 110.0% 111.8% 110.0% Days on Market: 24 27 32 Mar 15 Feb 15 Mar 14 Condo Sales: 251 157 255 Median Price: 1,105,000$ 1,100,000$ 970,000$ Average Price: 1,312,366$ 1,204,474$ 1,067,657$ Sale/List Price Ratio: 108.3% 107.6% 108.2% Days on Market: 28 29 31 (Lofts/Tow nhomes/TIC) Trends at a Glance (Single-family Homes) Homes: detached YTD Peak % Trough % Peak Trough 3-month 17% 18% 78% Dec-14 Feb-12 12-month 17% 23% 61% Mar-15 Mar-12 Homes: attached 3-month 24% 34% 74% Mar-15 Jan-12 12-month 18% 30% 57% Mar-15 Jan-12 San Francisco Price Differences from January 2014 & Peak & Trough -40.0% -30.0% -20.0% -10.0% 0.0% 10.0% 20.0% 30.0% 40.0% 50.0% 0 9 FMAMJ JASOND1 0 FMAMJ JASOND1 1 FMAMJ JASOND1 2 FMAMJ JASOND1 3 FMAMJ JASOND1 4 FMAMJ JASOND1 5 FM San Francisco Homes: Year-Over-Year Median Sales Price Change © 2015 rereport.com
- 2. Page 2 The Real Estate Report The chart above shows the Na- tional monthly average for 30- year fixed rate mortgages as compiled by HSH.com. The av- erage includes mortgages of all sizes, including conforming, "expanded conforming," and jumbo. MORTGAGE RATE OUTLOOK Economy Not Cooperating, Mortgage Rates To Ease Apr 3, 2015 -- HSH.com's broad-market mortgage tracker -- our weekly Fixed-Rate Mortgage Indicator (FRMI) -- found the overall average rate for 30-year fixed-rate mortgages remained unchanged this week, at 3.81%. The FRMI's 15-year companion managed a small decline of single basis point to 3.15%. Rates on fully-insured FHA-backed 30-year FRMs remain well below their conforming counterparts but sported a decline of two basis points this week to an average rate of 3.63%. Finally, the overall 5/1 Hybrid ARM fell by four basis points (0.04%), slumping to 2.93% on average for the week. All these mortgage products are either at or very near 2015 lows as the traditional spring home buying season begins to kick in. Construction spending failed to ignite in February, declining by 0.1%, so the year began with two con- secutive declines in outlays. There was a 0.2% fall in spending for residential projects during the month, and an 0.8% slide in public works spending, but com- mercial building managed a 0.5% gain after a tough January. Total spending is modestly above last year at this time, revealing a 2.1% gain when comparing the two periods. With sales of new homes appearing to pick up in recent months, we should start to see a larger contribution from residential spending. Despite an on-going mixed bag of economic news, consumers were a bit more confident about their situations in March, according to the Conference Board. Their index of Consumer Confidence rose by 2.5 points during the month, recapturing half of Feb- ruary's dip. Although assessments of current condi- tions were more pessimistic, optimism about the days yet to come rebounded, so there is some belief that there is more light at the end of a somewhat dimmer tunnel. Sending plans were mixed, with a gain in expectations for the purchase of a car, but a slump in those considering buying a home. The Fed has made it as clear as it can that rates will be rising before long. Even with a indeterminate and changing expected starting point, that there will be a starting point before long is sufficient to keep mort- gage rates from falling by much (absent some new economic calamity, domestically or elsewhere). There should be some softness for mortgage rates as we move into next week, when we'll get a look at the strength of service business activity, measures of consumer borrowing and import prices and a couple of other items. On balance, and even if extraordinar- ily strong, there's probably not enough data due out next week to cause a lift in rates, so we're more likely to shed a couple more basis points from these levels. 0 50 100 150 200 250 300 350 $300 $500 $700 $900 $1,100 $1,300 $1,500 $1,700 0 9 FMAMJ JASOND1 0 FMAMJ JASOND1 1 FMAMJ JASOND1 2 FMAMJ JASOND1 3 FMAMJ JASOND1 4 FMAMJ JASOND1 5 FM San Francisco Homes: Sold Prices & Unit Sales (3-month moving average — $000's) Ave Med Units © 2015 rereport.com Unit Median Average Sales DOM SP/LP Median Average Sales Median Average Sales San Francisco 1,250,000$ 1,788,128$ 179 24 110.0% 25.0% 22.5% 6.5% 12.1% 19.1% 43.2% D1: Northwest 2,075,000$ 2,186,008$ 18 18 107.8% 64.3% 39.8% 50.0% 30.9% 30.0% 50.0% D2: Central West 1,130,025$ 1,194,169$ 31 19 116.6% 18.6% 22.5% -13.9% 2.7% 13.4% 82.4% D3: Southwest 905,000$ 937,000$ 7 50 123.1% 21.8% 12.7% -30.0% 20.7% 6.6% 40.0% D4: Twin Peaks 1,141,500$ 1,687,656$ 16 27 109.1% -15.8% 12.4% -38.5% -7.0% 35.5% -15.8% D5: Central 2,252,500$ 2,509,083$ 34 17 108.6% -10.1% -5.4% 36.0% 17.6% 23.0% 100.0% D6: Central North -$ -$ 0 0 0.0% n/a n/a n/a n/a n/a n/a D7: North 5,087,500$ 5,097,208$ 12 19 107.5% 13.1% 14.5% 71.4% -15.1% -20.0% 140.0% D8: Northeast 1,655,000$ 1,655,000$ 2 32 106.7% -74.5% -74.5% 100.0% -33.8% -33.8% 100.0% D9: Central East 1,425,000$ 1,492,071$ 21 21 112.5% 16.8% 24.0% 75.0% 6.7% 4.5% -8.7% D10: Southeast 775,000$ 764,629$ 37 37 110.5% 20.2% 16.8% -5.1% 10.7% 5.2% 48.0% March Sales Statistics (Single-family Homes) Prices Yearly Change Monthly Change 3.0% 4.0% 5.0% 6.0% 7.0% 8.0% 01-08 04-08 07-08 10-08 01-09 04-09 07-09 10-09 01-10 04-10 07-10 10-10 01-11 04-11 07-11 10-11 01-12 04-12 07-12 10-12 01-13 04-13 07-13 10-13 01-14 04-14 07-14 10-14 01-15 30-Year Fixed Mortgage Rates
- 3. Table Definitions _______________ Median Price The price at which 50% of prices were higher and 50%were lower. Average Price Add all prices and divide by the number of sales. SP/LP Sales price to list price ratio or the price paid for the property divided by the asking price. DOI Days of Inventory, or how many days it would take to sell all the property for sale at the current rate of sales. Pend Property under contract to sell that hasn’t closed escrow. Inven Number of properties actively for sale as of the last day of the month. Under Proposition 60, California homeowners 55 and older get a one-time chance to sell their primary resi- dence and transfer its property-tax assessment to a new one, but the market value of the new home gener- ally must be equal to or less than the market value of the old home. Prop. 60 was designed to help longtime California homeowners who want to downsize but don't want to give up the low property-tax assessment they enjoy in their existing home. Under Proposition 13, homes are reassessed for prop- erty-tax purposes when there is a change in ownership or new construction. In between ownership changes, the assessed value can go up by an inflation rate not to exceed 2% a year. (Homeowners can get temporary reductions when property values go down.) KEEP YOUR PROPERTY TAX BASE Prop. 60 lets homeowners 55 or older transfer their base-year value from an existing primary residence to a new primary residence, but there are restrictions. The new home must be in the same county as the old one or in one of ten counties that accept transfers of base-year value from other counties. The ten counties are: Alameda, El Dorado, Los Angeles, Orange, River- side, San Bernardino, San Diego, San Mateo, Santa Clara, and Ventura. Also, the new home must be purchased or built within two years - before or after - the sale of the original prop- erty. If the new house is purchased before the old house is sold, the market value of the new house on its purchase date cannot exceed 100% of the old home's market value on the date it is sold. 0 50 100 150 200 250 300 350 $300 $500 $700 $900 $1,100 $1,300 0 9 FMAMJ JASOND1 0 FMAMJ JASOND1 1 FMAMJ JASOND1 2 FMAMJ JASOND1 3 FMAMJ JASOND1 4 FMAMJ JASOND1 5 FM San Francisco Condos: Sold Prices & Unit Sales (3-month moving average — $000's) Ave Med Units © 2015 rereport.com -30.0% -20.0% -10.0% 0.0% 10.0% 20.0% 30.0% 40.0% 0 9 FMAMJ JASOND1 0 FMAMJ JASOND1 1 FMAMJ JASOND1 2 FMAMJ JASOND1 3 FMAMJ JASOND1 4 FMAMJ JASOND1 5 FM San Francisco Condos/Lofts: Year-Over-Year Median Sales Price Change © 2015 rereport.com Unit Median Average Sales DOM SP/LP Median Average Sales Median Average Sales San Francisco 1,105,000$ 1,312,366$ 251 28 108.3% 13.9% 22.9% -1.6% 0.5% 9.0% 59.9% D1: Northwest 1,225,000$ 1,414,750$ 8 14 110.3% 11.4% 33.1% -11.1% 28.9% 50.3% -11.1% D2: Central West 760,000$ 760,000$ 1 30 117.1% -13.6% -13.6% -50.0% -5.6% -22.1% -66.7% D3: Southwest 545,000$ 545,000$ 2 14 111.9% 14.7% -2.6% -33.3% n/a n/a n/a D4: Twin Peaks 600,000$ 600,000$ 1 13 133.6% -3.2% -7.3% -75.0% -28.6% -21.7% -66.7% D5: Central 1,070,000$ 1,281,578$ 49 24 113.6% 1.0% 18.2% -3.9% -2.7% 14.0% 113.0% D6: Central North 1,000,000$ 1,138,536$ 29 26 114.5% 8.6% 15.6% 0.0% 12.4% 25.5% 61.1% D7: North 1,626,500$ 1,743,928$ 24 14 114.2% 27.1% 12.9% 26.3% -4.6% 3.7% 20.0% D8: Northeast 1,354,166$ 1,573,644$ 30 35 102.0% 53.0% 47.8% -45.5% 20.9% 15.5% 20.0% D9: Central East 1,099,000$ 1,250,608$ 101 35 104.7% 15.1% 19.3% 27.8% -4.4% 3.9% 90.6% D10: Southeast 825,000$ 741,000$ 6 23 105.8% 75.5% 42.0% 100.0% 19.9% 7.7% 200.0% March Sales Statistics (Condos/TICs/Co-ops/Lofts) Prices Yearly Change Monthly Change
- 4. The Real Estate Market Trends Report is published and copyrighted by http://rereport.com. THE REAL ESTATE REPORT San Francisco Robb Fleischer American Marketing Systems, Inc. 2800 Van Ness Avenue San Francisco, CA 94109 Go online to see the full report with the district by district breakdown: HTTP://WWW.AMSIRES.COM/STAFF/ROBB -25.0 -20.0 -15.0 -10.0 -5.0 0.0 5.0 10.0 15.0 20.0 25.0 0 8 FMAMJJASOND0 9 FMAMJJASOND1 0 FMAMJJASOND1 1 FMAMJJASOND1 2 FMAMJJASOND1 3 FMAMJJASOND1 4 FMAMJJASOND1 5 FM San Francisco Homes: Sales Momentum Sales Pricing © 2015 rereport.com -50.0 -40.0 -30.0 -20.0 -10.0 0.0 10.0 20.0 30.0 40.0 0 8 FMAMJJASOND0 9 FMAMJJASOND1 0 FMAMJJASOND1 1 FMAMJJASOND1 2 FMAMJJASOND1 3 FMAMJJASOND1 4 FMAMJJASOND1 5 FM San Francisco Condos/Lofts: Sales Momentum Sales Pricing © 2015 rereport.com