Recovery Continues - The Real Estate Report April/May
•
0 gostou•297 visualizações

The Real Estate Report April/May, local market trends San Francisco: "Recovery Continues " by AMSI's Real Estate Broker Robb Fleischer

Recomendados
Recomendados
Mais conteúdo relacionado
Mais procurados
Mais procurados (20)
Destaque
Destaque (11)
Semelhante a Recovery Continues - The Real Estate Report April/May
Semelhante a Recovery Continues - The Real Estate Report April/May (11)
Último
Último (20)
Recovery Continues - The Real Estate Report April/May
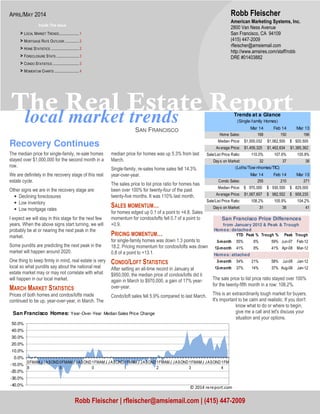
- 1. local market trends The Real Estate Report SAN FRANCISCO The sale price to list price ratio stayed over 100% for the twenty-fifth month in a row: 108.2%. This is an extraordinarily tough market for buyers. It's important to be calm and realistic. If you don't know what to do or where to begin, give me a call and let's discuss your situation and your options. Recovery Continues The median price for single-family, re-sale homes stayed over $1,000,000 for the second month in a row. We are definitely in the recovery stage of this real estate cycle. Other signs we are in the recovery stage are: • Declining foreclosures • Low inventory • Low mortgage rates I expect we will stay in this stage for the next few years. When the above signs start turning, we will probably be at or nearing the next peak in the market. Some pundits are predicting the next peak in the market will happen around 2020. One thing to keep firmly in mind, real estate is very local so what pundits say about the national real estate market may or may not correlate with what will happen in our local market. MARCH MARKET STATISTICS Prices of both homes and condos/lofts made continued to be up, year-over-year, in March. The median price for homes was up 5.3% from last March. Single-family, re-sales home sales fell 14.3% year-over-year. The sales price to list price ratio for homes has been over 100% for twenty-four of the past twenty-five months. It was 110% last month. SALES MOMENTUM… for homes edged up 0.1 of a point to +4.8. Sales momentum for condos/lofts fell 0.7 of a point to +0.9. PRICING MOMENTUM… for single-family homes was down 1.3 points to 18.2. Pricing momentum for condos/lofts was down 0.8 of a point to +13.1. CONDO/LOFT STATISTICS After setting an all-time record in January at $950,000, the median price of condos/lofts did it again in March to $970,000, a gain of 17% year- over-year. Condo/loft sales fell 5.9% compared to last March. American Marketing Systems, Inc. 2800 Van Ness Avenue San Francisco, CA 94109 (415) 447-2009 rfleischer@amsiemail.com http://www.amsires.com/staff/robb DRE #01403882 Robb Fleischer Robb Fleischer | rfleischer@amsiemail.com | (415) 447-2009 APRIL/MAY 2014 Inside This Issue > LOCAL MARKET TRENDS.....................1 > MORTGAGE RATE OUTLOOK ...............2 > HOME STATISTICS ..............................2 > FORECLOSURE STATS ........................3 > CONDO STATISTICS ............................3 > MOMENTUM CHARTS ..........................4 Mar 14 Feb 14 Mar 13 Home Sales: 168 150 196 Median Price: 1,000,032$ 1,062,500$ 920,500$ Average Price: 1,459,325$ 1,462,634$ 1,385,362$ Sale/List Price Ratio: 110.0% 107.6% 105.8% Days on Market: 32 37 38 Mar 14 Feb 14 Mar 13 Condo Sales: 255 210 271 Median Price: 970,000$ 930,500$ 829,000$ Average Price: 1,067,657$ 982,552$ 958,235$ Sale/List Price Ratio: 108.2% 105.9% 104.2% Days on Market: 31 38 41 (Lofts/Tow nhomes/TIC) Trends at a Glance (Single-family Homes) Homes: detached YTD Peak % Trough % Peak Trough 3-month 55% 6% 59% Jun-07 Feb-12 12-month 41% 8% 41% Apr-08 Mar-12 Homes: attached 3-month 54% 21% 58% Jul-08 Jan-12 12-month 37% 14% 37% Aug-08 Jan-12 San Francisco Price Differences from January 2012 & Peak & Trough -40.0% -30.0% -20.0% -10.0% 0.0% 10.0% 20.0% 30.0% 40.0% 50.0% 0 8 FMAMJ JASOND0 9 FMAMJ JASOND1 0 FMAMJ JASOND1 1 FMAMJ JASOND1 2 FMAMJ JASOND1 3 FMAMJ JASOND1 4 FM San Francisco Homes: Year-Over-Year Median Sales Price Change © 2014 rereport.com
- 2. Page 2 The Real Estate Report The chart above shows the Na- tional monthly average for 30- year fixed rate mortgages as compiled by HSH.com. The av- erage includes mortgages of all sizes, including conforming, "expanded conforming," and jumbo. MORTGAGE RATE OUTLOOK Apr 4, 2014 -- The freshest economic indicators suggest that we are starting to move away from any weather- related holdback in growth, but it looks as though it will be more of a "slipping away from" than a "shaking off" process. Although even the first estimate for first quarter 2014 GDP growth is still weeks away, present expectations are that we are unlikely to see a reading of even the 2.6 percent rate attained in the fourth quarter of last year. However, much of the weakness seems to have occurred in the first two months of the year, with the economy in March finding a few more spots of traction amid the melting ice and snow. Should this pattern persist, and it looks as though it may, we are likely to see growth in the second quar- ter move higher, but it will be summer before we know for sure. Before the "official" number comes, we should have plenty of evidence one way or the other. If this is the case, somewhat firmer mortgage rates are more likely as we go. At the moment, though, we remain fairly rangebound at levels seen back in January, but remain below 2014 highs. HSH.com's broad-market mortgage tracker -- our weekly Fixed-Rate Mortgage Indicator (FRMI) -- found the overall average rate for 30-year fixed-rate mortgages rose by a single basis points (0.01%) to land at 4.49%, its highest level since late January. The FRMI's 15-year companion also added one basis point, climbing to 3.63% for the week. Popular FHA- backed 30-year FRMs rose by just two basis points, rising to 4.16% for the period, as these fully-insured loans continue to have the lowest prices in the mar- ket by a fair margin. Finally, the overall 5/1 Hybrid ARM increased by just one one-hundredths of a per- centage point (0.01%), climbing to 3.18% for the week. Construction spending didn't add much to the eco- nomic tally in February, rising by a scant 0.1 percent. Spending on residential projects was off by 0.8 per- cent. To the extent that weather affected the con- struction numbers here, we may see a move higher when March data become available early next month. We may see a little settling of rates next week, possi- bly a slight decline of a couple of basis points. 0 50 100 150 200 250 300 350 $300 $500 $700 $900 $1,100 $1,300 $1,500 0 8 FMAMJ JASOND0 9 FMAMJ JASOND1 0 FMAMJ JASOND1 1 FMAMJ JASOND1 2 FMAMJ JASOND1 3 FMAMJ JASOND1 4 FM San Francisco Homes: Sold Prices & Unit Sales (3-month moving average — $000's) Ave Med Units © 2014 rereport.com Unit Median Average Sales DOM SP/LP Median Average Sales Median Average Sales San Francisco 1,000,032$ 1,459,325$ 168 32 110.0% 8.6% 5.3% -14.3% -5.9% -0.2% 12.0% D1: Northwest 1,263,000$ 1,564,083$ 12 54 106.0% 0.2% 7.9% -29.4% 2.3% 10.5% 0.0% D2: Central West 952,500$ 974,637$ 36 33 112.4% 16.9% 3.4% 9.1% 6.8% 10.5% 111.8% D3: Southwest 743,000$ 831,600$ 10 40 114.7% 43.4% 59.1% 233.3% 6.1% 1.2% -28.6% D4: Twin Peaks 1,355,000$ 1,501,962$ 26 27 110.9% 26.9% 25.4% 4.0% 23.4% 22.7% 36.8% D5: Central 2,505,000$ 2,652,171$ 25 16 115.1% 55.7% 45.2% -34.2% 8.9% 23.2% 0.0% D6: Central North -$ -$ 0 0 0.0% n/a n/a n/a n/a n/a n/a D7: North 4,500,000$ 4,452,714$ 7 14 99.7% 5.9% -4.5% -46.2% -9.8% -22.0% 16.7% D8: Northeast 6,500,000$ 6,500,000$ 1 12 100.0% 124.1% 124.1% -50.0% 124.1% 140.2% -75.0% D9: Central East 1,220,000$ 1,203,750$ 12 33 113.6% 21.0% 17.7% -29.4% -2.6% -6.4% -33.3% D10: Southeast 645,000$ 654,499$ 39 37 109.4% 18.0% 19.8% -11.4% 2.0% 6.1% 39.3% March Sales Statistics (Single-family Homes) Prices Yearly Change Monthly Change 3.0% 4.0% 5.0% 6.0% 7.0% 8.0% 01-06 04-06 07-06 10-06 01-07 04-07 07-07 10-07 01-08 04-08 07-08 10-08 01-09 04-09 07-09 10-09 01-10 04-10 07-10 10-10 01-11 04-11 07-11 10-11 01-12 04-12 07-12 10-12 01-13 04-13 07-13 10-13 01-14 30-Year Fixed Mortgage Rates
- 3. Table Definitions _______________ Median Price The price at which 50% of prices were higher and 50%were lower. Average Price Add all prices and divide by the number of sales. SP/LP Sales price to list price ratio or the price paid for the property divided by the asking price. DOI Days of Inventory, or how many days it would take to sell all the property for sale at the current rate of sales. Pend Property under contract to sell that hasn’t closed escrow. Inven Number of properties actively for sale as of the last day of the month. Notices of default, the first step in the foreclosure proc- ess, in San Francisco continues to drop. They were down 4.7% in February from January. Year-over-year, notices were down 11.1%. There were 40 notices in February. Notices of sale, which set the date and time of an auc- tion, and serve as the homeowner's final notice before sale, dropped 45.1% from January, and they were down 63.2% year-over-year. There were 31. After the filing of a Notice of Trustee Sale, there are only three possible outcomes. First, the sale can be cancelled for reasons that include a successful loan modification or short sale, a filing error, or a legal re- quirement to re-file the notice after extended postpone- ments. FORECLOSURE STATISTICS Alternatively, if the property is taken to sale, the bank will place the opening bid. If a third party, typically an investor, bids more than the bank's opening bid, the property will be sold to the third party; if not, it will go back to the bank. There were 26 sales cancelled last month. Only five homes went back to the bank in February. There are currently 124 properties scheduled for sale. With the recent surge in prices, many of them will probably be cancelled. The total number of properties owned by the banks was down 35.1% year-over-year. The banks now own ap- proximately 239 properties in the city. 0 50 100 150 200 250 300 350 $300 $400 $500 $600 $700 $800 $900 $1,000 $1,100 0 8 FMAMJ JASOND0 9 FMAMJ JASOND1 0 FMAMJ JASOND1 1 FMAMJ JASOND1 2 FMAMJ JASOND1 3 FMAMJ JASOND1 4 FM San Francisco Condos: Sold Prices & Unit Sales (3-month moving average — $000's) Ave Med Units © 2014 rereport.com -30.0% -20.0% -10.0% 0.0% 10.0% 20.0% 30.0% 40.0% 0 8 FMAMJ JASOND0 9 FMAMJ JASOND1 0 FMAMJ JASOND1 1 FMAMJ JASOND1 2 FMAMJ JASOND1 3 FMAMJ JASOND1 4 FM San Francisco Condos/Lofts: Year-Over-Year Median Sales Price Change © 2014 rereport.com Unit Median Average Sales DOM SP/LP Median Average Sales Median Average Sales San Francisco 970,000$ 1,067,657$ 255 31 108.2% 17.0% 11.4% -5.9% 4.2% 8.7% 21.4% D1: Northwest 1,100,000$ 1,063,222$ 9 32 110.0% 17.7% 7.4% -35.7% 8.8% 12.5% 0.0% D2: Central West 880,000$ 880,000$ 2 25 103.2% 46.7% 13.1% -33.3% 8.6% 8.6% 0.0% D3: Southwest 475,000$ 559,333$ 3 48 114.1% 23.2% 47.7% -40.0% 15.9% 36.4% 0.0% D4: Twin Peaks 620,000$ 647,000$ 4 24 109.3% 18.2% 12.9% -33.3% 3.5% 8.4% -20.0% D5: Central 1,059,000$ 1,084,124$ 51 29 111.3% 16.4% 14.1% 34.2% -0.3% -0.3% 82.1% D6: Central North 921,000$ 985,196$ 29 29 110.3% 26.7% 31.4% -21.6% 27.0% 28.6% 45.0% D7: North 1,280,000$ 1,545,243$ 19 17 112.5% 8.9% 17.9% -60.4% -6.2% 21.3% 26.7% D8: Northeast 885,000$ 1,065,039$ 55 41 105.8% -14.1% -10.0% 52.8% -2.7% -2.0% 66.7% D9: Central East 955,000$ 1,048,048$ 79 28 105.9% 21.7% 25.8% -2.5% -2.6% 5.3% -12.2% D10: Southeast 470,000$ 521,667$ 3 27 100.5% 47.8% 64.0% 200.0% 6.3% 56.0% -40.0% March Sales Statistics (Condos/TICs/Co-ops/Lofts) Prices Yearly Change Monthly Change
- 4. The Real Estate Market Trends Report is published and copyrighted by http://rereport.com. THE REAL ESTATE REPORT San Francisco Robb Fleischer American Marketing Systems, Inc. 2800 Van Ness Avenue San Francisco, CA 94109 Go online to see the full report with the district by district breakdown: HTTP://WWW.AMSIRES.COM/STAFF/ROBB -25.0 -20.0 -15.0 -10.0 -5.0 0.0 5.0 10.0 15.0 20.0 25.0 0 8 FMAMJ JASOND0 9 FMAMJ JASOND1 0 FMAMJ JASOND1 1 FMAMJ JASOND1 2 FMAMJ JASOND1 3 FMAMJ JASOND1 4 FM San Francisco Homes: Sales Momentum Sales Pricing © 2014 rereport.com -50.0 -40.0 -30.0 -20.0 -10.0 0.0 10.0 20.0 30.0 40.0 0 8 FMAMJ JASOND0 9 FMAMJ JASOND1 0 FMAMJ JASOND1 1 FMAMJ JASOND1 2 FMAMJ JASOND1 3 FMAMJ JASOND1 4 FM San Francisco Condos/Lofts: Sales Momentum Sales Pricing © 2014 rereport.com