SlideShare uma empresa Scribd logo
1 de 3
Baixar para ler offline
© ABCi 2019
What is a Runchart?
In contrast to data collected before and after a change,
runcharts enable you to assess the effectiveness of each
individual change or PDSA cycle in real-time and use this
information to build knowledge of what works and what
doesn’t. It enables you to evaluate whether you are
achieving your aim (outcome) or that your processes are
reliable. This guide will enable you to understand the
variation that lives within your runchart, interpret it
accurately in order for you to make the appropriate
conclusions.
See also ‘Creating Runcharts’ & ‘Using
Runcharts’ Skills for Improvement Guides
(2/3)
See ‘Creating Runcharts (1/3)’ for instructions to construct runcharts in Microsoft Excel, also for
further details around the components of a runchart, when you would use these and their benefits.
See ‘Using Runcharts (3/3)’ to understand how to use runcharts in practice, plotting new data and
recalculating your median to represent non-random variation in your data.
Why is understanding variation so important?
All systems exhibit variation, this may result from the many interactions or flaws that are built into the
system. It is important to understand the variation within your system as this will enable you to make
appropriate conclusions and decisions based on your data. Your runchart will demonstrate either
random or non-random variation or even both.
• Non-random variation is usually caused by a known factor. Something has changed in your process
that varies your data. Non-random variation means that your process has become unstable, meaning
that it is less predictable. When improving something, you will destabilise the current process and
demonstrate non-random variation in your data in the appropriate direction (e.g. reducing delays or
increasing compliance), you would want this improvement to be sustained and become stable.
In order to interpret the variation in your runchart, you need to understand four rules. Should your
data trigger one of these rules, your data is demonstrating non-random variation (see next page).
Should your data not trigger one of the rules, your data is demonstrating random variation (see
runchart above).
• Random variation is data that displays irregular or
erratic fluctuations, that are based on chance. This data
shows that your process is stable, not changing in any
way unless something is applied to change it. You decide
if you are happy with the stable process running at this
level or if it needs to improve.
Interpreting
Runcharts
(2/3)
ABC
improvement
iSkills for
© ABCi 2019
What are the runchart rules?
There are four rules to determine whether your runchart is exhibiting random or non-random variation.
If a rule is triggered, the data is demonstrating non-random variation.
A Shift - 6 or more data points above or below the
median. Given there is a 50% probability of a data
point being above or below the median (p = 0.016), it
is extremely unlikely that 6 in a row is due to luck.
Any data point falling on the median will not break a
shift, but will not be counted as part of the 6 to make
the shift.
A Trend - 5 or more points consecutively going up or
down. If two or more consecutive points are exactly
the same value, this is not enough to break the trend
but will not be counted as part of the 5 that makes up
the trend.
Too many or too few runs – A non-random pattern
may be signalled by too many or too few runs. A run
is the amount of times the line crosses the median
plus 1, or how many times the line is above or below
the median.
Of note, if there are too many runs, consider if the
data on the graph is from multiple processes, e.g. day
shift & night shift, or weekday & weekend.
 Count the number of data points on the runchart and look this up on the table on the next page.
Lookup the corresponding upper and lower limits for the number of runs.
 Count the number of runs, this is the number of times the line crosses beyond the median plus 1, or
the total number of times the line is either above or below the median.
 If the number of runs falls within the range between the lower and upper limit – this is random
variation.
 If the number of runs falls outside the range between the lower and upper limit – this is non-random
variation
 The graph above has 25 data points, looking this up on the table below, for the data to show random
variation there should be between 8 and 18 runs. There are 6 runs (line crossing the median) in the
graph above and because this falls outside the 8-18 range, this graph is exhibiting non-random
variation.
© ABCi 2019
Number
data points
on run chart
Lower limit
for number
of runs
Upper limit
for number
of runs
10 3 9
11 3 10
12 3 11
13 4 11
14 4 12
15 5 12
16 5 13
17 5 13
18 6 14
19 6 15
20 6 16
21 7 16
22 7 17
23 7 17
24 8 18
25 8 18
Number
data points
on run chart
Lower limit
for number
of runs
Upper limit
for number
of runs
26 9 19
27 10 19
28 10 20
29 10 20
30 11 21
31 11 22
32 11 23
33 12 23
34 12 24
35 12 24
36 13 25
37 13 25
38 14 26
39 14 26
40 15 27
An Astronomical Point –
 Anyone eyeballing the chart would agree that an
astronomical point is beyond the normal range
 Caution: Every data set will have a highest or
lowest point. This doesn’t mean that it is
astronomical

Mais conteúdo relacionado

Mais procurados

Pareto Diagrams
Pareto DiagramsPareto Diagrams
Pareto DiagramsDeborah_W
 
how quality tools are used to monitor and control the quality of an organizat...
how quality tools are used to monitor and control the quality of an organizat...how quality tools are used to monitor and control the quality of an organizat...
how quality tools are used to monitor and control the quality of an organizat...AnkonRoy2
 
Tools of total quality management
Tools of total quality managementTools of total quality management
Tools of total quality managementTommie0607
 
Quality tools by Er. Manish Dwivedi
Quality tools by Er. Manish DwivediQuality tools by Er. Manish Dwivedi
Quality tools by Er. Manish DwivediEr. Manish Dwivedi
 
Problem Solving Tools - Susan
Problem Solving Tools - SusanProblem Solving Tools - Susan
Problem Solving Tools - Susanelsanora
 
Pareto chart importance & making
Pareto chart importance & makingPareto chart importance & making
Pareto chart importance & makingKamleshwar Pandey
 
Exploring data stemplot
Exploring data   stemplotExploring data   stemplot
Exploring data stemplotUlster BOCES
 
Managing change risk in Excel spreadsheets
Managing change risk in Excel spreadsheetsManaging change risk in Excel spreadsheets
Managing change risk in Excel spreadsheetsExcelForManagers.com
 
7 QC Tools PowerPoint Presentation Slides
7 QC Tools PowerPoint Presentation Slides 7 QC Tools PowerPoint Presentation Slides
7 QC Tools PowerPoint Presentation Slides SlideTeam
 
Distribution of normal data understanding it numerical way by arun umrao
Distribution of normal data   understanding it numerical way by arun umraoDistribution of normal data   understanding it numerical way by arun umrao
Distribution of normal data understanding it numerical way by arun umraossuserd6b1fd
 
Qcl 14-v3 pareto-chart_potholes_in_the_city_banasthali-university_rashi
Qcl 14-v3 pareto-chart_potholes_in_the_city_banasthali-university_rashiQcl 14-v3 pareto-chart_potholes_in_the_city_banasthali-university_rashi
Qcl 14-v3 pareto-chart_potholes_in_the_city_banasthali-university_rashitwinkle_singhal7
 
Seven QC Tools Training; Control Charts (Mean Chart and Range Chart)
Seven QC Tools Training; Control Charts (Mean Chart and Range Chart)Seven QC Tools Training; Control Charts (Mean Chart and Range Chart)
Seven QC Tools Training; Control Charts (Mean Chart and Range Chart)Shakehand with Life
 
Quality management institute
Quality management instituteQuality management institute
Quality management instituteselinasimpson1301
 
ASOCEU - Lesson 2 - Data Analysis (slides)
ASOCEU - Lesson 2 - Data Analysis (slides)ASOCEU - Lesson 2 - Data Analysis (slides)
ASOCEU - Lesson 2 - Data Analysis (slides)A Scuola di OpenCoesione
 

Mais procurados (20)

Pareto Diagrams
Pareto DiagramsPareto Diagrams
Pareto Diagrams
 
how quality tools are used to monitor and control the quality of an organizat...
how quality tools are used to monitor and control the quality of an organizat...how quality tools are used to monitor and control the quality of an organizat...
how quality tools are used to monitor and control the quality of an organizat...
 
7 basic tool for QUALITY
7 basic tool for QUALITY7 basic tool for QUALITY
7 basic tool for QUALITY
 
Data mining
Data miningData mining
Data mining
 
Tools of total quality management
Tools of total quality managementTools of total quality management
Tools of total quality management
 
Quality tools by Er. Manish Dwivedi
Quality tools by Er. Manish DwivediQuality tools by Er. Manish Dwivedi
Quality tools by Er. Manish Dwivedi
 
Problem Solving Tools - Susan
Problem Solving Tools - SusanProblem Solving Tools - Susan
Problem Solving Tools - Susan
 
Pareto chart importance & making
Pareto chart importance & makingPareto chart importance & making
Pareto chart importance & making
 
Pareto Diagram
Pareto DiagramPareto Diagram
Pareto Diagram
 
Runchart
RunchartRunchart
Runchart
 
Exploring data stemplot
Exploring data   stemplotExploring data   stemplot
Exploring data stemplot
 
Managing change risk in Excel spreadsheets
Managing change risk in Excel spreadsheetsManaging change risk in Excel spreadsheets
Managing change risk in Excel spreadsheets
 
7 QC Tools PowerPoint Presentation Slides
7 QC Tools PowerPoint Presentation Slides 7 QC Tools PowerPoint Presentation Slides
7 QC Tools PowerPoint Presentation Slides
 
Distribution of normal data understanding it numerical way by arun umrao
Distribution of normal data   understanding it numerical way by arun umraoDistribution of normal data   understanding it numerical way by arun umrao
Distribution of normal data understanding it numerical way by arun umrao
 
Qcl 14-v3 pareto-chart_potholes_in_the_city_banasthali-university_rashi
Qcl 14-v3 pareto-chart_potholes_in_the_city_banasthali-university_rashiQcl 14-v3 pareto-chart_potholes_in_the_city_banasthali-university_rashi
Qcl 14-v3 pareto-chart_potholes_in_the_city_banasthali-university_rashi
 
TYPES ON CHARTS
TYPES ON CHARTS TYPES ON CHARTS
TYPES ON CHARTS
 
Seven QC Tools Training; Control Charts (Mean Chart and Range Chart)
Seven QC Tools Training; Control Charts (Mean Chart and Range Chart)Seven QC Tools Training; Control Charts (Mean Chart and Range Chart)
Seven QC Tools Training; Control Charts (Mean Chart and Range Chart)
 
Quality management institute
Quality management instituteQuality management institute
Quality management institute
 
ASOCEU - Lesson 2 - Data Analysis (slides)
ASOCEU - Lesson 2 - Data Analysis (slides)ASOCEU - Lesson 2 - Data Analysis (slides)
ASOCEU - Lesson 2 - Data Analysis (slides)
 
Making Sense of Data - 3rd Sector Learning Lab
Making Sense of Data - 3rd Sector Learning LabMaking Sense of Data - 3rd Sector Learning Lab
Making Sense of Data - 3rd Sector Learning Lab
 

Semelhante a 1b s4 i interpreting runcharts final

A-guide-to-creating-and-interpreting-run-and-control-charts
A-guide-to-creating-and-interpreting-run-and-control-chartsA-guide-to-creating-and-interpreting-run-and-control-charts
A-guide-to-creating-and-interpreting-run-and-control-chartsRohitLakhotia12
 
What and how to look at performance trend
What and how to look at performance trendWhat and how to look at performance trend
What and how to look at performance trendsbasu_71
 
Quality management techniques
Quality management techniquesQuality management techniques
Quality management techniquesselinasimpson0401
 
Philip crosby quality management
Philip crosby quality managementPhilip crosby quality management
Philip crosby quality managementselinasimpson2701
 
Seven traditional tools
Seven traditional toolsSeven traditional tools
Seven traditional toolsJavith Saleem
 
Quality management maturity grid
Quality management maturity gridQuality management maturity grid
Quality management maturity gridselinasimpson1601
 
5 M Web Ex Run Chart Analysis Slides 04.02.08
5 M Web Ex Run Chart Analysis Slides 04.02.085 M Web Ex Run Chart Analysis Slides 04.02.08
5 M Web Ex Run Chart Analysis Slides 04.02.08David Velasquez
 
Asian institute of quality management
Asian institute of quality managementAsian institute of quality management
Asian institute of quality managementselinasimpson1301
 
Functions of quality management
Functions of quality managementFunctions of quality management
Functions of quality managementselinasimpson2901
 
Tools and techniques used in tqm ppt
Tools and techniques used in tqm pptTools and techniques used in tqm ppt
Tools and techniques used in tqm pptabhandary
 
Continuous quality management
Continuous quality managementContinuous quality management
Continuous quality managementselinasimpson341
 
Advantages of quality management
Advantages of quality managementAdvantages of quality management
Advantages of quality managementselinasimpson2001
 
Evolution of quality management
Evolution of quality managementEvolution of quality management
Evolution of quality managementselinasimpson0401
 
Quality management dashboard
Quality management dashboardQuality management dashboard
Quality management dashboardselinasimpson2901
 
Purpose of quality management
Purpose of quality managementPurpose of quality management
Purpose of quality managementselinasimpson2301
 
Software quality management system
Software quality management systemSoftware quality management system
Software quality management systemselinasimpson1801
 
Why is quality management important
Why is quality management importantWhy is quality management important
Why is quality management importantselinasimpson1301
 

Semelhante a 1b s4 i interpreting runcharts final (20)

A-guide-to-creating-and-interpreting-run-and-control-charts
A-guide-to-creating-and-interpreting-run-and-control-chartsA-guide-to-creating-and-interpreting-run-and-control-charts
A-guide-to-creating-and-interpreting-run-and-control-charts
 
What and how to look at performance trend
What and how to look at performance trendWhat and how to look at performance trend
What and how to look at performance trend
 
Quality management techniques
Quality management techniquesQuality management techniques
Quality management techniques
 
Philip crosby quality management
Philip crosby quality managementPhilip crosby quality management
Philip crosby quality management
 
Seven traditional tools
Seven traditional toolsSeven traditional tools
Seven traditional tools
 
Quality management maturity grid
Quality management maturity gridQuality management maturity grid
Quality management maturity grid
 
5 M Web Ex Run Chart Analysis Slides 04.02.08
5 M Web Ex Run Chart Analysis Slides 04.02.085 M Web Ex Run Chart Analysis Slides 04.02.08
5 M Web Ex Run Chart Analysis Slides 04.02.08
 
Quality management pmp
Quality management pmpQuality management pmp
Quality management pmp
 
Asian institute of quality management
Asian institute of quality managementAsian institute of quality management
Asian institute of quality management
 
Functions of quality management
Functions of quality managementFunctions of quality management
Functions of quality management
 
Tools and techniques used in tqm ppt
Tools and techniques used in tqm pptTools and techniques used in tqm ppt
Tools and techniques used in tqm ppt
 
Continuous quality management
Continuous quality managementContinuous quality management
Continuous quality management
 
Advantages of quality management
Advantages of quality managementAdvantages of quality management
Advantages of quality management
 
Evolution of quality management
Evolution of quality managementEvolution of quality management
Evolution of quality management
 
Quality data management
Quality data managementQuality data management
Quality data management
 
Quality data management
Quality data managementQuality data management
Quality data management
 
Quality management dashboard
Quality management dashboardQuality management dashboard
Quality management dashboard
 
Purpose of quality management
Purpose of quality managementPurpose of quality management
Purpose of quality management
 
Software quality management system
Software quality management systemSoftware quality management system
Software quality management system
 
Why is quality management important
Why is quality management importantWhy is quality management important
Why is quality management important
 

Mais de ABCiABUHB

ABCi Working Styles workbook
ABCi Working Styles workbookABCi Working Styles workbook
ABCi Working Styles workbookABCiABUHB
 
24 s4 i affinity diagram final
24 s4 i affinity diagram final24 s4 i affinity diagram final
24 s4 i affinity diagram finalABCiABUHB
 
23 s4 i nominal group technique final
23 s4 i nominal group technique final23 s4 i nominal group technique final
23 s4 i nominal group technique finalABCiABUHB
 
22 s4 i brainstorming final
22 s4 i brainstorming final22 s4 i brainstorming final
22 s4 i brainstorming finalABCiABUHB
 
14 s4 i scatter plot final
14 s4 i scatter plot final14 s4 i scatter plot final
14 s4 i scatter plot finalABCiABUHB
 
10 s4 i spaghetti diagram final
10 s4 i spaghetti diagram final10 s4 i spaghetti diagram final
10 s4 i spaghetti diagram finalABCiABUHB
 
7 s4 i model for improvement final
7 s4 i model for improvement final7 s4 i model for improvement final
7 s4 i model for improvement finalABCiABUHB
 
5 s4 i ease benefit matrix final
5 s4 i ease benefit matrix final5 s4 i ease benefit matrix final
5 s4 i ease benefit matrix finalABCiABUHB
 
2 s4 i driver diagram final
2 s4 i driver diagram final2 s4 i driver diagram final
2 s4 i driver diagram finalABCiABUHB
 
Fishbone template
Fishbone templateFishbone template
Fishbone templateABCiABUHB
 
ABCi Skills for Improvement- Fishbone Diagram
ABCi Skills for Improvement- Fishbone DiagramABCi Skills for Improvement- Fishbone Diagram
ABCi Skills for Improvement- Fishbone DiagramABCiABUHB
 
2019 11-18 -- abci training prospectusv7 (1)
2019 11-18 -- abci training prospectusv7 (1)2019 11-18 -- abci training prospectusv7 (1)
2019 11-18 -- abci training prospectusv7 (1)ABCiABUHB
 

Mais de ABCiABUHB (12)

ABCi Working Styles workbook
ABCi Working Styles workbookABCi Working Styles workbook
ABCi Working Styles workbook
 
24 s4 i affinity diagram final
24 s4 i affinity diagram final24 s4 i affinity diagram final
24 s4 i affinity diagram final
 
23 s4 i nominal group technique final
23 s4 i nominal group technique final23 s4 i nominal group technique final
23 s4 i nominal group technique final
 
22 s4 i brainstorming final
22 s4 i brainstorming final22 s4 i brainstorming final
22 s4 i brainstorming final
 
14 s4 i scatter plot final
14 s4 i scatter plot final14 s4 i scatter plot final
14 s4 i scatter plot final
 
10 s4 i spaghetti diagram final
10 s4 i spaghetti diagram final10 s4 i spaghetti diagram final
10 s4 i spaghetti diagram final
 
7 s4 i model for improvement final
7 s4 i model for improvement final7 s4 i model for improvement final
7 s4 i model for improvement final
 
5 s4 i ease benefit matrix final
5 s4 i ease benefit matrix final5 s4 i ease benefit matrix final
5 s4 i ease benefit matrix final
 
2 s4 i driver diagram final
2 s4 i driver diagram final2 s4 i driver diagram final
2 s4 i driver diagram final
 
Fishbone template
Fishbone templateFishbone template
Fishbone template
 
ABCi Skills for Improvement- Fishbone Diagram
ABCi Skills for Improvement- Fishbone DiagramABCi Skills for Improvement- Fishbone Diagram
ABCi Skills for Improvement- Fishbone Diagram
 
2019 11-18 -- abci training prospectusv7 (1)
2019 11-18 -- abci training prospectusv7 (1)2019 11-18 -- abci training prospectusv7 (1)
2019 11-18 -- abci training prospectusv7 (1)
 

Último

Navigating Conflict in PE Using Strengths-Based Approaches
Navigating Conflict in PE Using Strengths-Based ApproachesNavigating Conflict in PE Using Strengths-Based Approaches
Navigating Conflict in PE Using Strengths-Based ApproachesCHICommunications
 
Catheterization Procedure by Anushri Srivastav.pptx
Catheterization Procedure by Anushri Srivastav.pptxCatheterization Procedure by Anushri Srivastav.pptx
Catheterization Procedure by Anushri Srivastav.pptxAnushriSrivastav
 
clostridiumbotulinum- BY Muzammil Ahmed Siddiqui.pptx
clostridiumbotulinum- BY Muzammil Ahmed Siddiqui.pptxclostridiumbotulinum- BY Muzammil Ahmed Siddiqui.pptx
clostridiumbotulinum- BY Muzammil Ahmed Siddiqui.pptxMuzammil Ahmed Siddiqui
 
Antiepileptic-Drugs-and-Congenital-Anomalies copy.pptx
Antiepileptic-Drugs-and-Congenital-Anomalies copy.pptxAntiepileptic-Drugs-and-Congenital-Anomalies copy.pptx
Antiepileptic-Drugs-and-Congenital-Anomalies copy.pptxdrdeepikaj
 
Communicable Disease.pptxgfgfggfffdfxfsdddf
Communicable Disease.pptxgfgfggfffdfxfsdddfCommunicable Disease.pptxgfgfggfffdfxfsdddf
Communicable Disease.pptxgfgfggfffdfxfsdddfnuradinman89
 
End of Response issues - Code and Rapid Response Workshop
End of Response issues - Code and Rapid Response WorkshopEnd of Response issues - Code and Rapid Response Workshop
End of Response issues - Code and Rapid Response WorkshopBrian Locke
 
Coach Dan Quinn Commanders Feather T Shirts
Coach Dan Quinn Commanders Feather T ShirtsCoach Dan Quinn Commanders Feather T Shirts
Coach Dan Quinn Commanders Feather T Shirtsrahman018755
 
The Events of Cardiac Cycle - Wigger's Diagram
The Events of Cardiac Cycle - Wigger's DiagramThe Events of Cardiac Cycle - Wigger's Diagram
The Events of Cardiac Cycle - Wigger's DiagramMedicoseAcademics
 
Etiology for RRT and Code Blue Workshop.
Etiology for RRT and Code Blue Workshop.Etiology for RRT and Code Blue Workshop.
Etiology for RRT and Code Blue Workshop.Brian Locke
 
TEST BANK For Little and Falace's Dental Management of the Medically Compromi...
TEST BANK For Little and Falace's Dental Management of the Medically Compromi...TEST BANK For Little and Falace's Dental Management of the Medically Compromi...
TEST BANK For Little and Falace's Dental Management of the Medically Compromi...rightmanforbloodline
 
Cytotec 200mcg tab in Riyadh (+919101817206// Get Abortion Pills in Saudi Arabia
Cytotec 200mcg tab in Riyadh (+919101817206// Get Abortion Pills in Saudi ArabiaCytotec 200mcg tab in Riyadh (+919101817206// Get Abortion Pills in Saudi Arabia
Cytotec 200mcg tab in Riyadh (+919101817206// Get Abortion Pills in Saudi Arabiajaanualu31
 
TEST BANK For Leddy & Pepper’s Professional Nursing, 10th Edition by Lucy Hoo...
TEST BANK For Leddy & Pepper’s Professional Nursing, 10th Edition by Lucy Hoo...TEST BANK For Leddy & Pepper’s Professional Nursing, 10th Edition by Lucy Hoo...
TEST BANK For Leddy & Pepper’s Professional Nursing, 10th Edition by Lucy Hoo...rightmanforbloodline
 
Leading large scale change: a life at the interface between theory and practice
Leading large scale change: a life at the interface between theory and practiceLeading large scale change: a life at the interface between theory and practice
Leading large scale change: a life at the interface between theory and practiceHelenBevan4
 
TIME FOR ACTION: MAY 2024 Securing A Strong Nursing Workforce for North Carolina
TIME FOR ACTION: MAY 2024 Securing A Strong Nursing Workforce for North CarolinaTIME FOR ACTION: MAY 2024 Securing A Strong Nursing Workforce for North Carolina
TIME FOR ACTION: MAY 2024 Securing A Strong Nursing Workforce for North CarolinaMebane Rash
 
Technology transfer documentation and strategies
Technology transfer documentation and strategiesTechnology transfer documentation and strategies
Technology transfer documentation and strategiesNidhi Joshi
 
Top 20 Famous Indian Female Pornstars Name List 2024
Top 20 Famous Indian Female Pornstars Name List 2024Top 20 Famous Indian Female Pornstars Name List 2024
Top 20 Famous Indian Female Pornstars Name List 2024minkseocompany
 
TEST BANK For Success in Practical Vocational Nursing 10th Edition by Carrol ...
TEST BANK For Success in Practical Vocational Nursing 10th Edition by Carrol ...TEST BANK For Success in Practical Vocational Nursing 10th Edition by Carrol ...
TEST BANK For Success in Practical Vocational Nursing 10th Edition by Carrol ...rightmanforbloodline
 
TEST BANK For Robbins & Kumar Basic Pathology, 11th Edition by Vinay Kumar, A...
TEST BANK For Robbins & Kumar Basic Pathology, 11th Edition by Vinay Kumar, A...TEST BANK For Robbins & Kumar Basic Pathology, 11th Edition by Vinay Kumar, A...
TEST BANK For Robbins & Kumar Basic Pathology, 11th Edition by Vinay Kumar, A...rightmanforbloodline
 
obat aborsi jogja wa 081313339699 jual obat aborsi cytotec asli di jogja
obat aborsi jogja wa 081313339699 jual obat aborsi cytotec asli di jogjaobat aborsi jogja wa 081313339699 jual obat aborsi cytotec asli di jogja
obat aborsi jogja wa 081313339699 jual obat aborsi cytotec asli di jogjanitatalita796
 
Obat aborsi Jakarta Timur Wa 081225888346 Jual Obat aborsi Cytotec asli Di Ja...
Obat aborsi Jakarta Timur Wa 081225888346 Jual Obat aborsi Cytotec asli Di Ja...Obat aborsi Jakarta Timur Wa 081225888346 Jual Obat aborsi Cytotec asli Di Ja...
Obat aborsi Jakarta Timur Wa 081225888346 Jual Obat aborsi Cytotec asli Di Ja...icha27638
 

Último (20)

Navigating Conflict in PE Using Strengths-Based Approaches
Navigating Conflict in PE Using Strengths-Based ApproachesNavigating Conflict in PE Using Strengths-Based Approaches
Navigating Conflict in PE Using Strengths-Based Approaches
 
Catheterization Procedure by Anushri Srivastav.pptx
Catheterization Procedure by Anushri Srivastav.pptxCatheterization Procedure by Anushri Srivastav.pptx
Catheterization Procedure by Anushri Srivastav.pptx
 
clostridiumbotulinum- BY Muzammil Ahmed Siddiqui.pptx
clostridiumbotulinum- BY Muzammil Ahmed Siddiqui.pptxclostridiumbotulinum- BY Muzammil Ahmed Siddiqui.pptx
clostridiumbotulinum- BY Muzammil Ahmed Siddiqui.pptx
 
Antiepileptic-Drugs-and-Congenital-Anomalies copy.pptx
Antiepileptic-Drugs-and-Congenital-Anomalies copy.pptxAntiepileptic-Drugs-and-Congenital-Anomalies copy.pptx
Antiepileptic-Drugs-and-Congenital-Anomalies copy.pptx
 
Communicable Disease.pptxgfgfggfffdfxfsdddf
Communicable Disease.pptxgfgfggfffdfxfsdddfCommunicable Disease.pptxgfgfggfffdfxfsdddf
Communicable Disease.pptxgfgfggfffdfxfsdddf
 
End of Response issues - Code and Rapid Response Workshop
End of Response issues - Code and Rapid Response WorkshopEnd of Response issues - Code and Rapid Response Workshop
End of Response issues - Code and Rapid Response Workshop
 
Coach Dan Quinn Commanders Feather T Shirts
Coach Dan Quinn Commanders Feather T ShirtsCoach Dan Quinn Commanders Feather T Shirts
Coach Dan Quinn Commanders Feather T Shirts
 
The Events of Cardiac Cycle - Wigger's Diagram
The Events of Cardiac Cycle - Wigger's DiagramThe Events of Cardiac Cycle - Wigger's Diagram
The Events of Cardiac Cycle - Wigger's Diagram
 
Etiology for RRT and Code Blue Workshop.
Etiology for RRT and Code Blue Workshop.Etiology for RRT and Code Blue Workshop.
Etiology for RRT and Code Blue Workshop.
 
TEST BANK For Little and Falace's Dental Management of the Medically Compromi...
TEST BANK For Little and Falace's Dental Management of the Medically Compromi...TEST BANK For Little and Falace's Dental Management of the Medically Compromi...
TEST BANK For Little and Falace's Dental Management of the Medically Compromi...
 
Cytotec 200mcg tab in Riyadh (+919101817206// Get Abortion Pills in Saudi Arabia
Cytotec 200mcg tab in Riyadh (+919101817206// Get Abortion Pills in Saudi ArabiaCytotec 200mcg tab in Riyadh (+919101817206// Get Abortion Pills in Saudi Arabia
Cytotec 200mcg tab in Riyadh (+919101817206// Get Abortion Pills in Saudi Arabia
 
TEST BANK For Leddy & Pepper’s Professional Nursing, 10th Edition by Lucy Hoo...
TEST BANK For Leddy & Pepper’s Professional Nursing, 10th Edition by Lucy Hoo...TEST BANK For Leddy & Pepper’s Professional Nursing, 10th Edition by Lucy Hoo...
TEST BANK For Leddy & Pepper’s Professional Nursing, 10th Edition by Lucy Hoo...
 
Leading large scale change: a life at the interface between theory and practice
Leading large scale change: a life at the interface between theory and practiceLeading large scale change: a life at the interface between theory and practice
Leading large scale change: a life at the interface between theory and practice
 
TIME FOR ACTION: MAY 2024 Securing A Strong Nursing Workforce for North Carolina
TIME FOR ACTION: MAY 2024 Securing A Strong Nursing Workforce for North CarolinaTIME FOR ACTION: MAY 2024 Securing A Strong Nursing Workforce for North Carolina
TIME FOR ACTION: MAY 2024 Securing A Strong Nursing Workforce for North Carolina
 
Technology transfer documentation and strategies
Technology transfer documentation and strategiesTechnology transfer documentation and strategies
Technology transfer documentation and strategies
 
Top 20 Famous Indian Female Pornstars Name List 2024
Top 20 Famous Indian Female Pornstars Name List 2024Top 20 Famous Indian Female Pornstars Name List 2024
Top 20 Famous Indian Female Pornstars Name List 2024
 
TEST BANK For Success in Practical Vocational Nursing 10th Edition by Carrol ...
TEST BANK For Success in Practical Vocational Nursing 10th Edition by Carrol ...TEST BANK For Success in Practical Vocational Nursing 10th Edition by Carrol ...
TEST BANK For Success in Practical Vocational Nursing 10th Edition by Carrol ...
 
TEST BANK For Robbins & Kumar Basic Pathology, 11th Edition by Vinay Kumar, A...
TEST BANK For Robbins & Kumar Basic Pathology, 11th Edition by Vinay Kumar, A...TEST BANK For Robbins & Kumar Basic Pathology, 11th Edition by Vinay Kumar, A...
TEST BANK For Robbins & Kumar Basic Pathology, 11th Edition by Vinay Kumar, A...
 
obat aborsi jogja wa 081313339699 jual obat aborsi cytotec asli di jogja
obat aborsi jogja wa 081313339699 jual obat aborsi cytotec asli di jogjaobat aborsi jogja wa 081313339699 jual obat aborsi cytotec asli di jogja
obat aborsi jogja wa 081313339699 jual obat aborsi cytotec asli di jogja
 
Obat aborsi Jakarta Timur Wa 081225888346 Jual Obat aborsi Cytotec asli Di Ja...
Obat aborsi Jakarta Timur Wa 081225888346 Jual Obat aborsi Cytotec asli Di Ja...Obat aborsi Jakarta Timur Wa 081225888346 Jual Obat aborsi Cytotec asli Di Ja...
Obat aborsi Jakarta Timur Wa 081225888346 Jual Obat aborsi Cytotec asli Di Ja...
 

1b s4 i interpreting runcharts final

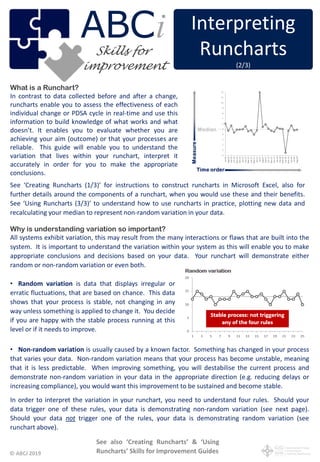
  • 1. © ABCi 2019 What is a Runchart? In contrast to data collected before and after a change, runcharts enable you to assess the effectiveness of each individual change or PDSA cycle in real-time and use this information to build knowledge of what works and what doesn’t. It enables you to evaluate whether you are achieving your aim (outcome) or that your processes are reliable. This guide will enable you to understand the variation that lives within your runchart, interpret it accurately in order for you to make the appropriate conclusions. See also ‘Creating Runcharts’ & ‘Using Runcharts’ Skills for Improvement Guides (2/3) See ‘Creating Runcharts (1/3)’ for instructions to construct runcharts in Microsoft Excel, also for further details around the components of a runchart, when you would use these and their benefits. See ‘Using Runcharts (3/3)’ to understand how to use runcharts in practice, plotting new data and recalculating your median to represent non-random variation in your data. Why is understanding variation so important? All systems exhibit variation, this may result from the many interactions or flaws that are built into the system. It is important to understand the variation within your system as this will enable you to make appropriate conclusions and decisions based on your data. Your runchart will demonstrate either random or non-random variation or even both. • Non-random variation is usually caused by a known factor. Something has changed in your process that varies your data. Non-random variation means that your process has become unstable, meaning that it is less predictable. When improving something, you will destabilise the current process and demonstrate non-random variation in your data in the appropriate direction (e.g. reducing delays or increasing compliance), you would want this improvement to be sustained and become stable. In order to interpret the variation in your runchart, you need to understand four rules. Should your data trigger one of these rules, your data is demonstrating non-random variation (see next page). Should your data not trigger one of the rules, your data is demonstrating random variation (see runchart above). • Random variation is data that displays irregular or erratic fluctuations, that are based on chance. This data shows that your process is stable, not changing in any way unless something is applied to change it. You decide if you are happy with the stable process running at this level or if it needs to improve. Interpreting Runcharts (2/3) ABC improvement iSkills for
  • 2. © ABCi 2019 What are the runchart rules? There are four rules to determine whether your runchart is exhibiting random or non-random variation. If a rule is triggered, the data is demonstrating non-random variation. A Shift - 6 or more data points above or below the median. Given there is a 50% probability of a data point being above or below the median (p = 0.016), it is extremely unlikely that 6 in a row is due to luck. Any data point falling on the median will not break a shift, but will not be counted as part of the 6 to make the shift. A Trend - 5 or more points consecutively going up or down. If two or more consecutive points are exactly the same value, this is not enough to break the trend but will not be counted as part of the 5 that makes up the trend. Too many or too few runs – A non-random pattern may be signalled by too many or too few runs. A run is the amount of times the line crosses the median plus 1, or how many times the line is above or below the median. Of note, if there are too many runs, consider if the data on the graph is from multiple processes, e.g. day shift & night shift, or weekday & weekend.  Count the number of data points on the runchart and look this up on the table on the next page. Lookup the corresponding upper and lower limits for the number of runs.  Count the number of runs, this is the number of times the line crosses beyond the median plus 1, or the total number of times the line is either above or below the median.  If the number of runs falls within the range between the lower and upper limit – this is random variation.  If the number of runs falls outside the range between the lower and upper limit – this is non-random variation  The graph above has 25 data points, looking this up on the table below, for the data to show random variation there should be between 8 and 18 runs. There are 6 runs (line crossing the median) in the graph above and because this falls outside the 8-18 range, this graph is exhibiting non-random variation.
  • 3. © ABCi 2019 Number data points on run chart Lower limit for number of runs Upper limit for number of runs 10 3 9 11 3 10 12 3 11 13 4 11 14 4 12 15 5 12 16 5 13 17 5 13 18 6 14 19 6 15 20 6 16 21 7 16 22 7 17 23 7 17 24 8 18 25 8 18 Number data points on run chart Lower limit for number of runs Upper limit for number of runs 26 9 19 27 10 19 28 10 20 29 10 20 30 11 21 31 11 22 32 11 23 33 12 23 34 12 24 35 12 24 36 13 25 37 13 25 38 14 26 39 14 26 40 15 27 An Astronomical Point –  Anyone eyeballing the chart would agree that an astronomical point is beyond the normal range  Caution: Every data set will have a highest or lowest point. This doesn’t mean that it is astronomical