SlideShare uma empresa Scribd logo
1 de 4
Point & Click tool set that is simple to use yet packed with powerful features for analyzing data and plotting control charts with superb sensitivity and reduced false <br />alarms. Features our unique chart Toolbar for chart functions.  <br />Download a Free 30 day TrialFree Trial CD Order FormRead an independent review by Dr. Marjorie Lazaroff <br />FEATURES                       HYPERLINK quot;
http://www.qualitran.com/_Training_Products/SPC_Software_Bonus/spc_software_bonus.htmlquot;
 Statistical Analysis Descriptive statistics: mean, range, standard deviation, variance, SEM, percentiles, Process Width (6s), etc Normal Test - Chi-Squared & Shapiro-Wilk - t tests, one & two populations, paired, equal or unequal variances Oultlier Screen - Boxplot method - Generation of data set with outliers removed Analysis of Variance (ANOVA), F, p - Multiple Scatterplots, Expanded scatterplots Linear & Polynomial Regression, R, R-squared, t, p - Multiple Regression Pareto Charts - total count or categorical, CumSum On/Off Process Capability Histograms (variable bin width), target, USL, LSL - Full Capability report: Cp, Cpl, Cpu, Cpk,Cpm, Automotive Cpk and Ppk indecies Full Capability Report for Non Normal data - Cp, Cpl, Cpu, Cpk,Cpm, Automotive Cpk and Ppk indecies - Power transformation Method defective, dpm, Process Potential, Coeff. of Instability - Normal Probability Plot & Regression Capability Report for Non Normal data - One Page Ind. chart, Histogram, Cap. Report Gage R & R Analysis Gage Repeatability, Reproducibility, Combined Gage Variation (R&R), Automotive Short Method, Automotive Long Method, Percent of Tolerance, Percent of Part variation & total variation Control Chart diagnostics for Gage R&R Basic Control Charts X-bar,R and X-bar,S- Single column, multiple column - variable subgroup and precalculated formats. Individuals & Moving Averages, Individuals Moving Ranges Attribute Control Charts (p, np, c, u) - Auto Analyze & for Western Electric rules Coefficient of Instability: S/(MR-bar/d2) - selectable control chart window width view closeup of selected chart segment - Multiple Individuals Moving Ranges Cumulative Sum Control Charts (CUSUM) Diagnostic - Tabular (Algorithmic) Control Charts for Non-Normal Data automatic selection of best power transformation for non-normal data Histogram of transformed data set Individuals Control Charts for non-normal data - One page Individuals , Histogram Cap. Report Exponentially Weighted Moving Average EWMA charts, selectable weighting factor Dealing With Autocorrelation - EWMA Prediction & Residual Chart Individuals Correlogram Chart, lags 1 to 30 - EWMA forecasting automatic iteration for best weight factor - EWMA residuals (special cause) chart Correlogram of residuals ADDITIONAL FEATURES Full 32 bit application supports long file names and copy/paste link to Win 95/98/ME/XP and NT applications Real Time SPC for ASCII data input through Serial Port Full Chart Toolbar with Point & Click Comments, Magnify, Scroll, Data Exclude, Data ID, Recalculate Add data feature directly from chart allows operators to add data without cumbersome worksheets Auto Analyze button applies Western Electric rules and shows violations. Complete clipboard support, DDE client and server allows Paste Link to other applications Hot Link comments from data worksheet to all control charts and vice versa Imports ASCII, Lotus, Quattro, Excel, Dbase, Symphony, Paradox - copy paste/paste link from all Windows apps Export ASCII, as well as Windows Metafile (WMF), bitmap(BMP) and EPS, Copy Charts to any Windows app.  Unlimited data handling capability. REQUIRES 8 MB RAM required, 4 MB hard disk space required, Windows 95, 98, ME, XP or Windows NT 4.0 NETWORK READY - SPC/PI+ can be installed on a network and allows for multiple access.  Customers must purchase enough licenses to cover the maximum number of concurrent users.    PRICE: $495.00 U.S. ($649.00 Canadian) includes one year tech support and Quick Start video tutorial .Academic Institution price: $295.00 US ($385.00 Canadian) Multiple license discounts start at 10% for 2 copies and run to 50% at 25 copies.    Why SPC/PI+ ? Most SPC software programs have proven to be very difficult to use due to complexity of architecture which requires many steps to do an analysis. SPC/PI+ is remarkably simple to use.  You just copy/paste or paste link in your data from any Windows application, click on a column and select the analysis or chart that you want.  SPC/PI+ creates the chart and allows you access to our unique Chart Toolbar for a variety of simple functions, such as identifying data points, adding comments to data points, scrolling through the data, excluding points, recalculating limits and adding additional data points.  Becasue our worksheets can be linked to any Windows spreadsheet or database, your charts can be updated at the touch of a button.  SPC has never been simpler.  In addition, many users of SPC have been frustrated because of the inherent limitations of  Shewart charts.  The Average (X bar) and Range control chart developed by Walter Shewhart in 1931 is still the most popular chart in use today, due to its simplicity and effectiveness. However, in order for the X-bar and R chart to function properly, the underlying assumptions must be valid. The observations are assumed to be normally distributed and statistically independent. The assumption of normality is usually met because of the central limit theorem -- the distribution of sample averages tends to be normal, even if the individual observations are not. The need for the samples to be statistically independent can be a much more serious problem, since there is no similar mechanism assuring reasonable results. The assumption of independence is usually met in manufacturing industries where discrete components are being produced and piece to piece variation is monitored. In the process industries, however, statistical independence cannot be assumed. Inertial elements in the process frequently cause the observations to become positively autocorrelated; that is, if X(t) is positive, it is likely that X(t+1) will also be positive. The mean of the observations also tends to meander or drift. This does not mean that the process is quot;
out-of-controlquot;
 -- it actually represents the inherent process variation. The application of a Shewhart control chart in this case results in many false alarms, leading to expensive and fruitless searches for assignable causes. When individuals are plotted (sample size is one) and the data is not normally distributed, the central limit theorem does not apply, and the chart will likely give misleading signals of false alarms or misses. Process Capability indices will also be incorrect. Even if the data is normally distributed and statistically independent, a Shewhart chart of individuals will usually fail to detect a significant process shift early enough to prevent the production of defective product. SPC/PI+ comes to the rescue with an advanced tool kit to effectively deal with all of the above problems. SPC/PI+ includes the Cumulative Sum (CUSUM) and Exponentially Weighted Moving Average (EWMA) charts, as effective alternatives to the Shewhart chart to reduce false alarms and improve chart sensitivity. The problem of autocorrelation is identified with the CORRELOGRAM and the EWMA Predict chart is used to iteratively select the best weighting factor and model the process. The difference between the EWMA model and the actual data is then charted on a Shewhart chart for Individuals. This chart of residuals then becomes a true Special cause chart while the process mean (common cause) is displayed as an EWMA chart. The problem of Non-normal data is identified with normal probability plots and statistical tests, and automatically compensated for with power transformations. In addition, SPC/PI+ is packed with features such as Real Time data collection through the serial port, add data directly to charts, point & click scroll, magnify, data ID, data exclude, auto analyze, the ability to label every data point with a comment, ability to exclude data, calculate limits over partial ranges, set target values as chart centers, Gage R & R and more, all with the convenience of a point & click Windows environment. SPC/PI+ - POINT & CLICK SIMPLICITY! To Order Call 1-800-461-9902 in North America or e mail:  HYPERLINK quot;
mailto:information@qualitran.comquot;
 info@qualitran.com  <br />
Sqpc software 1
Sqpc software 1
Sqpc software 1

Mais conteúdo relacionado

Destaque

Everything You Need To Know About ChatGPT
Everything You Need To Know About ChatGPTEverything You Need To Know About ChatGPT
Everything You Need To Know About ChatGPTExpeed Software
 
Product Design Trends in 2024 | Teenage Engineerings
Product Design Trends in 2024 | Teenage EngineeringsProduct Design Trends in 2024 | Teenage Engineerings
Product Design Trends in 2024 | Teenage EngineeringsPixeldarts
 
How Race, Age and Gender Shape Attitudes Towards Mental Health
How Race, Age and Gender Shape Attitudes Towards Mental HealthHow Race, Age and Gender Shape Attitudes Towards Mental Health
How Race, Age and Gender Shape Attitudes Towards Mental HealthThinkNow
 
AI Trends in Creative Operations 2024 by Artwork Flow.pdf
AI Trends in Creative Operations 2024 by Artwork Flow.pdfAI Trends in Creative Operations 2024 by Artwork Flow.pdf
AI Trends in Creative Operations 2024 by Artwork Flow.pdfmarketingartwork
 
PEPSICO Presentation to CAGNY Conference Feb 2024
PEPSICO Presentation to CAGNY Conference Feb 2024PEPSICO Presentation to CAGNY Conference Feb 2024
PEPSICO Presentation to CAGNY Conference Feb 2024Neil Kimberley
 
Content Methodology: A Best Practices Report (Webinar)
Content Methodology: A Best Practices Report (Webinar)Content Methodology: A Best Practices Report (Webinar)
Content Methodology: A Best Practices Report (Webinar)contently
 
How to Prepare For a Successful Job Search for 2024
How to Prepare For a Successful Job Search for 2024How to Prepare For a Successful Job Search for 2024
How to Prepare For a Successful Job Search for 2024Albert Qian
 
Social Media Marketing Trends 2024 // The Global Indie Insights
Social Media Marketing Trends 2024 // The Global Indie InsightsSocial Media Marketing Trends 2024 // The Global Indie Insights
Social Media Marketing Trends 2024 // The Global Indie InsightsKurio // The Social Media Age(ncy)
 
Trends In Paid Search: Navigating The Digital Landscape In 2024
Trends In Paid Search: Navigating The Digital Landscape In 2024Trends In Paid Search: Navigating The Digital Landscape In 2024
Trends In Paid Search: Navigating The Digital Landscape In 2024Search Engine Journal
 
5 Public speaking tips from TED - Visualized summary
5 Public speaking tips from TED - Visualized summary5 Public speaking tips from TED - Visualized summary
5 Public speaking tips from TED - Visualized summarySpeakerHub
 
ChatGPT and the Future of Work - Clark Boyd
ChatGPT and the Future of Work - Clark Boyd ChatGPT and the Future of Work - Clark Boyd
ChatGPT and the Future of Work - Clark Boyd Clark Boyd
 
Getting into the tech field. what next
Getting into the tech field. what next Getting into the tech field. what next
Getting into the tech field. what next Tessa Mero
 
Google's Just Not That Into You: Understanding Core Updates & Search Intent
Google's Just Not That Into You: Understanding Core Updates & Search IntentGoogle's Just Not That Into You: Understanding Core Updates & Search Intent
Google's Just Not That Into You: Understanding Core Updates & Search IntentLily Ray
 
Time Management & Productivity - Best Practices
Time Management & Productivity -  Best PracticesTime Management & Productivity -  Best Practices
Time Management & Productivity - Best PracticesVit Horky
 
The six step guide to practical project management
The six step guide to practical project managementThe six step guide to practical project management
The six step guide to practical project managementMindGenius
 
Beginners Guide to TikTok for Search - Rachel Pearson - We are Tilt __ Bright...
Beginners Guide to TikTok for Search - Rachel Pearson - We are Tilt __ Bright...Beginners Guide to TikTok for Search - Rachel Pearson - We are Tilt __ Bright...
Beginners Guide to TikTok for Search - Rachel Pearson - We are Tilt __ Bright...RachelPearson36
 
Unlocking the Power of ChatGPT and AI in Testing - A Real-World Look, present...
Unlocking the Power of ChatGPT and AI in Testing - A Real-World Look, present...Unlocking the Power of ChatGPT and AI in Testing - A Real-World Look, present...
Unlocking the Power of ChatGPT and AI in Testing - A Real-World Look, present...Applitools
 

Destaque (20)

Everything You Need To Know About ChatGPT
Everything You Need To Know About ChatGPTEverything You Need To Know About ChatGPT
Everything You Need To Know About ChatGPT
 
Product Design Trends in 2024 | Teenage Engineerings
Product Design Trends in 2024 | Teenage EngineeringsProduct Design Trends in 2024 | Teenage Engineerings
Product Design Trends in 2024 | Teenage Engineerings
 
How Race, Age and Gender Shape Attitudes Towards Mental Health
How Race, Age and Gender Shape Attitudes Towards Mental HealthHow Race, Age and Gender Shape Attitudes Towards Mental Health
How Race, Age and Gender Shape Attitudes Towards Mental Health
 
AI Trends in Creative Operations 2024 by Artwork Flow.pdf
AI Trends in Creative Operations 2024 by Artwork Flow.pdfAI Trends in Creative Operations 2024 by Artwork Flow.pdf
AI Trends in Creative Operations 2024 by Artwork Flow.pdf
 
Skeleton Culture Code
Skeleton Culture CodeSkeleton Culture Code
Skeleton Culture Code
 
PEPSICO Presentation to CAGNY Conference Feb 2024
PEPSICO Presentation to CAGNY Conference Feb 2024PEPSICO Presentation to CAGNY Conference Feb 2024
PEPSICO Presentation to CAGNY Conference Feb 2024
 
Content Methodology: A Best Practices Report (Webinar)
Content Methodology: A Best Practices Report (Webinar)Content Methodology: A Best Practices Report (Webinar)
Content Methodology: A Best Practices Report (Webinar)
 
How to Prepare For a Successful Job Search for 2024
How to Prepare For a Successful Job Search for 2024How to Prepare For a Successful Job Search for 2024
How to Prepare For a Successful Job Search for 2024
 
Social Media Marketing Trends 2024 // The Global Indie Insights
Social Media Marketing Trends 2024 // The Global Indie InsightsSocial Media Marketing Trends 2024 // The Global Indie Insights
Social Media Marketing Trends 2024 // The Global Indie Insights
 
Trends In Paid Search: Navigating The Digital Landscape In 2024
Trends In Paid Search: Navigating The Digital Landscape In 2024Trends In Paid Search: Navigating The Digital Landscape In 2024
Trends In Paid Search: Navigating The Digital Landscape In 2024
 
5 Public speaking tips from TED - Visualized summary
5 Public speaking tips from TED - Visualized summary5 Public speaking tips from TED - Visualized summary
5 Public speaking tips from TED - Visualized summary
 
ChatGPT and the Future of Work - Clark Boyd
ChatGPT and the Future of Work - Clark Boyd ChatGPT and the Future of Work - Clark Boyd
ChatGPT and the Future of Work - Clark Boyd
 
Getting into the tech field. what next
Getting into the tech field. what next Getting into the tech field. what next
Getting into the tech field. what next
 
Google's Just Not That Into You: Understanding Core Updates & Search Intent
Google's Just Not That Into You: Understanding Core Updates & Search IntentGoogle's Just Not That Into You: Understanding Core Updates & Search Intent
Google's Just Not That Into You: Understanding Core Updates & Search Intent
 
How to have difficult conversations
How to have difficult conversations How to have difficult conversations
How to have difficult conversations
 
Introduction to Data Science
Introduction to Data ScienceIntroduction to Data Science
Introduction to Data Science
 
Time Management & Productivity - Best Practices
Time Management & Productivity -  Best PracticesTime Management & Productivity -  Best Practices
Time Management & Productivity - Best Practices
 
The six step guide to practical project management
The six step guide to practical project managementThe six step guide to practical project management
The six step guide to practical project management
 
Beginners Guide to TikTok for Search - Rachel Pearson - We are Tilt __ Bright...
Beginners Guide to TikTok for Search - Rachel Pearson - We are Tilt __ Bright...Beginners Guide to TikTok for Search - Rachel Pearson - We are Tilt __ Bright...
Beginners Guide to TikTok for Search - Rachel Pearson - We are Tilt __ Bright...
 
Unlocking the Power of ChatGPT and AI in Testing - A Real-World Look, present...
Unlocking the Power of ChatGPT and AI in Testing - A Real-World Look, present...Unlocking the Power of ChatGPT and AI in Testing - A Real-World Look, present...
Unlocking the Power of ChatGPT and AI in Testing - A Real-World Look, present...
 

Sqpc software 1

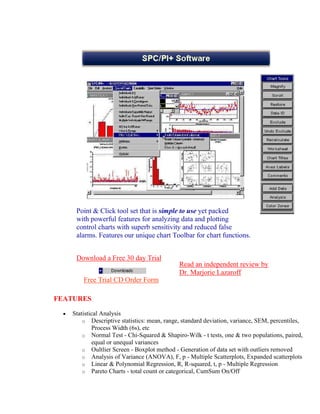
  • 1. Point & Click tool set that is simple to use yet packed with powerful features for analyzing data and plotting control charts with superb sensitivity and reduced false <br />alarms. Features our unique chart Toolbar for chart functions.  <br />Download a Free 30 day TrialFree Trial CD Order FormRead an independent review by Dr. Marjorie Lazaroff <br />FEATURES                      HYPERLINK quot; http://www.qualitran.com/_Training_Products/SPC_Software_Bonus/spc_software_bonus.htmlquot; Statistical Analysis Descriptive statistics: mean, range, standard deviation, variance, SEM, percentiles, Process Width (6s), etc Normal Test - Chi-Squared & Shapiro-Wilk - t tests, one & two populations, paired, equal or unequal variances Oultlier Screen - Boxplot method - Generation of data set with outliers removed Analysis of Variance (ANOVA), F, p - Multiple Scatterplots, Expanded scatterplots Linear & Polynomial Regression, R, R-squared, t, p - Multiple Regression Pareto Charts - total count or categorical, CumSum On/Off Process Capability Histograms (variable bin width), target, USL, LSL - Full Capability report: Cp, Cpl, Cpu, Cpk,Cpm, Automotive Cpk and Ppk indecies Full Capability Report for Non Normal data - Cp, Cpl, Cpu, Cpk,Cpm, Automotive Cpk and Ppk indecies - Power transformation Method defective, dpm, Process Potential, Coeff. of Instability - Normal Probability Plot & Regression Capability Report for Non Normal data - One Page Ind. chart, Histogram, Cap. Report Gage R & R Analysis Gage Repeatability, Reproducibility, Combined Gage Variation (R&R), Automotive Short Method, Automotive Long Method, Percent of Tolerance, Percent of Part variation & total variation Control Chart diagnostics for Gage R&R Basic Control Charts X-bar,R and X-bar,S- Single column, multiple column - variable subgroup and precalculated formats. Individuals & Moving Averages, Individuals Moving Ranges Attribute Control Charts (p, np, c, u) - Auto Analyze & for Western Electric rules Coefficient of Instability: S/(MR-bar/d2) - selectable control chart window width view closeup of selected chart segment - Multiple Individuals Moving Ranges Cumulative Sum Control Charts (CUSUM) Diagnostic - Tabular (Algorithmic) Control Charts for Non-Normal Data automatic selection of best power transformation for non-normal data Histogram of transformed data set Individuals Control Charts for non-normal data - One page Individuals , Histogram Cap. Report Exponentially Weighted Moving Average EWMA charts, selectable weighting factor Dealing With Autocorrelation - EWMA Prediction & Residual Chart Individuals Correlogram Chart, lags 1 to 30 - EWMA forecasting automatic iteration for best weight factor - EWMA residuals (special cause) chart Correlogram of residuals ADDITIONAL FEATURES Full 32 bit application supports long file names and copy/paste link to Win 95/98/ME/XP and NT applications Real Time SPC for ASCII data input through Serial Port Full Chart Toolbar with Point & Click Comments, Magnify, Scroll, Data Exclude, Data ID, Recalculate Add data feature directly from chart allows operators to add data without cumbersome worksheets Auto Analyze button applies Western Electric rules and shows violations. Complete clipboard support, DDE client and server allows Paste Link to other applications Hot Link comments from data worksheet to all control charts and vice versa Imports ASCII, Lotus, Quattro, Excel, Dbase, Symphony, Paradox - copy paste/paste link from all Windows apps Export ASCII, as well as Windows Metafile (WMF), bitmap(BMP) and EPS, Copy Charts to any Windows app.  Unlimited data handling capability. REQUIRES 8 MB RAM required, 4 MB hard disk space required, Windows 95, 98, ME, XP or Windows NT 4.0 NETWORK READY - SPC/PI+ can be installed on a network and allows for multiple access.  Customers must purchase enough licenses to cover the maximum number of concurrent users.    PRICE: $495.00 U.S. ($649.00 Canadian) includes one year tech support and Quick Start video tutorial .Academic Institution price: $295.00 US ($385.00 Canadian) Multiple license discounts start at 10% for 2 copies and run to 50% at 25 copies.    Why SPC/PI+ ? Most SPC software programs have proven to be very difficult to use due to complexity of architecture which requires many steps to do an analysis. SPC/PI+ is remarkably simple to use.  You just copy/paste or paste link in your data from any Windows application, click on a column and select the analysis or chart that you want.  SPC/PI+ creates the chart and allows you access to our unique Chart Toolbar for a variety of simple functions, such as identifying data points, adding comments to data points, scrolling through the data, excluding points, recalculating limits and adding additional data points.  Becasue our worksheets can be linked to any Windows spreadsheet or database, your charts can be updated at the touch of a button.  SPC has never been simpler.  In addition, many users of SPC have been frustrated because of the inherent limitations of  Shewart charts.  The Average (X bar) and Range control chart developed by Walter Shewhart in 1931 is still the most popular chart in use today, due to its simplicity and effectiveness. However, in order for the X-bar and R chart to function properly, the underlying assumptions must be valid. The observations are assumed to be normally distributed and statistically independent. The assumption of normality is usually met because of the central limit theorem -- the distribution of sample averages tends to be normal, even if the individual observations are not. The need for the samples to be statistically independent can be a much more serious problem, since there is no similar mechanism assuring reasonable results. The assumption of independence is usually met in manufacturing industries where discrete components are being produced and piece to piece variation is monitored. In the process industries, however, statistical independence cannot be assumed. Inertial elements in the process frequently cause the observations to become positively autocorrelated; that is, if X(t) is positive, it is likely that X(t+1) will also be positive. The mean of the observations also tends to meander or drift. This does not mean that the process is quot; out-of-controlquot; -- it actually represents the inherent process variation. The application of a Shewhart control chart in this case results in many false alarms, leading to expensive and fruitless searches for assignable causes. When individuals are plotted (sample size is one) and the data is not normally distributed, the central limit theorem does not apply, and the chart will likely give misleading signals of false alarms or misses. Process Capability indices will also be incorrect. Even if the data is normally distributed and statistically independent, a Shewhart chart of individuals will usually fail to detect a significant process shift early enough to prevent the production of defective product. SPC/PI+ comes to the rescue with an advanced tool kit to effectively deal with all of the above problems. SPC/PI+ includes the Cumulative Sum (CUSUM) and Exponentially Weighted Moving Average (EWMA) charts, as effective alternatives to the Shewhart chart to reduce false alarms and improve chart sensitivity. The problem of autocorrelation is identified with the CORRELOGRAM and the EWMA Predict chart is used to iteratively select the best weighting factor and model the process. The difference between the EWMA model and the actual data is then charted on a Shewhart chart for Individuals. This chart of residuals then becomes a true Special cause chart while the process mean (common cause) is displayed as an EWMA chart. The problem of Non-normal data is identified with normal probability plots and statistical tests, and automatically compensated for with power transformations. In addition, SPC/PI+ is packed with features such as Real Time data collection through the serial port, add data directly to charts, point & click scroll, magnify, data ID, data exclude, auto analyze, the ability to label every data point with a comment, ability to exclude data, calculate limits over partial ranges, set target values as chart centers, Gage R & R and more, all with the convenience of a point & click Windows environment. SPC/PI+ - POINT & CLICK SIMPLICITY! To Order Call 1-800-461-9902 in North America or e mail: HYPERLINK quot; mailto:information@qualitran.comquot; info@qualitran.com  <br />