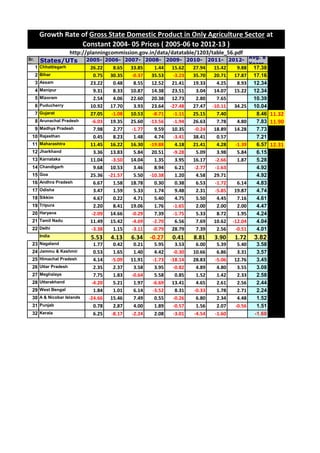
Growth Rate of Gross State Domestic Product in Only Agriculture Sector at Constant 2004- 05 Prices ( 2005-06 to 2012-13 )
•
0 gostou•1,386 visualizações

The planning commission has table 56 that gives Growth Rate of Gross State Domestic Product in Only Agriculture Sector at Constant 2004- 05 Prices ( 2005-06 to 2012-13 ). This document took the same table and ranked the states according to the average growth rate of GSDP for 8 years, i.e. 2005-06 to 2012-13. This was done to compare how different states have performed in Agriculture in comparison to their peers.
Recomendados

Recomendados
Mais conteúdo relacionado
Destaque
Semelhante a Growth Rate of Gross State Domestic Product in Only Agriculture Sector at Constant 2004- 05 Prices ( 2005-06 to 2012-13 )
Semelhante a Growth Rate of Gross State Domestic Product in Only Agriculture Sector at Constant 2004- 05 Prices ( 2005-06 to 2012-13 ) (20)
Mais de Sadanand Patwardhan
Mais de Sadanand Patwardhan (20)
Último
Último (20)
Growth Rate of Gross State Domestic Product in Only Agriculture Sector at Constant 2004- 05 Prices ( 2005-06 to 2012-13 )
- 1. Sr. No. States/UTs 2005- 06 2006- 07 2007- 08 2008- 09 2009- 10 2010- 11 2011- 12 2012- 13 Avg. 8 Years 1 Chhattisgarh 26.22 8.65 33.85 1.44 15.62 27.94 15.42 9.88 17.38 2 Bihar 0.75 30.35 -0.37 35.53 -3.23 35.70 20.71 17.87 17.16 3 Assam 23.22 0.48 8.55 12.52 21.41 19.33 4.25 8.93 12.34 4 Manipur 9.31 8.33 10.87 14.38 23.51 3.04 14.07 15.22 12.34 5 Mizoram 2.54 4.06 22.60 20.38 12.73 2.80 7.65 10.39 6 Puducherry 10.92 17.70 3.93 23.64 -27.48 27.47 -10.11 34.25 10.04 7 Gujarat 27.05 -1.08 10.53 -8.71 -1.11 25.15 7.40 8.46 11.32 8 Arunachal Pradesh -6.03 19.35 25.60 -13.56 -1.94 26.63 7.78 4.80 7.83 11.90 9 Madhya Pradesh 7.98 2.77 -1.77 9.59 10.35 -0.24 18.89 14.28 7.73 10 Rajasthan 0.45 8.23 1.48 4.74 -3.41 38.41 0.57 7.21 11 Maharashtra 11.45 16.22 16.30 -19.88 4.18 21.41 4.28 -1.39 6.57 12.31 12 Jharkhand 3.36 13.83 5.84 20.51 -9.28 5.09 3.98 5.84 6.15 13 Karnataka 11.04 -3.50 14.04 1.35 3.95 16.17 -2.66 1.87 5.28 14 Chandigarh 9.68 10.53 3.46 8.94 6.21 -2.77 -1.63 4.92 15 Goa 25.36 -21.57 5.50 -10.38 1.20 4.58 29.71 4.92 16 Andhra Pradesh 6.67 1.58 18.78 0.30 0.38 6.53 -1.72 6.14 4.83 17 Odisha 3.47 1.59 5.33 1.74 9.48 2.31 -5.85 19.87 4.74 18 Sikkim 4.67 0.22 4.71 5.40 4.75 5.50 4.45 7.16 4.61 19 Tripura 2.20 8.41 19.06 1.76 -1.65 2.00 2.00 2.00 4.47 20 Haryana -2.09 14.66 -0.29 7.39 -1.75 5.33 8.72 1.95 4.24 21 Tamil Nadu 11.49 15.42 -4.69 -2.70 6.56 7.69 10.62 -12.04 4.04 22 Delhi -3.38 1.15 -3.11 -0.79 28.79 7.39 2.56 -0.51 4.01 India 5.53 4.13 6.34 -0.27 0.41 8.81 3.90 1.72 3.82 23 Nagaland 1.77 0.42 0.21 5.95 3.53 6.00 5.39 5.40 3.58 24 Jammu & Kashmir 0.53 1.65 1.40 4.42 -0.30 10.66 6.86 3.31 3.57 25 Himachal Pradesh 4.14 -5.09 11.91 -1.73 -18.14 28.83 -5.06 12.76 3.45 26 Uttar Pradesh 2.35 2.37 3.58 3.95 -0.82 4.89 4.80 3.55 3.08 27 Meghalaya 7.75 1.83 -0.64 5.58 0.85 1.52 1.42 2.33 2.58 28 Uttarakhand -4.20 5.21 1.97 -6.69 13.41 4.65 2.61 2.56 2.44 29 West Bengal 1.84 1.01 6.14 -3.52 8.31 -0.33 1.78 2.71 2.24 30 A & Nicobar Islands -24.66 15.46 7.49 0.55 -0.26 6.80 2.34 4.48 1.52 31 Punjab 0.78 2.87 4.00 1.89 -0.57 1.56 2.07 -0.56 1.51 32 Kerala 6.25 -8.17 -2.24 2.08 -3.01 -4.54 -1.60 -1.60 Growth Rate of Gross State Domestic Product in Only Agriculture Sector at Constant 2004- 05 Prices ( 2005-06 to 2012-13 ) http://planningcommission.gov.in/data/datatable/1203/table_56.pdf