SlideShare uma empresa Scribd logo
1 de 16
Baixar para ler offline
4th Quarter 2010


                                                                                                              February 2011


Summary                                                        Housing Production
Housing data for the fourth quarter of 2010 indicated
that the recovery in the housing market continues to           Housing production indicators were mixed in the fourth
remain fragile. In the production sector, single-family        quarter of 2010. The number of single-family housing
housing permits increased and starts remained steady,          permits rose and starts remained steady, but comple-
although completions fell. Multifamily housing permits,        tions fell. In the multifamily sector (apartments and
starts, and completions all fell, although permits and         condominiums), the number of permits, starts, and
completions were down only slightly. In the marketing          completions all fell, although the decline in permits
sector, sales of both new and existing homes rose, while       and completions was small. Shipments of manufactured
median sales prices for new homes remained steady and          housing dropped in the fourth quarter.
those for existing homes fell slightly from year-earlier       ■   Builders took out permits for new housing at a pace
levels. The Standard and Poor’s Case-Shiller® national             of 574,000 (SAAR) units during the fourth quarter,
seasonally adjusted (SA) repeat-sales house-price index,           which was 3 percent higher than the previous quarter
which is reported with a lag, recorded a 3.4-percent               but 8 percent lower than a year earlier. Single-family
decline in the value of homes in the third quarter of              building permits were issued for 421,000 (SAAR)
2010, after having increased 2.6 percent in the second             housing units, an increase of 4 percent from the third
quarter, and a 1.6-percent decline over year-earlier levels.       quarter but a decrease of 14 percent from year-earlier
The less volatile Federal Housing Finance Agency’s                 levels. Single-family permits have increased in 5 of
(FHFA) purchase-only repeat-sales index, also reported             the last 7 quarters, after having declined for 14 con-
on a lagged basis, estimated a 1.6-percent (SA) decrease           secutive quarters, ending the second quarter of 2009.
in home values in the third quarter compared with the
second quarter and a 3.2-percent decline from year-earlier     ■   During the fourth quarter, builders started construc-
levels. Inventories of available homes at the current              tion on 538,000 new housing units (SAAR), down
sales rate decreased in the fourth quarter of 2010, reaching       8 percent from the third quarter and 5 percent from
an average rate of 8.0 months’ supply of new homes                 a year earlier. Single-family housing starts totaled
and 9.4 months’ supply of existing homes, down from                436,000 (SAAR) housing units, virtually unchanged
rates of 8.5 and 11.7 months’ supply, respectively, in
the previous quarter.
The national homeownership rate declined in the
fourth quarter of 2010, as did the homeownership rate              I         n         s        i        d         e
for minorities. According to the Mortgage Bankers
Association (MBA), the percentage of delinquencies for             Contents ................................... 2
mortgage loans fell in the third quarter, while newly
initiated foreclosures increased (the data are reported            2010 Annual Data ................... 5
with a 2-month lag). The percentage of newly initiated
foreclosures rose for both prime and subprime loans. The           What Do We Know About
advance estimate of overall real growth in the national            Single-Family Rental
economy for the fourth quarter was a 3.2-percent increase
at a seasonally adjusted annual rate (SAAR), following             Properties? ................................ 6
a 2.6-percent expansion in the third quarter, according
to the Bureau of Economic Analysis. Residential invest-
                                                                   National Data ......................... 17
ment increased by 3.4 percent in the fourth quarter                Regional Activity ................... 33
compared with a decline of 27.3 percent in the third
quarter of 2010.                                                   Historical Data ....................... 68


                           U.S. Department of Housing and Urban Development
                           Office of Policy Development and Research
Contents                                                                Pacific, HUD Region IX..........................48
                                                                            Northwest, HUD Region X .................... 49
                                                                                                                                            Exhibit 13
                                                                                                                                             Builders’ Views of Housing Market
                                                                                                                                             Activity: 1979–Present ........................80
    Summary......................................................1        Housing Market Profiles ...........................52
     Housing Production .................................. 1                                                                                Exhibit 14
                                                                           Burlington-South Burlington, Vermont... 52
     Marketing of Housing ............................... 3                                                                                  Mortgage Interest Rates, Average
                                                                           Cincinnati-Middletown, Ohio-
     Affordability, Homeownership, and                                                                                                       Commitment Rates, and Points:
                                                                             Kentucky-Indiana ................................. 53
       Foreclosures ........................................... 4                                                                            1973–Present ........................................81
                                                                           Dallas-Plano-Irving, Texas ...................... 54
     Multifamily Housing ................................ 5                Grand Rapids, Michigan ......................... 55              Exhibit 15
                                                                           Honolulu, Hawaii.................................... 56           Mortgage Interest Rates, Fees,
    2010 Annual Data ........................................ 5            Louisville-Jefferson, Kentucky-Indiana.. 57                       Effective Rates, and Average Term
                                                                           Miami-Miami Beach-Kendall, Florida.... 58                         to Maturity on Conventional Loans
    What Do We Know About Single-Family                                                                                                      Closed: 1982–Present ......................... 82
     Rental Properties? .................................. 6               Milwaukee-Waukesha-West Allis,
     Introduction ............................................... 6          Wisconsin ............................................. 59     Exhibit 16
     AHS Data––Property and Renter                                         Missoula, Montana ................................. 60            FHA Market Share of 1- to 4-Family
       Characteristics ........................................ 6          New York City, New York ..................... 61                  Mortgages: 2001–Present ..................... 83
     Financing and Mortgage Performance ..... 9                            Pittsburgh, Pennsylvania ........................ 62             Exhibit 17
     Single-Family Mortgage Purchases by                                   West Palm Beach-Boca Raton-Boynton                                FHA, VA, and PMI 1- to 4-Family
       Fannie Mae and Freddie Mac ............... 12                         Beach, Florida ....................................... 64       Mortgage Insurance Activity:
     Distribution of U.S. Rental Structures .. 15                                                                                            1971–Present ........................................84
                                                                          Units Authorized by Building Permits,
     Conclusion ............................................... 16         Year to Date: HUD Regions                                        Exhibit 18
     Notes ........................................................ 16     and States................................................. 66    FHA Unassisted Multifamily
     Glossary ................................................... 16                                                                         Mortgage Insurance Activity:
                                                                          Units Authorized by Building Permits,                              1980–Present ........................................85
    National Data ..................................... 17                 Year to Date: 50 Most Active Core                                Exhibit 19
    Housing Production ...................................17               Based Statistical Areas (Listed by                                Mortgage Delinquencies and
     Permits..................................................... 17       Total Building Permits) ..........................67              Foreclosures Started: 1986–Present .....86
     Starts ........................................................ 18
     Under Construction................................18                 Historical Data ..................................68              Exhibit 20
     Completions............................................19                                                                               Value of New Construction Put in
                                                                            Exhibit 1                                                        Place, Private Residential Buildings:
     Manufactured (Mobile) Home
                                                                             New Privately Owned Housing                                     1974–Present .......................................88
       Shipments ............................................19
                                                                             Units Authorized: 1967–Present ......... 68                    Exhibit 21
    Marketing of Housing ................................ 20                Exhibit 2                                                        Gross Domestic Product and
     Home Sales .............................................. 20            New Privately Owned Housing                                     Residential Fixed Investment:
     Home Prices ............................................21              Units Started: 1967–Present ................69                  1960–Present ........................................89
     Repeat Sales Price Index ......................... 22
     Housing Affordability ............................. 22                 Exhibit 3                                                       Exhibit 22
     Absorption of New Multifamily Units ..23                                New Privately Owned Housing Units                               Net Change in Number of House-
     Manufactured (Mobile) Home                                              Under Construction: 1970–Present .....70                        holds by Age of Householder:
      Placements............................................ 24             Exhibit 4                                                        1971–Present......................................... 90
     Builders’ Views of Housing                                              New Privately Owned Housing                                    Exhibit 23
      Market Activity ...................................25                  Units Completed: 1970–Present ..........71                      Net Change in Number of House-
                                                                            Exhibit 5                                                        holds by Type of Household:
    Housing Finance ........................................26                                                                               1971–Present........................................91
     Mortgage Interest Rates..........................26                     Manufactured (Mobile) Home
     FHA Market Share of 1- to 4-Family                                      Shipments, Residential Placements,                             Exhibit 24
      Mortgages.............................................. 27             Average Prices, and Units for Sale:                             Net Change in Number of House-
     FHA 1- to 4-Family Mortgage                                             1977–Present ........................................72         holds by Race and Ethnicity of
      Insurance ..............................................28            Exhibit 6                                                        Householder: 1971–Present ................ 92
     PMI and VA Activity ..............................28                    New Single-Family Home Sales:                                  Exhibit 25
     Delinquencies and Foreclosures .............29                          1970–Present ........................................73         Total U.S. Housing Stock:
                                                                            Exhibit 7                                                        1970–Present ...................................... 93
    Housing Investment ..................................30
     Residential Fixed Investment and                                        Existing Home Sales: 1969–Present ....74                       Exhibit 26
      Gross Domestic Product......................30                        Exhibit 8                                                        Rental Vacancy Rates:
                                                                             New Single-Family Home Prices:                                  1979–Present...........................................94
    Housing Inventory.....................................31                 1964–Present ......................................... 75      Exhibit 27
     Housing Stock ......................................... 31                                                                              Homeownership Rates by Age
     Vacancy Rates.......................................... 32             Exhibit 9
                                                                             Existing Home Prices: 1969–Present ...76                        of Householder: 1982–Present ............ 95
     Homeownership Rates ............................ 32
                                                                            Exhibit 10                                                      Exhibit 28
    Regional Activity ............................. 33                       Repeat Sales House Price Index:                                 Homeownership Rates by Region and
                                                                             1991–Present...........................................77       Metropolitan Status: 1983–Present .....96
    Regional Reports........................................34
     New England, HUD Region I ................. 34                         Exhibit 11                                                      Exhibit 29
     New York/New Jersey, HUD Region II... 36                                Housing Affordability Index:                                    Homeownership Rates by Race and
     Mid-Atlantic, HUD Region III ............... 37                         1973–Present...........................................78       Ethnicity: 1983–Present .......................97
     Southeast/Caribbean, HUD Region IV ..39                                Exhibit 12                                                      Exhibit 30
     Midwest, HUD Region V .......................41                         Market Absorption of New Rental                                 Homeownership Rates by Household
     Southwest, HUD Region VI ................... 42                         Units and Median Asking Rent:                                   Type: 1983–Present ..............................98
     Great Plains, HUD Region VII ...............44                          1970–Present ........................................79
     Rocky Mountain, HUD Region VIII ...... 46


For readers incorporating portions of the content from this publication in their own printed or electronic work, please provide full
attribution to the U.S. Department of Housing and Urban Development's Office of Policy Development and Research.

    Summary                                                                                             2
from the third quarter but down 11 percent from             ■   The median price of new homes sold in the fourth
    year-earlier levels. Single-family starts have risen            quarter was $219,800, down 2 percent from the
    or remained steady in 4 of the last 7 quarters, after           previous quarter and virtually the same over the
    having fallen for 12 consecutive quarters, ending               previous four quarters. The average price of new
    the second of 2009. Builders completed 583,000                  homes sold was $272,400, up 2 percent from the
    (SAAR) new housing units in the fourth quarter,                 previous quarter and nearly the same as a year ear-
    down 4 percent from the third quarter and 26 percent            lier. A constant-quality house would have sold for
    over the four-quarter period. Single-family home                $282,000, up 1 percent from the previous quarter
    completions totaled 461,000 (SAAR) units, down                  but down 1 percent from a year earlier.
    4 percent from the previous quarter and 13 percent
    from a year earlier. Completions have increased in          ■   NAR reported that the median price of existing
    2 of the last 5 quarters, after having declined for             homes sold was $169,800 in the fourth quarter, down
    14 consecutive quarters, ending the fourth quarter              4 percent from the third quarter and 1 percent from
    of 2009.                                                        a year earlier. The average price of existing homes
                                                                    sold in the fourth quarter was $218,000, 3 percent
■   Manufactured housing shipments totaled 42,000                   lower than the previous quarter but 1 percent higher
    (SAAR) units in the fourth quarter, down 15 percent             than the fourth quarter of 2009. According to a NAR
    from the third quarter and 14 percent over the four-            practitioner survey, distressed sales (foreclosures
    quarter period. Onsite placements of manufactured               and short sales) represented 34 percent of all home
    housing, which are reported with a lag, reached                 sales in the fourth quarter, the same as in the third
    49,000 units in the third quarter, down 15 percent              quarter. Distressed sales prices are typically 15 to
    from the previous quarter but up 3 percent from                 20 percent below normal market prices.
    a year earlier. Manufactured housing shipments
    have increased in 2 of the last 4 quarters, following       ■   S&P/Case-Shiller® and the FHFA both produce
    a downward trend that began after the hurricane-                repeat-sales house price indices that are reported
    induced sales-order increases of late 2005.                     with a 2-month lag. The Case-Shiller® national
                                                                    index estimated that (SA) home prices in the third
                                                                    quarter of 2010 were down 3.5 percent from the
Marketing of Housing                                                previous quarter and 1.6 percent from a year earlier.
                                                                    The FHFA purchase-only national index estimated
Data on the housing marketing sector improved in the                that (SA) home prices in the third quarter were
fourth quarter of 2010. The number of both new and                  down 1.6 percent from the previous quarter and
existing homes sold rose, while the median sales prices             3.2 percent from a year earlier. The FHFA index is
of new homes was unchanged and those of existing homes              based on sales financed with mortgages that have
sold fell slightly from a year ago. The S&P Case-Shiller®           been sold to or guaranteed by Fannie Mae and
and FHFA repeat sales house price indices, which are                Freddie Mac and tends to show less volatility than
reported with a lag, estimated that house prices were               the S&P Case-Shiller® index. The lower volatility
down in the third quarter from both the second quarter              occurs mainly because the FHFA index excludes
of 2010 and the third quarter of 2009. The average                  sales transactions associated with subprime and
months’ supply of homes for sale in the fourth quarter              some “jumbo” loans and because it is transaction
fell for both new and existing homes. Home builders’                weighted instead of value weighted.
confidence, as measured by the National Association             ■   During the fourth quarter of 2010, the average
of Home Builders (NAHB)/Wells Fargo Housing Market                  inventory of new homes for sale was 195,000 units,
Index, increased in the fourth quarter.                             down 5 percent from the third quarter and 17 percent
■   During the fourth quarter of 2010, 296,000 (SAAR)               from a year earlier. That inventory would support
    new single-family homes were sold, up 2 percent                 8.0 months of sales at the current sales pace, down
    from the 291,000 (SAAR) homes sold in the third                 0.5 month from the third quarter but up 0.4 month
    quarter but down 21 percent from a year earlier.                from a year earlier. The average inventory of existing
                                                                    homes for sale in the fourth quarter was 3.713 million
■   The NATIONAL ASSOCIATION OF REALTORS®                           units, down 8 percent from the third quarter but up
    (NAR) reported that 4.803 million (SAAR) exist-                 7 percent over the four-quarter period. That inventory
    ing homes—including single-family, townhomes,                   would support 9.4 months of sales at the current
    condominiums, and cooperatives—were sold in                     sales pace, down 2.3 months from the third quarter
    the fourth quarter, up 15 percent from the previous             but up 2.4 months from a year earlier. Of concern is
    quarter but down 20 percent from year-earlier lev-              the “shadow inventory” of homes as a result of the
    els. According to a NAR practitioner survey, sales              high rate of delinquencies and foreclosures, which
    to first-time homebuyers accounted for 32 percent               has the potential to increase the supply of homes
    of all home sales transactions in the fourth quarter,           for sale and further depress home prices.
    down from 34 percent in the previous quarter.
                                                            3                                                    Summary
■   The Federal Housing Administration’s (FHA) share              during the third quarter of 2010. These delinquency
    of the mortgage market, which is reported with a              rates decreased for prime, subprime, and FHA loans.
    2-month lag, increased only for refinance loans in            The percentage of mortgage holders seriously delinquent
    the third quarter of 2010. Based on loan origination          on their mortgages (90 or more days past due or in the
    data, the FHA’s dollar volume share of the mortgage           foreclosure process) fell for the third consecutive quarter;
    market was 16.8 percent, down from 19.0 percent in            the rate had been rising since the third quarter of 2006.
    the second quarter and 18.2 percent a year earlier.           The percentage of newly initiated foreclosures (foreclo-
    For home purchase loans, the FHA’s dollar volume              sure starts), in contrast, increased for prime, subprime,
    share was 35.3 percent, down from 36.5 percent in             and FHA loans.
    the second quarter and 26.0 percent a year earlier.
    For refinance loans, the FHA’s dollar volume share            According to the MBA, the (SA) delinquency rate for
    was 10.4 percent in the third quarter, up 7.3 percent         all mortgage loans in the third quarter of 2010 was 9.13
    from the previous quarter but down from 12.3 percent          percent, down from 9.85 percent in the second quarter
    a year earlier. Based on the number of loans origi-           and 9.64 percent a year earlier. The (SA) delinquency
    nated, the FHA’s share of the mortgage market was             rate for prime mortgages was 6.29 percent in the third
    19.2 percent in the fourth quarter, down from 22.7            quarter, down from 7.10 percent in the second quarter
    percent in the previous quarter and 21.6 percent a year       and 6.84 percent a year earlier. The (SA) delinquency
    earlier. For home purchase loans, the FHA’s share of          rate for subprime mortgage loans was 26.23 percent
    the number of new mortgage loans was 40.9 percent,            in the third quarter, down from 27.02 percent in the
    down from 42.4 percent in the previous quarter but            second quarter and 26.42 percent a year earlier. For
    up from 30.3 percent a year earlier. The FHA’s share          FHA loans in the MBA survey, the (SA) delinquency
    of the number of new refinance loans was 11.1 percent         rate was 12.62 percent in the third quarter, down from
    in the third quarter, up from 8.4 percent in the previ-       13.29 percent in the second quarter and 14.36 percent
    ous quarter but down from 14.5 percent a year earlier.        a year earlier.

■   Home builders’ optimism rose in the fourth quarter            Newly initiated foreclosures represented 1.34 percent of all
    of 2010. The NAHB/Wells Fargo composite Hous-                 mortgage loans in the third quarter, up from 1.11 percent
    ing Market Index was 16, up 3 points from the third           in the second quarter but down from 1.42 percent a year
    quarter but down 1 point from a year earlier. The             earlier. The rate of newly initiated foreclosures on prime
    index for expected future sales increased from 19 to          loans was 1.12 percent in the third quarter, up from
    24 points. The composite index is based on three              0.91 percent in the second quarter but down from 1.14
    components—current market activity, future sales              percent a year earlier. Foreclosures started on subprime
    expectations, and prospective buyer traffic—and               loans rose to 3.31, after having fallen for five consecu-
    ranges from 0 to 100.                                         tive quarters. Newly initiated foreclosures on subprime
                                                                  loans were up from 2.83 percent in the second quarter
                                                                  but down from 3.76 percent a year earlier. Not all newly
Affordability, Homeownership,                                     initiated foreclosures end in foreclosure completions.
                                                                  Before the recent slowdown in the processing of fore-
and Foreclosures                                                  closures, approximately 52 percent of newly initiated
                                                                  foreclosures were completed 6 months later, which
Housing affordability, as measured by the NAR Housing             was the approximate average length of time for
Affordability Index, increased in the fourth quarter of           processing foreclosures.
2010. The NAR composite index estimates that a family
earning the median income had 185.0 percent of the                The national homeownership rate was 66.5 percent in
income needed to purchase a median-priced, existing               the fourth quarter of 2010, down from 66.9 percent in
single-family home, using standard lending guidelines.            the third quarter and 67.2 percent a year earlier. The
That value is up 11.9 percentage points over the previous         national homeownership rate has not been this low
quarter and 11.3 percentage points over the four-quarter          since 1998. The homeownership rate for minority house-
period. The increase in affordability is attributed to a          holds decreased to 48.5 percent in the fourth quarter,
0.7-percent increase in median family income, a 4-percent         down from 48.6 percent in the previous quarter and
decrease in the median sales price of existing single-            49.8 percent a year earlier. The decline in homeowner-
family homes, and a 16-basis-point decrease in mortgage           ship reflects the subprime lending crisis, the high rates
interest rates.                                                   of unemployment, and the recent severe recession.
                                                                  Servicer emphasis on home retention actions, including
Estimates from the MBA’s quarterly National Delinquency           those actions under the Making Home Affordable
Survey, which is reported with a 2-month lag, showed              Program, are helping to keep the number of newly
that the overall, short-term, and serious delinquency             initiated and completed foreclosures down, despite
rates for mortgages on 1- to 4-family homes all fell              high rates of mortgage delinquency. Foreclosure activity


Summary                                                       4
has also declined recently as lenders review internal
procedures related to the foreclosure process. This de-         2010 annual Data
cline is likely to be temporary, however, and loan modi-        Housing production indicators improved in 2010. In
fication programs cannot help all delinquent borrowers.         both the single-family and multifamily sectors, permits
In this regard, servicers have indicated that completed         and starts increased, although completions declined.
foreclosures are likely to increase as alternatives for         Shipments of manufactured homes increased 0.4 percent
seriously delinquent borrowers are exhausted.                   in 2010, the first increase in annual shipments since
                                                                2005. The marketing sector performed less well, with
                                                                both new and existing home sales declining during the
Multifamily Housing                                             past year. The median price of new homes sold rose
                                                                during 2010, while remaining steady for existing homes
Performance in the multifamily housing sector (five or          sold. Housing affordability improved during 2010,
more units) was mixed in the fourth quarter of 2010. In         although homeownership rates for the nation and for
the production sector, the number of building permits,          most groups declined. The housing sector component
starts, and completions all fell, although the decline          of GDP (residential fixed investment) declined in 2010,
in permits and completions was small. The absorption            but by a much slower rate than in 2009.
rate for multifamily apartments increased, while the
rental vacancy rate declined. The absorption rate for           ■   Builders took out permits for 447,100 new single-
condominiums and cooperatives also increased in the                 family homes in 2010, an increase of 3 percent from
fourth quarter.                                                     2009. Multifamily permits were issued for 131,000
                                                                    new units in 2010, up 11 percent from 2009.
■   During the fourth quarter of 2010, builders took out
    permits for 131,000 (SAAR) new multifamily units,           ■   Single-family housing starts totaled 471,000 units
    down 3 percent from the third quarter but up 14                 in 2010, up 6 percent from 2009, while multifamily
    percent from a year earlier.                                    housing starts totaled 105,000 units, up 8 percent
                                                                    from the previous year.
■   Builders started construction on 90,000 (SAAR)
    new multifamily units in the fourth quarter, down           ■   In 2010, construction was completed on 497,000
    35 percent from 140,000 units in the third quarter              new single-family housing units, 4 percent fewer
    but up 33 percent from 68,000 units a year earlier.             than in 2009. A total of 148,000 new multifamily
    Builders completed 114,000 (SAAR) multifamily                   units were ready for occupancy in 2010, down 43
    units in the fourth quarter, down 1 percent from the            percent from 2009.
    previous quarter and 52 percent from year-earlier
    levels.                                                     ■   Builders sold 321,000 new single-family homes in
                                                                    2010, down 14 percent from the 375,000 homes
■   Market absorption of new multifamily units in-                  they sold in 2009. For all of 2010, the median price
    creased for apartments and for condos and co-ops in             of new homes sold was $221,900, up 2.4 percent
    the fourth quarter of 2010. Of the total number of              from 2009.
    new apartments completed in the third quarter, 62
    percent were leased in the first 3 months after com-        ■   NAR reported that 4.908 million existing single-
    pletion, up from 56 percent in the third quarter and            family homes were sold in 2010, a 5-percent decrease
    10 percentage points higher than year-earlier levels.           from the 5.165 million sold in 2009. For all of 2010,
    Of the total number of new condos and co-ops com-               the median price of existing homes sold was $173,000,
    pleted in the third quarter of 2010, 40 percent were            nearly the same as in 2009.
    sold in the fourth quarter, up 2 percentage points          ■   Builders were just slightly more optimistic in 2010
    from the third quarter but down 6 percentage points             than they were in 2009. The NAHB/Wells Fargo
    from a year earlier.                                            composite Housing Market Index averaged 16 points
■   The multifamily rental vacancy rate reported by                 in 2010, up 1 point from 2009. The 2009 value was
    the Census Bureau was 10.4 percent in the fourth                the lowest annual value in the 25-year history of
    quarter of 2010, down from 11.8 percent in the third            this attitude survey.
    quarter and 12.5 percent a year earlier.                    ■   The average interest rate for 30-year, fixed-rate mort-
                                                                    gages in 2010, as reported by Freddie Mac’s Primary
                                                                    Mortgage Market Survey, was 4.69 percent, 35 basis
                                                                    points below the 2009 annual average rate, which
                                                                    set a record low.


                                                            5                                                     Summary
■   According to the NAR Housing Affordability Index,
    the affordability of housing improved in 2010, increas-
    ing by 5.2 percentage points from 2009. A family
                                                                    What Do We KnoW
    earning the median level of income ($61,583) had
    174.6 percent of the income needed to purchase
                                                                    about Single-Family
    the median-priced existing home ($173,200), while
    mortgage interest rates declined 25 basis points to             rental ProPertieS?
    4.89 in 2010. The increase in housing affordability
    is attributed to falling interest rates and a 0.8-percent
    increase in median family income, which more than               Introduction
    offset a 0.6-percent increase in the median sales price.
                                                                    The 2009 American Housing Survey1 (AHS) identified
■   The FHA guaranteed 1.625 million mortgages in                   130.1 million housing units in the United States, 77
    2010, down 20 percent from 2009. Private insur-                 percent (99.7 million) of which were one- to four-unit
    ance on mortgages decreased 28 percent in 2010 to               buildings,2 with the remaining 23 percent being multi-
    317,037 loans.                                                  family buildings with five or more units. While most
                                                                    housing discussions focus on homeownership of single-
■   Based on the Housing Vacancy supplement to the                  family buildings and rental housing within multifamily
    Current Population Survey, the proportion of Ameri-             buildings, 21 percent (20.6 million) of one- to four-unit
    can households that owned their homes in 2010                   buildings provide rental housing. The 2009 AHS found
    declined to 66.9 percent from 67.4 percent in 2009.             that 27 percent of rental housing units were in single-
    The homeownership rate for White non-Hispanic                   family-detached structures, 6 percent were located in
    households was 74.4 percent in 2010, down from                  single-family-attached structures (for example, row-
    74.8 percent in 2009; the homeownership rate for                houses sharing one or more common walls on individu-
    African-American households was 45.9 percent                    ally owned or leased lots), 20 percent were in two- to
    in 2010, down from 46.6 percent in 2009; and the                four-unit structures (for example, a duplex on a single
    homeownership rate for Hispanic households was                  lot), and 48 percent were located in buildings with five
    47.5 percent, down from 48.4 percent in 2009.                   or more units. These figures illustrate that, despite the
                                                                    focus on multifamily rental housing, the U.S. rental
■   The rental vacancy rate declined, while the absorp-
                                                                    housing stock is split nearly down the middle, 52 to 48
    tion of new apartments rose in 2010. The vacancy
                                                                    percent, between one- to four-unit, single-family, and
    rate for multifamily rental units fell to 11.6 percent
                                                                    five or more unit, multifamily, structures . In the wake
    in 2010, down from 12.3 percent in 2009. The average
                                                                    of the buildup of single-family homes during 2004
    lease rate for newly completed apartments rented
                                                                    through 2006, the housing bust of 2007 through 2010,
    within 3 months of their completion was 55 percent
                                                                    and the dramatic rise in foreclosures and vacancies
    in 2010 compared with 50 percent for all of 2009.
                                                                    in single-family homes, the one- to four-unit share of
■   The housing component of GDP (residential fixed                 rental housing is poised to increase further in 2011
    investment) declined 3.0 percent in 2010 compared               and 2012. Given the significant contribution of one- to
    with a decline of 22.9 percent in 2009.                         four-unit structures to the rental housing market, it is
                                                                    important to examine and understand the characteris-
                                                                    tics of single-family rental structures, their residents,
                                                                    their owners, their financing, and their distribution
                                                                    across the United States.


                                                                    AHS Data—Property and
                                                                    Renter Characteristics
                                                                    Table 1 shows the number of bedrooms per unit and the
                                                                    age (year built) of rental buildings with one unit, two to
                                                                    four units, and five or more units in the United States
                                                                    as reported in the 2009 AHS. The top half of Table 1
                                                                    shows that the largest share of units in multifamily
                                                                    buildings (buildings with five or more units) have one-
                                                                    bedroom while two-bedroom units account for the largest
                                                                    share of units in two- to four-unit buildings, and three-
                                                                    bedroom units account for the largest share of units in
                                                                    one-unit buildings (single-family detached or attached).

Summary                                                         6
Thus, one-unit and two- to four-unit buildings provide             units were built before 1960 versus 48.1 and 49.2 percent
more bedrooms and may be better able to accommodate                for one-unit and two- to four-unit buildings.
larger families than the average rental unit in a multi-
family property. The lower half of Table 1 shows the               Whereas Table 1 presents rental building character-
age distribution of rental buildings. In general, one-unit         istics, Tables 2 and 3 present characteristics of rental
and two- to four-unit buildings tend to be older, and              housing residents. Table 2 shows the age distribution
buildings with five or more units tend to be younger.              and race and ethnicity of renters; Table 3 shows the
For example, 19.6 percent of buildings with five or more           relative income and housing costs of rental housing
units were built after 1990 versus 16 and 9.7 percent for          residents. The top half of Table 2 shows that buildings
one-unit and two- to four-unit buildings, respectively.            with five or more units have a greater percent share of
Similarly, 22.4 percent of buildings with five or more             younger (less than 35) or older (greater than 75) residents,

Table 1. Bedrooms Per Unit and Building Age of U.S. Rental Housing Stock by Structure Type
                                                                            Structure Type
                                           1 unit (%)            2–4 units (%)         5+ units (%)            Total (%)
 Bedrooms per Unit
 Studio                                        0.5                    1.2                      4.2                 2.3
 1 bedroom                                     6.6                   26.9                     44.5                27.9
 2 bedrooms                                   31.3                   54.6                     43.9                41.8
 3 bedrooms                                   45.5                   15.3                      6.4                21.7
 4 bedrooms+                                  16.1                    2.0                      0.9                 6.4
 Total                                       100.0                  100.0                    100.0               100.0
 Building Age by Year Built
 Pre-1940                                     23.1                   33.7                     13.4                20.9
 1940–1959                                    25.0                   15.5                      9.0                15.9
 1960–1979                                    27.9                   31.0                     39.7                33.8
 1980–1989                                     8.0                   10.1                     18.3                13.1
 1990–1999                                     6.4                    5.3                      9.3                 7.5
 2000–2009                                     9.6                    4.4                     10.3                 8.8
 Total                                       100.0                  100.0                    100.0               100.0
Sources: American Housing Survey; U.S. Department of Housing and Urban Development


Table 2. Age and Race/Ethnicity of U.S. Rental Housing Residents
                                                                            Structure Type
                                           1 unit (%)            2–4 units (%)         5+ units (%)            Total (%)
 Householder Age
 Under 25 years                               10.7                   14.1                  17.3                  14.3
 25 to 29                                     13.5                   17.1                  16.6                  15.6
 30 to 34                                     14.5                   12.8                  13.6                  13.8
 35 to 44                                     24.9                   21.4                  16.4                  20.5
 45 to 54                                     18.5                   14.9                  14.6                  16.1
 55 to 64                                      9.9                   10.6                   9.2                   9.7
 65 to 74                                      4.6                    5.0                   4.9                   4.8
 75 years and over                             3.5                    4.2                   7.4                   5.3
 Total                                       100.0                  100.0                 100.0                 100.0
 Householder Race/Ethnicity
 Non-Hispanic White                           61.8                   55.9                  51.6                  56.1
 Non-Hispanic Black                           16.8                   18.5                  19.6                  18.4
 Hispanic (of any race)                       16.5                   18.9                  20.1                  18.6
 Other                                         5.0                    6.7                   8.8                   7.0
 Total                                       100.0                  100.0                 100.0                 100.0
Sources: American Housing Survey; U.S. Department of Housing and Urban Development


                                                             7                                                          Summary
Table 3. Household Income and Housing Costs Relative to Area Median Income
                                                                           Structure Type
                                            1 unit (%)         2–4 units (%)         5+ units (%)         Total (%)
                                                  Percent of Renters by Building Type in Each Income Category
 < 30% AMI                                     17.8                 25.1                     21.9               21.1
 30–50% AMI                                    18.4                 20.8                     21.1               20.1
 51–60% AMI                                     8.4                  8.2                      8.7                8.5
 61–80% AMI                                    14.6                 13.7                     13.3               13.8
 81–100% AMI                                   10.4                  9.6                      9.3                9.8
 101–120% AMI                                   9.1                  7.8                      8.6                8.6
 >120% AMI                                     21.4                 14.8                     17.0               18.1
 Total                                        100.0                100.0                    100.0              100.0
                                            Rent Affordability (% AMI Required To Afford a Particular Housing Unit)
 < 30% AMI                                      5.5                  5.9                      4.8                5.3
 30–50% AMI                                    25.4                 35.5                     26.4               28.0
 51–60% AMI                                    17.9                 22.1                     23.1               21.1
 61–80% AMI                                    26.8                 24.0                     27.2               26.4
 81–100% AMI                                   12.9                  5.7                      7.7                9.1
 101–120% AMI                                   6.5                  3.4                      4.3                4.8
 >120% AMI                                      5.0                  3.5                      6.5                5.4
 Total                                        100.0                100.0                    100.0                100
AMI = Area Median Income.
Sources: American Housing Survey; U.S. Department of Housing and Urban Development


whereas, one-unit buildings, and to a lesser extent two-          (AMI). The top half of Table 3 shows the percentage
to four-unit rental buildings, have a greater percent share       of renters by structure size that falls into each relative
of residents from the middle of the age distribution (35 to       income category. Note that the table contains only
54 years old). The split in residents in buildings with           data on renter households (families and unrelated
five units or more may be due to (1) younger households           individuals), while AMI estimates are based on all
seeking low-maintenance housing and communities                   families, including homeowners, but exclude unrelated
before making the transition into homeownership and               individuals. The table shows that residents with the
(2) older households seeking low-maintenance housing              lowest income relative to AMI (less than or equal to
and communities as they make the transition out of                30 percent of AMI) are disproportionately in two- to
single-family homeownership. The lower half of Table              four-unit buildings and, to a lesser extent, in buildings
2 shows that a higher percent share of non-Hispanic               with five or more units. Similarly, residents with the
White renters reside in one-unit rental buildings and             highest income relative to AMI (greater than or equal
that a higher percent share of non-Hispanic Black,                to 100 percent AMI) disproportionately choose to live
Hispanic, and other minority renters reside in rental             in one-unit rental buildings. The lower half of Table 3
buildings with two to four units and five or more units.          shows the percent of AMI that a household would have
The Home Mortgage Disclosure Act (HMDA) provides                  to earn to be able to afford a particular rental housing
data on the race and ethnicity of the owners of one- to           unit. Two- to four-unit buildings have the highest inci-
four-unit rental properties. In 2009, one- to four-unit           dence of affordability in the two most affordable categories
rental mortgage originations were divided at 65.6, 2.7,           (below 30 percent of AMI and 30 to 50 percent of AMI),
6.1, and 25.6 percent among the categories of non-His-            which probably reflects that two- to four-unit buildings
panic White, non-Hispanic Black, Hispanic, and other.             have a greater share of older buildings, as shown in
The high share for “other” is due, in part, to corporate          Table 1. The highest share for one-unit buildings and
or nonprofit purchases and refinances in addition to              for buildings with five or more units is within the 60-
other minorities. Race and ethnicity origination shares           to 80-percent AMI category. The share of rental units
remained relatively constant from 2004 through 2009,              requiring income equal to 80 percent of AMI or greater
with the notable exception of the non-Hispanic Black              to be affordable is the highest for one-unit buildings
share, which declined from 6.02 to 2.70 percent, while            and buildings with five or more units, probably because
the other share increased from 18.7 to 25.6 percent.              of the fact that these property types have a greater
                                                                  share of newer buildings, and one-unit buildings have a
Table 3 shows rental household income and rental                  greater share of units with three or more bedrooms, as
housing costs relative to the Area Median Income                  shown in Table 1.

Summary                                                       8
Financing and Mortgage                                                   first section presents performance for all originations
                                                                         years, with the subsequent six sections containing per-
Performance                                                              formance for origination years 2005 to 2010; the final
                                                                         section contains performance for mortgages originated
Because rental properties are purchased solely for                       before 2005. For each property type, the table shows
investment purposes and owner-occupant properties                        (1) active loan count, (2) share of loans in foreclosure,
are purchased for both the provision of shelter and                      and (3) total noncurrent share of loans.
economic returns, it is often hypothesized that pay-
ment and default behaviors differ substantially based                    Table 4 shows that the trends for both primary residences
on occupancy and that mortgages on one- to four-unit                     and rental properties have moved in tandem; that is, for
rental properties underperform the mortgages of owner-                   the all origination year groups, the share of mortgages
occupants. Figure 1 and Tables 4 and 5 use LPS Applied                   that are in foreclosure and noncurrent has increased
Analytics Mortgage Performance Data to compare first-                    for both primary residences and rental properties over
lien mortgage performance for rental property investors                  time from 2005 to 2010. The table shows that, across
and owner-occupants over time.3                                          origination years, foreclosure and noncurrent shares of
                                                                         more recent vintages (for example, 2010, 2009, 2008)
Figure 1 shows the share of active first-lien mortgages                  performed better in the first, second, and third years
that were noncurrent (30 or more days delinquent or                      after origination than vintages at the peak of the hous-
in foreclosure) as of December 31st in each year from                    ing market in 2006 and 2007. Looking at all origination
2005 through 2010––broken out by units in structure                      years, the noncurrent share for mortgages on one-unit
(one unit versus two to four units) and occupancy status                 rental properties was less than the noncurrent share on
of the property owner (primary residence, second home,                   one-unit primary residences on December 31st of each
or rental property). From 2005 through 2010, default                     year from 2005 through 2010, with the exception of
rates were lowest for one-unit second homes and high-                    December 2008. The table shows that, for individual
est for two- to four-unit primary residences (meaning                    origination years, the rental noncurrent share is less
the owner lives in one of the units), while one-unit                     than the share for primary residences at all points in
rentals, two- to four-unit rentals, and one-unit primary                 time, for all origination years, with the exception of
residences were bound by a range in the center, with                     the 2005 origination year in December 2008, at which
rental properties showing slightly lower default rates                   point the noncurrent share for rental properties exceeded
than one-unit primary residence mortgages, with the                      the noncurrent share for primary residences. Conversely,
exception of 2008, when one-unit rental defaults slightly                the rental foreclosure share exceeds the primary resi-
exceeded the default rate for one-unit primary residences.               dence foreclosure share in nearly every case. The fact
                                                                         that the noncurrent share is lower but the foreclosure
Table 4 (Table 5) shows mortgage performance for one-                    share is higher for one-unit rental properties compared
unit (two- to four-unit) primary residence and rental                    with one-unit primary residences may indicate a greater
properties over the period from 2005 through 2010 by                     willingness by lenders to work with delinquent one-
origination year. The left-hand side of the table contains               unit, owner-occupant borrowers to avoid foreclosure
performance for primary residences and the right-hand                    relative to nonowner-occupant borrowers.
side contains performance for rental properties. The

Figure 1. Percent Share Noncurrent by Occupancy and Structure Type

  20%
  18%
  16%
  14%
  12%
  10%
   8%
   6%
   4%
   2%
   0%
            December           December                  December              December         December           December
              2005               2006                      2007                  2008             2009               2010
                                   Primary (1 unit)            Second Property (1 unit)       Rental (1 unit)
                                   Primary (2–4 units)         Second Property (2–4 units)    Rental (2–4 units)
Sources: LPS Applied Analytics Mortgage Performance Data; U.S. Department of Housing and Urban Development

                                                                    9                                                     Summary
Table 5 presents performance metrics for two- to four-           to four-unit rental properties had superior performance
unit structures comparable to those shown in Table 4             across all metrics (foreclosures and noncurrent share),
for one-unit structures. While Table 4 depicts a split           at all points in time, and across all vintages. Looking
in mortgage performance between one-unit primary                 across all origination years, the average two- to four-unit
residences and rentals across origination years (primary         primary residence foreclosure and noncurrent shares
residences had lower foreclosures, but rentals had lower         are 54 and 69 percent higher, respectively, than the
delinquencies), the results in Table 5 show that two-            respective average foreclosure and noncurrent rental

Table 4. One-Unit Primary Residence and Rental Mortgage Performance by Origination Year
                                   1 Unit—Primary Residence                                1 Unit—Rental
    Origination Year
       and Date            Active Loan     Foreclosure     Total Non-       Active Loan      Foreclosure     Total Non-
                            Count (#)      Presale (%)     current (%)       Count (#)       Presale (%)     current (%)
 All origination years
          2005             18,094,560           .43              4.99          766,362           .47              3.54
          2006             19,178,465           .62              5.52          872,806           .81              4.53
          2007             21,814,454          1.16              7.10          999,095          1.73              6.66
          2008             26,052,739          1.74              9.93        1,292,266          3.52             10.59
          2009             22,611,288          3.13             13.54        1,121,994          5.31             13.47
          2010             25,353,804          3.49             11.84        1,330,817          5.00             11.01
 2010 originations
          2010               3,353,221          .04               .92          142,449            .05              .52
 2009 originations
          2009               3,335,705          .07              1.65           90,002            .08              .79
          2010               3,756,606          .53              3.88          118,615            .42             1.51
 2008 originations
          2008               2,934,941          .24              3.85          154,858           .55              2.88
          2009               1,950,230         1.83             11.17          118,951          2.30              7.13
          2010               1,926,049         3.92             14.59          137,740          3.57              7.91
 2007 originations
          2007               3,124,720          .55              5.11          189,595           .74              4.15
          2008               3,546,363         2.42             13.89          216,917          4.74             13.64
          2009               2,521,625         6.02             24.81          173,104          8.50             19.66
          2010               2,307,898         8.52             24.39          171,846          9.44             18.78
 2006 originations
          2006               3,295,294          .51              5.14          210,251           .62              4.29
          2007               3,437,312         2.73             12.28          207,153          3.32             10.36
          2008               3,421,929         4.72             19.33          212,554          7.23             18.80
          2009               2,529,104         8.76             29.57          170,865         10.94             23.93
          2010               2,229,769         9.89             27.63          165,133         11.02             21.74
 2005 originations
          2005               3,770,140          .19              3.25          221,992           .22              2.96
          2006               3,581,358          .92              6.42          201,950          1.19              4.98
          2007               3,391,028         1.86              9.18          184,174          2.69              8.26
          2008               3,565,558         2.70             12.52          201,117          5.14             13.88
          2009               2,767,412         5.03             18.82          164,937          7.74             17.85
          2010               2,556,039         5.95             18.35          169,895          7.62             16.11
 Origination before 2005
          2005             14,324,420           .49              5.45          544,370           .57              3.78
          2006             12,301,813           .57              5.36          460,605           .74              4.44
          2007             11,861,394           .66              5.53          418,173           .98              5.25
          2008             12,583,948           .82              6.94          506,820          1.70              6.89
          2009              9,507,212          1.66              9.40          404,135          2.63              9.31
          2010              9,224,222          2.38              9.71          425,139          3.22              8.83
Sources: LPS Applied Analytics Mortgage Performance Data; U.S. Department of Housing and Urban Development

Summary                                                    10
building shares. The largest differences occur in the            for rental property investors was more conservative and
most recent vintages, 2008 through 2010, in which                that the pool of two- to four-family primary residence
the average difference between primary residences and            borrowers may have contained a larger share of margin-
rental structures is 121 and 180 percent for foreclosures        ally qualified or less financially capable candidates who
and noncurrent shares, respectively. One possible                planned to use rental income to make payments that
explanation for this result could be that underwriting           did not materialize or were less than anticipated.

Table 5. Two- to Four-Unit Primary Residence and Rental Mortgage Performance by Origination Year
                                  2–4 Unit—Primary Residence                              2–4 Unit—Rental
    Origination Year
       and Date            Active Loan     Foreclosure      Total Non-      Active Loan     Foreclosure      Total Non-
                            Count (#)      Presale (%)      current (%)      Count (#)      Presale (%)      current (%)
 All origination years
          2005               328,091            .69               5.38        197,715            .44             3.21
          2006               359,005           1.24               6.58        226,562            .69             3.45
          2007               404,913           2.52               9.36        253,807           1.36             5.20
          2008               420,401           3.86              14.38        262,055           2.58             9.02
          2009               420,364           6.19              19.89        254,600           4.99            12.30
          2010               499,890           6.84              17.36        276,622           5.39            11.37
 2010 originations
          2010                44,292            .06               1.23         24,750            .03              .48
 2009 originations
          2009                44,438            .30               2.85         13,682            .14              .93
          2010                54,319           1.34               5.64         15,204            .63             1.60
 2008 originations
          2008                45,288            .72               5.99         25,434            .26             2.36
          2009                37,899           5.17              17.96         24,015           2.44             6.84
          2010                42,662           8.58              20.38         24,555           4.16             8.34
 2007 originations
          2007                72,942           1.36               6.83         49,100            .51             3.24
          2008                68,963           4.95              19.09         46,330           2.76            10.65
          2009                59,847          10.03              32.61         42,027           7.12            17.46
          2010                62,012          13.61              31.13         39,587           9.54            19.03
 2006 originations
          2006                83,886           1.12               7.08         55,708            .49             3.53
          2007                85,555           6.06              17.35         53,074           2.62             8.87
          2008                74,890           9.90              28.60         47,207           5.64            17.19
          2009                65,997          14.79              39.63         41,878          10.36            22.62
          2010                63,700          15.63              35.94         38,353          11.06            21.85
 2005 originations
          2005                82,402            .40               4.25         59,063            .19             2.97
          2006                72,691           2.06               8.43         53,607           1.04             4.38
          2007                63,548           3.38              11.63         46,211           2.12             7.17
          2008                58,819           4.73              16.91         42,789           3.92            12.32
          2009                53,778           7.86              24.27         39,057           7.21            16.84
          2010                57,016           9.29              23.69         38,483           8.22            17.23
 Origination before 2005
          2005               245,689            .78               5.76        138,652            .55             3.31
          2006               202,428           1.00               5.71        117,247            .63             2.98
          2007               182,868           1.02               5.85        105,422            .78             3.39
          2008               172,441           1.33               7.66        100,295           1.06             4.69
          2009               158,405           2.47              10.62         93,941           2.08             6.55
          2010               175,889           3.46              10.67         95,690           2.73             6.79
Sources: LPS Applied Analytics Mortgage Performance Data; U.S. Department of Housing and Urban Development


                                                            11                                                   Summary
Single-Family Mortgage                                           tion shown in Tables 4 and 5. Despite the focus on
                                                                 owner-occupied, one-unit properties, investor-owned
Purchases by Fannie Mae                                          units account for 8.6 percent (250,000) of units in 2008
                                                                 and 3.8 percent (135,000) in 2009 at Fannie Mae; they
and Freddie Mac                                                  account for 9.0 percent (175,000) of units in 2008 and
                                                                 3.3 percent (82,000) in 2009 at Freddie Mac. Two trends
Throughout the recession and since house prices peaked           apparent in Table 6 are the shifts in GSE mortgage pur-
in the second quarter of 2007 (Federal Housing Finance           chases toward owner-occupied and one-unit homes
Agency House Price Index), credit availability has tight-        from 2008 to 2009.
ened and lending has been curtailed by nearly all mort-
gage funding sources. Secondary mortgage markets for             Table 7 shows the distribution of mortgage purchases
private-label mortgage backed securities (MBS) saw a             by Fannie Mae and Freddie Mac based on loan purpose
93-percent decline in volume in 2007 and a contraction           in 2008 and 2009; that is, purchase, refinance, second
in private MBS debt outstanding in 2008, 2009, and               mortgage, rehabilitation, or other. The shares are very
the first three quarters of 2010. Conversely, mortgage           close for both GSEs within each year, although significant
pools backed by the government-sponsored enterprises             differences exist between owner-occupied and investor
(GSEs) increased from 2007 through the third quarter             properties and from 2008 to 2009. For both Fannie Mae
of 2010, providing the primary source of liquidity for           and Freddie Mac, a greater share of owner-occupied
owner occupants, single-family rental property owners,           mortgage purchases are for refinance transactions and
and multifamily property owners. Tables 6 through 9              a greater share of investor-owned mortgage purchases
compare one- to four-unit owner-occupied and investor            are for purchase transactions. In 2008, for example,
lending by Fannie Mae and Freddie Mac in 2008 and                Fannie Mae’s mortgage purchase share split was 38.4
2009, the time period during which private-label MBS             and 56.9 percent for purchase and refinance mortgages,
issuance contracted by $647.1 billion (Federal Reserve           respectively, to one-unit, owner-occupant borrowers,
Board, Flow of Funds Accounts) on net.                           whereas the share split for one-unit, investor-owned
                                                                 homes was 48.5 percent for purchase mortgages and
Table 6 shows the distribution of purchases by Fannie            51.5 percent for refinance mortgages.
Mae and Freddie Mac by occupancy and structure type;
that is, between owner-occupied and investor homes               In 2009, interest rates fell to an average of 5.04 percent
and between one-unit and two- to four-unit homes based           from 6.03 percent in 2008 and 6.37 percent in 2007, based
on unpaid principle balance, the number of mortgages,            on Freddie Mac’s Primary Mortgage Market Survey;
and the number of units in 2008 and 2009. For both               these low rates sparked a refinancing boom for owner-
Fannie Mae and Freddie Mac in both 2008 and 2009,                occupants. Table 7 shows that the share of Fannie Mae’s
most of their purchases are for one-unit versus two- to          2009 mortgage purchases for one-unit, owner-occupant
four-unit properties and owner-occupied homes versus             purchase transactions fell to 21.6 percent, down 16.8
investor homes, similar to the overall market composi-           percentage points from 2008, and that the one-unit,

Table 6. GSE Purchase Composition by Structure and Occupancy
                                                      Fannie Mae                                 Freddie Mac

      Property or Structure Type                        Number                                      Number
                                           UPB                        Number           UPB                       Number
                                                     of Mortgages                                of Mortgages
                                        ($ Millions)                  of Units      ($ Millions)                 of Units
                                                      (Properties)                                (Properties)
                                                                                 2008
 Owner-occupied 1 unit                     92.8%         91.3%         88.4%             92.5%      91.3%         88.4%
 Owner-occupied 2–4 units                   1.8%          1.4%          2.9%              1.8%       1.2%          2.6%
 Investor-owned 1 unit                      4.4%          6.3%          6.1%              4.3%       6.3%          6.1%
 Investor-owned 2–4 units                   1.0%          1.1%          2.5%              1.3%       1.2%          3.0%
 Total                                    100.0%        100.0%        100.0%            100.0%     100.0%        100.0%
                                                                                 2009
 Owner-occupied 1 unit                     96.3%         95.7%         93.8%             97.0%      96.5%         95.0%
 Owner-occupied 2–4 units                   1.5%          1.1%          2.5%              1.0%       0.7%          1.7%
 Investor-owned 1 unit                      1.9%          2.7%          2.7%              1.6%       2.4%          2.4%
 Investor-owned 2–4 units                   0.4%          0.4%          1.1%              0.4%       0.4%          1.0%
 Total                                    100.0%        100.0%        100.0%            100.0%     100.0%        100.0%
GSE = government-sponsored enterprise. UPB = unpaid principal balance.
Sources: Federal Housing Finance Agency; U.S. Department of Housing and Urban Development


Summary                                                     12
Table 7. GSE Purchase Composition by Loan Purpose
                                      Fannie Mae                                            Freddie Mac
                               Property or Structure Type                           Property or Structure Type
      Loan           Owner-       Owner-      Investor-     Investor-    Owner-       Owner-       Investor-     Investor-
     Purpose        Occupied     Occupied      Owned         Owned      Occupied     Occupied       Owned         Owned
                     1 Unit      2–4 Units     1 Unit       2–4 Units    1 Unit      2–4 Units      1 Unit       2–4 Units
                       (%)          (%)          (%)           (%)         (%)          (%)           (%)           (%)
                                                                     2008
 Purchase              38.4        29.4         48.5          39.4           39.3       35.6         43.9          38.9
 Refinance             56.9        63.9         51.5          60.5           60.7       64.4         56.1          61.1
 2nd mortgage           0.0         0.0          0.0           0.0            0.0        0.0          0.0           0.0
 Rehabilitation         0.0         0.1          0.0           0.1            0.0        0.0          0.0           0.0
 NA                     4.7         6.7          0.0           0.0            0.0        0.0          0.0           0.0
 Total                100.0       100.0        100.0         100.0          100.0      100.0        100.0         100.0
                                                                     2009
 Purchase              21.6        23.8         47.1          44.4           21.1       24.7         46.5          39.2
 Refinance             76.6        71.7         52.8          55.3           78.9       75.3         53.5          60.8
 2nd mortgage           0.0         0.0          0.0           0.0            0.0        0.0           0.0          0.0
 Rehabilitation         0.0         0.1          0.1           0.3            0.0        0.0           0.0          0.0
 NA                     1.8         4.5          0.0           0.0            0.0        0.0           0.0          0.0
 Total                100.0       100.0        100.0         100.0          100.0      100.0          100          100
GSE = government-sponsored enterprise. NA = not applicable or unknown.
Sources: Federal Housing Finance Agency; U.S. Department of Housing and Urban Development


owner-occupant refinance share increased 19.7 percent-           one-unit investor-owned, and two- to four-unit investor-
age points to 76.6 percent. The lower mortgage rates             owned purchases, respectively, had rents that were
had less of an effect on the investor market as Fannie           affordable at or below 80 percent of AMI, and, in 2009,
Mae’s 2009 purchase and refinance shares for one-unit,           the shares were 82.6, 64.7, and 79.6 percent, respectively.
investor-owned homes were 47.1 and 52.8 percent,
respectively––down 1.4 percentage points and up 1.3              Table 9 shows GSE mortgage purchases in underserved
percentage points, respectively, from 2008.                      areas by structure and occupancy type. In 2008, one-unit,
                                                                 owner-occupied homes financed by Fannie Mae and
In both 2008 and 2009, GSE purchases of investor pur-            Freddie Mac had the lowest percent share in under-
chase and refinance mortgages were approximately equal,          served areas, at 31.3 and 31.1 percent, respectively, and
while GSE purchases of owner-occupant mortgages                  two- to four-unit, owner-occupied homes had the highest
shifted towards refinances as interest rates declined in         percent share, 73.8 and 71.5 percent, respectively. From
2009. In the presence of the declining purchase share            2008 to 2009, the share of mortgage purchases in under-
for owner-occupants, the consistency of the investor             served areas decreased for all structure and occupancy
purchase share likely helped stabilize housing prices,           types, although the rank order (highest percent share
by reducing the glut of unsold properties.                       to lowest percent share) remained the same across
                                                                 structure and occupancy types, with Fannie Mae (Freddie
Tables 8 and 9 show the extent to which GSE mortgage             Mac) underserved area purchases being 67.5 percent
purchases supported affordable rental properties and the         (64.6 percent) for two- to four-unit, owner-occupied
extension of credit in underserved areas. Table 8 shows          buildings; 66.3 percent (63.0 percent) for two- to four-
that a significant share of Fannie Mae’s and Freddie             unit, investor-owned buildings; 45.9 percent (43.3 percent)
Mac’s mortgage purchases of one-unit, investor-owned             for one-unit, investor-owned homes; and 24.6 percent
homes and two- to four-unit structures have rents that           (22.5 percent) for one-unit, owner-occupied homes.
are affordable4 at or below 80 percent of AMI and that           Thus, the GSEs’ single-family rental mortgage pur-
the percent shares remained relatively constant in 2008          chase programs disproportionately increased lending
and 2009. In 2008, for example, 87.7, 53.6, and 73.7 per-        in underserved areas compared with their one-unit,
cent of Freddie Mac’s two- to four-unit owner-occupied,          owner-occupant mortgage purchases.


                                                            13                                                     Summary
Table 8. GSE Purchase Composition––Rent Affordability
                                                  Fannie Mae                                          Freddie Mac
                                           Property or Structure Type                          Property or Structure Type
              Rent                Owner-   Owner- Investor- Investor- Owner- Owner- Investor- Investor-
          Affordability*         Occupied Occupied Owned     Owned Occupied Occupied Owned     Owned
                                  1 Unit 2–4 Units 1 Unit 2–4 Units 1 Unit 2–4 Units 1 Unit 2–4 Units
                                    (%)     (%)      (%)       (%)     (%)    (%)      (%)       (%)
                                                                                2008
 >100% of area median                0.0         7.6       15.3           7.8            0.0         6.1       14.4           9.2
 81% to 100% of area median          0.0         8.6       16.3          11.5            0.0         5.0       13.2          10.5
 51% to 80% of area median           0.0        17.4       36.0          46.3            0.0        28.1       31.5          40.9
 ≤50% area median                    0.0         7.5       18.9          27.7            0.0        59.6       22.1          32.8
 0% or missing data                100.0        58.9       13.6           6.7          100.0         1.2       18.8           6.6
 Total                             100.0       100.0      100.0         100.0          100.0       100.0      100.0         100.0
                                                                                2009
 >100% of area median                0.0         5.5       17.3           8.0            0.0         9.1       14.4           7.7
 81% to 100% of area median          0.0         7.3       17.0          11.8            0.0         7.3       16.1          10.6
 51% to 80% of area median           0.0        16.8       37.1          46.6            0.0        34.5       39.4          44.1
 ≤50% area median                    0.0         8.0       17.0          27.5            0.0        48.1       25.3          35.5
 0% or missing data                100.0        62.4       11.6           6.2          100.0         1.0        4.8           2.0
 Total                             100.0       100.0      100.0         100.0          100.0       100.0      100.0         100.0
*Rent to median tract income ratio.
Sources: Federal Housing Finance Agency; U.S. Department of Housing and Urban Development

Table 9. GSE Purchase Composition in Underserved Areas
                                                  Fannie Mae                                          Freddie Mac
                                           Property or Structure Type                          Property or Structure Type
                                  Owner-   Owner- Investor- Investor- Owner- Owner- Investor- Investor-
                                 Occupied Occupied Owned     Owned Occupied Occupied Owned     Owned
                                  1 Unit 2–4 Units 1 Unit 2–4 Units 1 Unit 2–4 Units 1 Unit 2–4 Units
                                    (%)     (%)      (%)       (%)     (%)    (%)      (%)       (%)
                                                                                2008
 Served                            68.6         26.1       48.4      31.7           68.8            28.4       47.8          31.8
 Underserved                       31.3         73.8       51.5      68.1           31.1            71.5       52.1          68.1
 Bad GEOCODE/NA                     0.1          0.1        0.1       0.2            0.1             0.1        0.1           0.1
 Total                            100.0        100.0      100.0     100.0          100.0           100.0      100.0         100.0
                                                                                2009
 Served                            75.3         32.4       54.0      33.6           77.3            35.2       56.5          36.8
 Underserved                       24.6         67.5       45.9      66.3           22.5            64.6       43.3          63.0
 Bad GEOCODE/NA                     0.1          0.1        0.1       0.1            0.2             0.2        0.2           0.2
 Total                            100.0        100.0      100.0     100.0          100.0           100.0      100.0         100.0
NA = not available.
Sources: Federal Housing Finance Agency; U.S. Department of Housing and Urban Development


Summary                                                     14
Distribution of U.S. Rental                                              Table 11 shows the distribution of one-unit rental
                                                                         properties relative to one-unit primary residences in
Structures                                                               the 50 states and the District of Columbia, based on
                                                                         the Lender Processing Services Mortgage Performance
Tables 10 and 11 present data on the geographic distribu-                Data at the end of 2010. Although California, Florida,
tion of U.S. rental properties. The top half of Table 10                 and Texas have the greatest number of one-unit rental
shows that 1-unit rental properties are most heavily                     properties, only Florida (ranked 7th) is within the top-10
concentrated in the suburbs, while all other property                    list of states by relative one-unit rental share. Table 11
types (from 2- to 4-unit buildings up to properties with                 lists states ordered by the ratio of the “percent of one-
50 or more units) are most heavily concentrated in                       unit rental properties” to the “percent of one-unit primary
central cities. The lower half of Table 10 shows that,                   residences” for each state. This ratio gives an indica-
on a regional basis, 1-unit properties are most heavily                  tion of which states have a disproportionate share of
concentrated in the South and West. Properties with                      one-unit rental properties (ratio is greater than 1) and
2 to 4 units are more evenly distributed, with slightly                  which states may have a shortage of one-unit rental
higher concentrations in the Northeast and South.                        properties or an environment that does not lend itself
Similar to 1-unit properties, properties of 5 to 49 units                to one-unit rentals (ratio is less than 1), relative to
are most heavily concentrated in the South and West,                     primary residences. The five highest one-unit rental
while concentrations of properties with 50 or more                       to primary residence ratios are in Hawaii, Nevada, the
units align more closely with 2- to 4-unit property                      District of Columbia, Arizona, and Idaho. The five
concentrations in the Northeast and South.                               lowest ratios are in Connecticut, North Dakota, Iowa,
                                                                         New York, and Massachusetts.

Table 10. Regional and Urban Distribution of U.S. Rental Structures
                                                                        Structure Type
                           Single Family      2–4 Units           5–19 Units       20–49 Units        50+ Units         Total
                                                                    City/Suburban Status
 Central city                   33.7%            48.7%               47.0%           54.8%               67.2%            45.2%
 Suburb                         43.3%            35.3%               44.3%           37.5%               29.8%            40.2%
 Nonmetro                       23.0%            16.0%                8.8%            7.7%                3.0%            14.6%
 Total units (#)            10,896,007        6,679,178           8,514,613      3,007,953            2,740,682       31,838,432
                                                                              Region
 Midwest                        20.4%            23.6%               20.6%                18.6%          19.1%            20.8%
 Northeast                      12.0%            28.1%               15.8%                21.4%          31.4%            19.0%
 South                          40.8%            26.0%               38.1%                31.8%          26.2%            34.8%
 West                           26.8%            22.4%               25.6%                28.2%          23.4%            25.4%
 Total units (#)            10,896,007        6,679,178           8,514,613            3,007,953      2,740,682       31,838,432
Sources: American Housing Survey; U.S. Department of Housing and Urban Development

Table 11. Relative Distribution of One-Unit Rental Homes
                                        1-Unit Rentals and Rental-to-Primary Residence Ratio
   State           Ratio        State        Ratio        State          Ratio          State      Ratio      State       Ratio
    HI              1.8          CA           1.3         ME              1.0            IN        0.9        IL           0.7
    NV              1.7          DE           1.3         MO              1.0            RI        0.9        NH           0.6
    DC              1.6          SC           1.2         WY              1.0            KY        0.9        MN           0.6
    AZ              1.6          WA           1.2         TX              0.9            AR        0.8        NE           0.6
    ID              1.6          VA           1.1         AL              0.9            LA        0.8        SD           0.6
    OR              1.5          GA           1.1         MS              0.9            MI        0.8        NJ           0.6
    FL              1.4          MT           1.1         KS              0.9            PA        0.7        MA           0.6
    CO              1.4          UT           1.1         OH              0.9            WV        0.7        NY           0.6
    NM              1.4          OK           1.1         TN              0.9            WI        0.7        IA           0.5
    NC              1.3          VA           1.0         MD              0.9            AK        0.7        ND           0.5
                                                                                                              CT           0.5
Sources: LPS Applied Analytics Mortgage Performance Data; U.S. Department of Housing and Urban Development


                                                                   15                                                     Summary
Conclusion                                                          Although it is common to think of rental “properties” as
                                                                  2

                                                                  meaning one or more buildings under common manage-
                                                                  ment and financing, most federal government surveys
Although housing discussions traditionally focus on
                                                                  actually collect information on individual buildings,
homeownership in single-family properties and rental
                                                                  not properties; exceptions are the Property Owners and
housing within multifamily properties, 21 percent of
                                                                  Managers Survey of 1996 and the Residential Finance
single-family, one- to four-unit buildings are used as
                                                                  Surveys of 2001 and earlier. HUD and the Census Bureau
rental properties, and 2009 AHS data show that U.S.
                                                                  are currently developing a Rental Housing Finance Survey
rental housing is split nearly down the middle, 52 to
                                                                  that will also attempt to survey properties rather than
48 percent, between one- to four-unit, single-family
                                                                  individual buildings. On the other hand, private-sector
dwellings and multifamily buildings with five or more
                                                                  financing data is more likely to be for properties than for
units. The characteristics of rental units vary signifi-
                                                                  individual buildings.
cantly in terms of size (number of bedrooms), structure
type, age, and geography. At the same time, the residents         3
                                                                   This comparison may exclude financing for some one- to
of different kinds of rental housing vary significantly in        four-unit structures that are part of properties with five or
age, race and ethnicity, and income. Analysis of mortgage         more units.
data for owner-occupied and rental properties indicates
that, with sound underwriting, mortgages on rental                4
                                                                   In Table 8, affordability is defined as the share of rental
properties perform at least as well as owner-occupant             units that have rents less than or equal to a given share of
mortgages such that reluctance to extend credit to                AMI. For example, in 2009, 17.0 percent of Fannie Mae’s
rental property investors because of the perception of            one-unit, investor property mortgage purchases had rents
elevated risk may be unwarranted. Revisiting lending              equal to less than 50 percent of AMI.
to rental property investors could assist housing markets
in working through the glut of vacant single-family
properties and help victims of the foreclosure crisis by          Glossary
providing additional rental housing opportunities.
                                                                  active loan. Mortgage actively being serviced by a
                                                                  mortgage servicer.
Notes                                                             in foreclosure. Mortgage that has been referred to an
1
 The American Housing Survey is conducted by the Cen-             attorney to begin foreclosure proceedings, but for which
sus Bureau for the U.S. Department of Housing and Urban           the foreclosure sale or auction has not yet happened.
Development (HUD).                                                noncurrent. Mortgage that is either 30 or more days
                                                                  delinquent or is in foreclosure.


Summary                                                      16

Mais conteúdo relacionado

Mais procurados

Socio-Economic Impacts of Internal Displacement and Veteran Return (May 2017)
Socio-Economic Impacts of Internal Displacement and Veteran Return (May 2017)Socio-Economic Impacts of Internal Displacement and Veteran Return (May 2017)
Socio-Economic Impacts of Internal Displacement and Veteran Return (May 2017)DonbassFullAccess
 
Rural Poland. Rural development report.
Rural Poland. Rural development report.Rural Poland. Rural development report.
Rural Poland. Rural development report.fundacjafdpa
 
Five-Year Economic Development Strategy for the District of Columbia
Five-Year Economic Development Strategy for the District of ColumbiaFive-Year Economic Development Strategy for the District of Columbia
Five-Year Economic Development Strategy for the District of ColumbiaWashington, DC Economic Partnership
 
The nigerian tourism sector and the impact of fiscal policy.a case study of 2...
The nigerian tourism sector and the impact of fiscal policy.a case study of 2...The nigerian tourism sector and the impact of fiscal policy.a case study of 2...
The nigerian tourism sector and the impact of fiscal policy.a case study of 2...Attah Peter
 
Marine corps intelligence activity georgia country handbook
Marine corps intelligence activity georgia country handbookMarine corps intelligence activity georgia country handbook
Marine corps intelligence activity georgia country handbookRepentSinner
 
The Situation of Adolescents and Youth in the Middle East and North Africa Re...
The Situation of Adolescents and Youth in the Middle East and North Africa Re...The Situation of Adolescents and Youth in the Middle East and North Africa Re...
The Situation of Adolescents and Youth in the Middle East and North Africa Re...Nicholas Cooper
 
Distribution the particular Wings- The software Safety measures Concurrence r...
Distribution the particular Wings- The software Safety measures Concurrence r...Distribution the particular Wings- The software Safety measures Concurrence r...
Distribution the particular Wings- The software Safety measures Concurrence r...may610eila
 
NCRC_Home_Mortgage_Lending_in_St._Louis_Milwaukee_Minneapolis_and_Surrounding...
NCRC_Home_Mortgage_Lending_in_St._Louis_Milwaukee_Minneapolis_and_Surrounding...NCRC_Home_Mortgage_Lending_in_St._Louis_Milwaukee_Minneapolis_and_Surrounding...
NCRC_Home_Mortgage_Lending_in_St._Louis_Milwaukee_Minneapolis_and_Surrounding...Nicole West
 
Economic overview-final[1]
Economic overview-final[1]Economic overview-final[1]
Economic overview-final[1]carrieriddle
 
Energy Open Gov Plan
Energy Open Gov PlanEnergy Open Gov Plan
Energy Open Gov PlanGovLoop
 
Phase I – Literature Review
Phase I – Literature ReviewPhase I – Literature Review
Phase I – Literature Revieweconsultbw
 
1_CITY_OF_TAMPA_2006_profile_entire_document_final
1_CITY_OF_TAMPA_2006_profile_entire_document_final1_CITY_OF_TAMPA_2006_profile_entire_document_final
1_CITY_OF_TAMPA_2006_profile_entire_document_finalJennifer Schroeder
 
Equality At Work The Contimuing Challenge
Equality At Work The Contimuing ChallengeEquality At Work The Contimuing Challenge
Equality At Work The Contimuing ChallengeLakesia Wright
 

Mais procurados (19)

Socio-Economic Impacts of Internal Displacement and Veteran Return (May 2017)
Socio-Economic Impacts of Internal Displacement and Veteran Return (May 2017)Socio-Economic Impacts of Internal Displacement and Veteran Return (May 2017)
Socio-Economic Impacts of Internal Displacement and Veteran Return (May 2017)
 
CASE Network Report 44 - Restructuring and Development of the Banking Sector ...
CASE Network Report 44 - Restructuring and Development of the Banking Sector ...CASE Network Report 44 - Restructuring and Development of the Banking Sector ...
CASE Network Report 44 - Restructuring and Development of the Banking Sector ...
 
Final_Results_2016
Final_Results_2016Final_Results_2016
Final_Results_2016
 
Rural Poland. Rural development report.
Rural Poland. Rural development report.Rural Poland. Rural development report.
Rural Poland. Rural development report.
 
Five-Year Economic Development Strategy for the District of Columbia
Five-Year Economic Development Strategy for the District of ColumbiaFive-Year Economic Development Strategy for the District of Columbia
Five-Year Economic Development Strategy for the District of Columbia
 
The nigerian tourism sector and the impact of fiscal policy.a case study of 2...
The nigerian tourism sector and the impact of fiscal policy.a case study of 2...The nigerian tourism sector and the impact of fiscal policy.a case study of 2...
The nigerian tourism sector and the impact of fiscal policy.a case study of 2...
 
Marine corps intelligence activity georgia country handbook
Marine corps intelligence activity georgia country handbookMarine corps intelligence activity georgia country handbook
Marine corps intelligence activity georgia country handbook
 
The Situation of Adolescents and Youth in the Middle East and North Africa Re...
The Situation of Adolescents and Youth in the Middle East and North Africa Re...The Situation of Adolescents and Youth in the Middle East and North Africa Re...
The Situation of Adolescents and Youth in the Middle East and North Africa Re...
 
Distribution the particular Wings- The software Safety measures Concurrence r...
Distribution the particular Wings- The software Safety measures Concurrence r...Distribution the particular Wings- The software Safety measures Concurrence r...
Distribution the particular Wings- The software Safety measures Concurrence r...
 
Report 2016
Report 2016Report 2016
Report 2016
 
NCRC_Home_Mortgage_Lending_in_St._Louis_Milwaukee_Minneapolis_and_Surrounding...
NCRC_Home_Mortgage_Lending_in_St._Louis_Milwaukee_Minneapolis_and_Surrounding...NCRC_Home_Mortgage_Lending_in_St._Louis_Milwaukee_Minneapolis_and_Surrounding...
NCRC_Home_Mortgage_Lending_in_St._Louis_Milwaukee_Minneapolis_and_Surrounding...
 
Economic overview-final[1]
Economic overview-final[1]Economic overview-final[1]
Economic overview-final[1]
 
CASE Network Report 36 - Rational Pension Supervision.First Experiencies of C...
CASE Network Report 36 - Rational Pension Supervision.First Experiencies of C...CASE Network Report 36 - Rational Pension Supervision.First Experiencies of C...
CASE Network Report 36 - Rational Pension Supervision.First Experiencies of C...
 
Energy Open Gov Plan
Energy Open Gov PlanEnergy Open Gov Plan
Energy Open Gov Plan
 
CASE Network Report 37 - Fiscal Effects from Privatization: Case of Bulgaria ...
CASE Network Report 37 - Fiscal Effects from Privatization: Case of Bulgaria ...CASE Network Report 37 - Fiscal Effects from Privatization: Case of Bulgaria ...
CASE Network Report 37 - Fiscal Effects from Privatization: Case of Bulgaria ...
 
Phase I – Literature Review
Phase I – Literature ReviewPhase I – Literature Review
Phase I – Literature Review
 
1_CITY_OF_TAMPA_2006_profile_entire_document_final
1_CITY_OF_TAMPA_2006_profile_entire_document_final1_CITY_OF_TAMPA_2006_profile_entire_document_final
1_CITY_OF_TAMPA_2006_profile_entire_document_final
 
RAND_TR715
RAND_TR715RAND_TR715
RAND_TR715
 
Equality At Work The Contimuing Challenge
Equality At Work The Contimuing ChallengeEquality At Work The Contimuing Challenge
Equality At Work The Contimuing Challenge
 

Destaque

Saint mary of the cross
Saint mary of the crossSaint mary of the cross
Saint mary of the crossRob WFlag
 
Huddojstatement
HuddojstatementHuddojstatement
HuddojstatementRob WFlag
 
Erie pennsylvania analysis housing
Erie pennsylvania analysis housingErie pennsylvania analysis housing
Erie pennsylvania analysis housingRob WFlag
 
Victoria House Closed For Business. Thank You & God Bless.
Victoria House  Closed For Business. Thank You & God Bless.Victoria House  Closed For Business. Thank You & God Bless.
Victoria House Closed For Business. Thank You & God Bless.Rob WFlag
 
Worst casedisabilities03 2011
Worst casedisabilities03 2011Worst casedisabilities03 2011
Worst casedisabilities03 2011Rob WFlag
 
Us dop florida settlement press release
Us dop florida settlement press releaseUs dop florida settlement press release
Us dop florida settlement press releaseRob WFlag
 
Zoning Hearing Board 2009 04-28 agenda
Zoning Hearing Board 2009 04-28 agendaZoning Hearing Board 2009 04-28 agenda
Zoning Hearing Board 2009 04-28 agendaRob WFlag
 
City of Erie, Zoning Board, Burea confirming 11 18-10 availability for confer...
City of Erie, Zoning Board, Burea confirming 11 18-10 availability for confer...City of Erie, Zoning Board, Burea confirming 11 18-10 availability for confer...
City of Erie, Zoning Board, Burea confirming 11 18-10 availability for confer...Rob WFlag
 

Destaque (8)

Saint mary of the cross
Saint mary of the crossSaint mary of the cross
Saint mary of the cross
 
Huddojstatement
HuddojstatementHuddojstatement
Huddojstatement
 
Erie pennsylvania analysis housing
Erie pennsylvania analysis housingErie pennsylvania analysis housing
Erie pennsylvania analysis housing
 
Victoria House Closed For Business. Thank You & God Bless.
Victoria House  Closed For Business. Thank You & God Bless.Victoria House  Closed For Business. Thank You & God Bless.
Victoria House Closed For Business. Thank You & God Bless.
 
Worst casedisabilities03 2011
Worst casedisabilities03 2011Worst casedisabilities03 2011
Worst casedisabilities03 2011
 
Us dop florida settlement press release
Us dop florida settlement press releaseUs dop florida settlement press release
Us dop florida settlement press release
 
Zoning Hearing Board 2009 04-28 agenda
Zoning Hearing Board 2009 04-28 agendaZoning Hearing Board 2009 04-28 agenda
Zoning Hearing Board 2009 04-28 agenda
 
City of Erie, Zoning Board, Burea confirming 11 18-10 availability for confer...
City of Erie, Zoning Board, Burea confirming 11 18-10 availability for confer...City of Erie, Zoning Board, Burea confirming 11 18-10 availability for confer...
City of Erie, Zoning Board, Burea confirming 11 18-10 availability for confer...
 

Semelhante a USHMCR 4Q, 2010 summary

2010 Canadian Housing Observer, Fabio Recine remax
2010 Canadian Housing Observer, Fabio Recine remax2010 Canadian Housing Observer, Fabio Recine remax
2010 Canadian Housing Observer, Fabio Recine remaxFabio Recine
 
WalkUp-Wake-Up-Call-Michigan-Metros
WalkUp-Wake-Up-Call-Michigan-MetrosWalkUp-Wake-Up-Call-Michigan-Metros
WalkUp-Wake-Up-Call-Michigan-MetrosJason Li
 
Orange County Economic Element
Orange County Economic Element Orange County Economic Element
Orange County Economic Element Luis Nieves-Ruiz
 
Analysis of International Funding to Tackle IWT
Analysis of International Funding to Tackle IWTAnalysis of International Funding to Tackle IWT
Analysis of International Funding to Tackle IWThasita
 
Diverted Homeowners, the Rental Crisis and Foregone Household Formation
Diverted Homeowners,  the Rental Crisis and Foregone Household FormationDiverted Homeowners,  the Rental Crisis and Foregone Household Formation
Diverted Homeowners, the Rental Crisis and Foregone Household FormationJerryLewless
 
Wills estates book two final final final
Wills  estates book two final final finalWills  estates book two final final final
Wills estates book two final final finalMary Jane Abram
 
Genworth International Mortgage Trends Report 2011
Genworth International Mortgage Trends Report 2011Genworth International Mortgage Trends Report 2011
Genworth International Mortgage Trends Report 2011Genworth Australia
 
Nn 2011 straw poll
Nn 2011 straw pollNn 2011 straw poll
Nn 2011 straw pollDocJess
 
Cmm wills estates book one final final final
Cmm wills  estates book one final final finalCmm wills  estates book one final final final
Cmm wills estates book one final final finalMary Jane Abram
 
walkup-wake-up-call-boston
walkup-wake-up-call-bostonwalkup-wake-up-call-boston
walkup-wake-up-call-bostonJason Li
 
Pakistan Rural Factor Markets Study :Policy Reforms for Growth and Equity
Pakistan Rural Factor Markets Study :Policy Reforms for Growth and EquityPakistan Rural Factor Markets Study :Policy Reforms for Growth and Equity
Pakistan Rural Factor Markets Study :Policy Reforms for Growth and Equityidspak
 
The U.S. Military Response to the 2010 Haiti Earthquake
The U.S. Military Response to the 2010 Haiti EarthquakeThe U.S. Military Response to the 2010 Haiti Earthquake
The U.S. Military Response to the 2010 Haiti EarthquakeStanleylucas
 
Statutory Valuation of Individual Life and Annuity Contracts.pdf
Statutory Valuation of Individual Life and Annuity Contracts.pdfStatutory Valuation of Individual Life and Annuity Contracts.pdf
Statutory Valuation of Individual Life and Annuity Contracts.pdfjasondai118
 
Haiti" World Bank Public Expenditure Management and Financial Accountability ...
Haiti" World Bank Public Expenditure Management and Financial Accountability ...Haiti" World Bank Public Expenditure Management and Financial Accountability ...
Haiti" World Bank Public Expenditure Management and Financial Accountability ...Stanleylucas
 
Mi’kmaw matrimonial real property a guide for bear river, millbrook, paqtnkek...
Mi’kmaw matrimonial real property a guide for bear river, millbrook, paqtnkek...Mi’kmaw matrimonial real property a guide for bear river, millbrook, paqtnkek...
Mi’kmaw matrimonial real property a guide for bear river, millbrook, paqtnkek...Mary Jane Abram
 
NATIONAL MONITORING SYSTEM REPORT ON THE SITUATION OF INTERNALLY DISPLACED PE...
NATIONAL MONITORING SYSTEM REPORT ON THE SITUATION OF INTERNALLY DISPLACED PE...NATIONAL MONITORING SYSTEM REPORT ON THE SITUATION OF INTERNALLY DISPLACED PE...
NATIONAL MONITORING SYSTEM REPORT ON THE SITUATION OF INTERNALLY DISPLACED PE...DonbassFullAccess
 

Semelhante a USHMCR 4Q, 2010 summary (20)

San Diego Regional Homeless Profile
San Diego Regional Homeless ProfileSan Diego Regional Homeless Profile
San Diego Regional Homeless Profile
 
2010 Canadian Housing Observer, Fabio Recine remax
2010 Canadian Housing Observer, Fabio Recine remax2010 Canadian Housing Observer, Fabio Recine remax
2010 Canadian Housing Observer, Fabio Recine remax
 
WalkUp-Wake-Up-Call-Michigan-Metros
WalkUp-Wake-Up-Call-Michigan-MetrosWalkUp-Wake-Up-Call-Michigan-Metros
WalkUp-Wake-Up-Call-Michigan-Metros
 
Orange County Economic Element
Orange County Economic Element Orange County Economic Element
Orange County Economic Element
 
US Housing Demand
US Housing DemandUS Housing Demand
US Housing Demand
 
Analysis of International Funding to Tackle IWT
Analysis of International Funding to Tackle IWTAnalysis of International Funding to Tackle IWT
Analysis of International Funding to Tackle IWT
 
Diverted Homeowners, the Rental Crisis and Foregone Household Formation
Diverted Homeowners,  the Rental Crisis and Foregone Household FormationDiverted Homeowners,  the Rental Crisis and Foregone Household Formation
Diverted Homeowners, the Rental Crisis and Foregone Household Formation
 
Wills estates book two final final final
Wills  estates book two final final finalWills  estates book two final final final
Wills estates book two final final final
 
Genworth International Mortgage Trends Report 2011
Genworth International Mortgage Trends Report 2011Genworth International Mortgage Trends Report 2011
Genworth International Mortgage Trends Report 2011
 
Nn 2011 straw poll
Nn 2011 straw pollNn 2011 straw poll
Nn 2011 straw poll
 
Cmm wills estates book one final final final
Cmm wills  estates book one final final finalCmm wills  estates book one final final final
Cmm wills estates book one final final final
 
walkup-wake-up-call-boston
walkup-wake-up-call-bostonwalkup-wake-up-call-boston
walkup-wake-up-call-boston
 
Pakistan Rural Factor Markets Study :Policy Reforms for Growth and Equity
Pakistan Rural Factor Markets Study :Policy Reforms for Growth and EquityPakistan Rural Factor Markets Study :Policy Reforms for Growth and Equity
Pakistan Rural Factor Markets Study :Policy Reforms for Growth and Equity
 
The U.S. Military Response to the 2010 Haiti Earthquake
The U.S. Military Response to the 2010 Haiti EarthquakeThe U.S. Military Response to the 2010 Haiti Earthquake
The U.S. Military Response to the 2010 Haiti Earthquake
 
RAND_Aff_housing
RAND_Aff_housingRAND_Aff_housing
RAND_Aff_housing
 
Statutory Valuation of Individual Life and Annuity Contracts.pdf
Statutory Valuation of Individual Life and Annuity Contracts.pdfStatutory Valuation of Individual Life and Annuity Contracts.pdf
Statutory Valuation of Individual Life and Annuity Contracts.pdf
 
Haiti" World Bank Public Expenditure Management and Financial Accountability ...
Haiti" World Bank Public Expenditure Management and Financial Accountability ...Haiti" World Bank Public Expenditure Management and Financial Accountability ...
Haiti" World Bank Public Expenditure Management and Financial Accountability ...
 
yellowgrass
yellowgrassyellowgrass
yellowgrass
 
Mi’kmaw matrimonial real property a guide for bear river, millbrook, paqtnkek...
Mi’kmaw matrimonial real property a guide for bear river, millbrook, paqtnkek...Mi’kmaw matrimonial real property a guide for bear river, millbrook, paqtnkek...
Mi’kmaw matrimonial real property a guide for bear river, millbrook, paqtnkek...
 
NATIONAL MONITORING SYSTEM REPORT ON THE SITUATION OF INTERNALLY DISPLACED PE...
NATIONAL MONITORING SYSTEM REPORT ON THE SITUATION OF INTERNALLY DISPLACED PE...NATIONAL MONITORING SYSTEM REPORT ON THE SITUATION OF INTERNALLY DISPLACED PE...
NATIONAL MONITORING SYSTEM REPORT ON THE SITUATION OF INTERNALLY DISPLACED PE...
 

Mais de Rob WFlag

Chilli Rememberence
Chilli RememberenceChilli Rememberence
Chilli RememberenceRob WFlag
 
Ext Agreement
Ext AgreementExt Agreement
Ext AgreementRob WFlag
 
Official Complaint Form Final Puc
Official Complaint Form Final PucOfficial Complaint Form Final Puc
Official Complaint Form Final PucRob WFlag
 
Complaint Checklist Puc
Complaint Checklist PucComplaint Checklist Puc
Complaint Checklist PucRob WFlag
 
Complaint, Etc For Email To Complainant
Complaint, Etc For Email To ComplainantComplaint, Etc For Email To Complainant
Complaint, Etc For Email To ComplainantRob WFlag
 
Res leasep1updated
Res leasep1updatedRes leasep1updated
Res leasep1updatedRob WFlag
 
Nar diversity toolkit
Nar diversity toolkitNar diversity toolkit
Nar diversity toolkitRob WFlag
 
Nar14 09-poster finallr
Nar14 09-poster finallrNar14 09-poster finallr
Nar14 09-poster finallrRob WFlag
 
Victoria House Blessed
Victoria House BlessedVictoria House Blessed
Victoria House BlessedRob WFlag
 
Victoria House Rules
Victoria House RulesVictoria House Rules
Victoria House RulesRob WFlag
 
Victoria House Blessed
Victoria House BlessedVictoria House Blessed
Victoria House BlessedRob WFlag
 

Mais de Rob WFlag (11)

Chilli Rememberence
Chilli RememberenceChilli Rememberence
Chilli Rememberence
 
Ext Agreement
Ext AgreementExt Agreement
Ext Agreement
 
Official Complaint Form Final Puc
Official Complaint Form Final PucOfficial Complaint Form Final Puc
Official Complaint Form Final Puc
 
Complaint Checklist Puc
Complaint Checklist PucComplaint Checklist Puc
Complaint Checklist Puc
 
Complaint, Etc For Email To Complainant
Complaint, Etc For Email To ComplainantComplaint, Etc For Email To Complainant
Complaint, Etc For Email To Complainant
 
Res leasep1updated
Res leasep1updatedRes leasep1updated
Res leasep1updated
 
Nar diversity toolkit
Nar diversity toolkitNar diversity toolkit
Nar diversity toolkit
 
Nar14 09-poster finallr
Nar14 09-poster finallrNar14 09-poster finallr
Nar14 09-poster finallr
 
Victoria House Blessed
Victoria House BlessedVictoria House Blessed
Victoria House Blessed
 
Victoria House Rules
Victoria House RulesVictoria House Rules
Victoria House Rules
 
Victoria House Blessed
Victoria House BlessedVictoria House Blessed
Victoria House Blessed
 

USHMCR 4Q, 2010 summary

  • 1. 4th Quarter 2010 February 2011 Summary Housing Production Housing data for the fourth quarter of 2010 indicated that the recovery in the housing market continues to Housing production indicators were mixed in the fourth remain fragile. In the production sector, single-family quarter of 2010. The number of single-family housing housing permits increased and starts remained steady, permits rose and starts remained steady, but comple- although completions fell. Multifamily housing permits, tions fell. In the multifamily sector (apartments and starts, and completions all fell, although permits and condominiums), the number of permits, starts, and completions were down only slightly. In the marketing completions all fell, although the decline in permits sector, sales of both new and existing homes rose, while and completions was small. Shipments of manufactured median sales prices for new homes remained steady and housing dropped in the fourth quarter. those for existing homes fell slightly from year-earlier ■ Builders took out permits for new housing at a pace levels. The Standard and Poor’s Case-Shiller® national of 574,000 (SAAR) units during the fourth quarter, seasonally adjusted (SA) repeat-sales house-price index, which was 3 percent higher than the previous quarter which is reported with a lag, recorded a 3.4-percent but 8 percent lower than a year earlier. Single-family decline in the value of homes in the third quarter of building permits were issued for 421,000 (SAAR) 2010, after having increased 2.6 percent in the second housing units, an increase of 4 percent from the third quarter, and a 1.6-percent decline over year-earlier levels. quarter but a decrease of 14 percent from year-earlier The less volatile Federal Housing Finance Agency’s levels. Single-family permits have increased in 5 of (FHFA) purchase-only repeat-sales index, also reported the last 7 quarters, after having declined for 14 con- on a lagged basis, estimated a 1.6-percent (SA) decrease secutive quarters, ending the second quarter of 2009. in home values in the third quarter compared with the second quarter and a 3.2-percent decline from year-earlier ■ During the fourth quarter, builders started construc- levels. Inventories of available homes at the current tion on 538,000 new housing units (SAAR), down sales rate decreased in the fourth quarter of 2010, reaching 8 percent from the third quarter and 5 percent from an average rate of 8.0 months’ supply of new homes a year earlier. Single-family housing starts totaled and 9.4 months’ supply of existing homes, down from 436,000 (SAAR) housing units, virtually unchanged rates of 8.5 and 11.7 months’ supply, respectively, in the previous quarter. The national homeownership rate declined in the fourth quarter of 2010, as did the homeownership rate I n s i d e for minorities. According to the Mortgage Bankers Association (MBA), the percentage of delinquencies for Contents ................................... 2 mortgage loans fell in the third quarter, while newly initiated foreclosures increased (the data are reported 2010 Annual Data ................... 5 with a 2-month lag). The percentage of newly initiated foreclosures rose for both prime and subprime loans. The What Do We Know About advance estimate of overall real growth in the national Single-Family Rental economy for the fourth quarter was a 3.2-percent increase at a seasonally adjusted annual rate (SAAR), following Properties? ................................ 6 a 2.6-percent expansion in the third quarter, according to the Bureau of Economic Analysis. Residential invest- National Data ......................... 17 ment increased by 3.4 percent in the fourth quarter Regional Activity ................... 33 compared with a decline of 27.3 percent in the third quarter of 2010. Historical Data ....................... 68 U.S. Department of Housing and Urban Development Office of Policy Development and Research
  • 2. Contents Pacific, HUD Region IX..........................48 Northwest, HUD Region X .................... 49 Exhibit 13 Builders’ Views of Housing Market Activity: 1979–Present ........................80 Summary......................................................1 Housing Market Profiles ...........................52 Housing Production .................................. 1 Exhibit 14 Burlington-South Burlington, Vermont... 52 Marketing of Housing ............................... 3 Mortgage Interest Rates, Average Cincinnati-Middletown, Ohio- Affordability, Homeownership, and Commitment Rates, and Points: Kentucky-Indiana ................................. 53 Foreclosures ........................................... 4 1973–Present ........................................81 Dallas-Plano-Irving, Texas ...................... 54 Multifamily Housing ................................ 5 Grand Rapids, Michigan ......................... 55 Exhibit 15 Honolulu, Hawaii.................................... 56 Mortgage Interest Rates, Fees, 2010 Annual Data ........................................ 5 Louisville-Jefferson, Kentucky-Indiana.. 57 Effective Rates, and Average Term Miami-Miami Beach-Kendall, Florida.... 58 to Maturity on Conventional Loans What Do We Know About Single-Family Closed: 1982–Present ......................... 82 Rental Properties? .................................. 6 Milwaukee-Waukesha-West Allis, Introduction ............................................... 6 Wisconsin ............................................. 59 Exhibit 16 AHS Data––Property and Renter Missoula, Montana ................................. 60 FHA Market Share of 1- to 4-Family Characteristics ........................................ 6 New York City, New York ..................... 61 Mortgages: 2001–Present ..................... 83 Financing and Mortgage Performance ..... 9 Pittsburgh, Pennsylvania ........................ 62 Exhibit 17 Single-Family Mortgage Purchases by West Palm Beach-Boca Raton-Boynton FHA, VA, and PMI 1- to 4-Family Fannie Mae and Freddie Mac ............... 12 Beach, Florida ....................................... 64 Mortgage Insurance Activity: Distribution of U.S. Rental Structures .. 15 1971–Present ........................................84 Units Authorized by Building Permits, Conclusion ............................................... 16 Year to Date: HUD Regions Exhibit 18 Notes ........................................................ 16 and States................................................. 66 FHA Unassisted Multifamily Glossary ................................................... 16 Mortgage Insurance Activity: Units Authorized by Building Permits, 1980–Present ........................................85 National Data ..................................... 17 Year to Date: 50 Most Active Core Exhibit 19 Housing Production ...................................17 Based Statistical Areas (Listed by Mortgage Delinquencies and Permits..................................................... 17 Total Building Permits) ..........................67 Foreclosures Started: 1986–Present .....86 Starts ........................................................ 18 Under Construction................................18 Historical Data ..................................68 Exhibit 20 Completions............................................19 Value of New Construction Put in Exhibit 1 Place, Private Residential Buildings: Manufactured (Mobile) Home New Privately Owned Housing 1974–Present .......................................88 Shipments ............................................19 Units Authorized: 1967–Present ......... 68 Exhibit 21 Marketing of Housing ................................ 20 Exhibit 2 Gross Domestic Product and Home Sales .............................................. 20 New Privately Owned Housing Residential Fixed Investment: Home Prices ............................................21 Units Started: 1967–Present ................69 1960–Present ........................................89 Repeat Sales Price Index ......................... 22 Housing Affordability ............................. 22 Exhibit 3 Exhibit 22 Absorption of New Multifamily Units ..23 New Privately Owned Housing Units Net Change in Number of House- Manufactured (Mobile) Home Under Construction: 1970–Present .....70 holds by Age of Householder: Placements............................................ 24 Exhibit 4 1971–Present......................................... 90 Builders’ Views of Housing New Privately Owned Housing Exhibit 23 Market Activity ...................................25 Units Completed: 1970–Present ..........71 Net Change in Number of House- Exhibit 5 holds by Type of Household: Housing Finance ........................................26 1971–Present........................................91 Mortgage Interest Rates..........................26 Manufactured (Mobile) Home FHA Market Share of 1- to 4-Family Shipments, Residential Placements, Exhibit 24 Mortgages.............................................. 27 Average Prices, and Units for Sale: Net Change in Number of House- FHA 1- to 4-Family Mortgage 1977–Present ........................................72 holds by Race and Ethnicity of Insurance ..............................................28 Exhibit 6 Householder: 1971–Present ................ 92 PMI and VA Activity ..............................28 New Single-Family Home Sales: Exhibit 25 Delinquencies and Foreclosures .............29 1970–Present ........................................73 Total U.S. Housing Stock: Exhibit 7 1970–Present ...................................... 93 Housing Investment ..................................30 Residential Fixed Investment and Existing Home Sales: 1969–Present ....74 Exhibit 26 Gross Domestic Product......................30 Exhibit 8 Rental Vacancy Rates: New Single-Family Home Prices: 1979–Present...........................................94 Housing Inventory.....................................31 1964–Present ......................................... 75 Exhibit 27 Housing Stock ......................................... 31 Homeownership Rates by Age Vacancy Rates.......................................... 32 Exhibit 9 Existing Home Prices: 1969–Present ...76 of Householder: 1982–Present ............ 95 Homeownership Rates ............................ 32 Exhibit 10 Exhibit 28 Regional Activity ............................. 33 Repeat Sales House Price Index: Homeownership Rates by Region and 1991–Present...........................................77 Metropolitan Status: 1983–Present .....96 Regional Reports........................................34 New England, HUD Region I ................. 34 Exhibit 11 Exhibit 29 New York/New Jersey, HUD Region II... 36 Housing Affordability Index: Homeownership Rates by Race and Mid-Atlantic, HUD Region III ............... 37 1973–Present...........................................78 Ethnicity: 1983–Present .......................97 Southeast/Caribbean, HUD Region IV ..39 Exhibit 12 Exhibit 30 Midwest, HUD Region V .......................41 Market Absorption of New Rental Homeownership Rates by Household Southwest, HUD Region VI ................... 42 Units and Median Asking Rent: Type: 1983–Present ..............................98 Great Plains, HUD Region VII ...............44 1970–Present ........................................79 Rocky Mountain, HUD Region VIII ...... 46 For readers incorporating portions of the content from this publication in their own printed or electronic work, please provide full attribution to the U.S. Department of Housing and Urban Development's Office of Policy Development and Research. Summary 2
  • 3. from the third quarter but down 11 percent from ■ The median price of new homes sold in the fourth year-earlier levels. Single-family starts have risen quarter was $219,800, down 2 percent from the or remained steady in 4 of the last 7 quarters, after previous quarter and virtually the same over the having fallen for 12 consecutive quarters, ending previous four quarters. The average price of new the second of 2009. Builders completed 583,000 homes sold was $272,400, up 2 percent from the (SAAR) new housing units in the fourth quarter, previous quarter and nearly the same as a year ear- down 4 percent from the third quarter and 26 percent lier. A constant-quality house would have sold for over the four-quarter period. Single-family home $282,000, up 1 percent from the previous quarter completions totaled 461,000 (SAAR) units, down but down 1 percent from a year earlier. 4 percent from the previous quarter and 13 percent from a year earlier. Completions have increased in ■ NAR reported that the median price of existing 2 of the last 5 quarters, after having declined for homes sold was $169,800 in the fourth quarter, down 14 consecutive quarters, ending the fourth quarter 4 percent from the third quarter and 1 percent from of 2009. a year earlier. The average price of existing homes sold in the fourth quarter was $218,000, 3 percent ■ Manufactured housing shipments totaled 42,000 lower than the previous quarter but 1 percent higher (SAAR) units in the fourth quarter, down 15 percent than the fourth quarter of 2009. According to a NAR from the third quarter and 14 percent over the four- practitioner survey, distressed sales (foreclosures quarter period. Onsite placements of manufactured and short sales) represented 34 percent of all home housing, which are reported with a lag, reached sales in the fourth quarter, the same as in the third 49,000 units in the third quarter, down 15 percent quarter. Distressed sales prices are typically 15 to from the previous quarter but up 3 percent from 20 percent below normal market prices. a year earlier. Manufactured housing shipments have increased in 2 of the last 4 quarters, following ■ S&P/Case-Shiller® and the FHFA both produce a downward trend that began after the hurricane- repeat-sales house price indices that are reported induced sales-order increases of late 2005. with a 2-month lag. The Case-Shiller® national index estimated that (SA) home prices in the third quarter of 2010 were down 3.5 percent from the Marketing of Housing previous quarter and 1.6 percent from a year earlier. The FHFA purchase-only national index estimated Data on the housing marketing sector improved in the that (SA) home prices in the third quarter were fourth quarter of 2010. The number of both new and down 1.6 percent from the previous quarter and existing homes sold rose, while the median sales prices 3.2 percent from a year earlier. The FHFA index is of new homes was unchanged and those of existing homes based on sales financed with mortgages that have sold fell slightly from a year ago. The S&P Case-Shiller® been sold to or guaranteed by Fannie Mae and and FHFA repeat sales house price indices, which are Freddie Mac and tends to show less volatility than reported with a lag, estimated that house prices were the S&P Case-Shiller® index. The lower volatility down in the third quarter from both the second quarter occurs mainly because the FHFA index excludes of 2010 and the third quarter of 2009. The average sales transactions associated with subprime and months’ supply of homes for sale in the fourth quarter some “jumbo” loans and because it is transaction fell for both new and existing homes. Home builders’ weighted instead of value weighted. confidence, as measured by the National Association ■ During the fourth quarter of 2010, the average of Home Builders (NAHB)/Wells Fargo Housing Market inventory of new homes for sale was 195,000 units, Index, increased in the fourth quarter. down 5 percent from the third quarter and 17 percent ■ During the fourth quarter of 2010, 296,000 (SAAR) from a year earlier. That inventory would support new single-family homes were sold, up 2 percent 8.0 months of sales at the current sales pace, down from the 291,000 (SAAR) homes sold in the third 0.5 month from the third quarter but up 0.4 month quarter but down 21 percent from a year earlier. from a year earlier. The average inventory of existing homes for sale in the fourth quarter was 3.713 million ■ The NATIONAL ASSOCIATION OF REALTORS® units, down 8 percent from the third quarter but up (NAR) reported that 4.803 million (SAAR) exist- 7 percent over the four-quarter period. That inventory ing homes—including single-family, townhomes, would support 9.4 months of sales at the current condominiums, and cooperatives—were sold in sales pace, down 2.3 months from the third quarter the fourth quarter, up 15 percent from the previous but up 2.4 months from a year earlier. Of concern is quarter but down 20 percent from year-earlier lev- the “shadow inventory” of homes as a result of the els. According to a NAR practitioner survey, sales high rate of delinquencies and foreclosures, which to first-time homebuyers accounted for 32 percent has the potential to increase the supply of homes of all home sales transactions in the fourth quarter, for sale and further depress home prices. down from 34 percent in the previous quarter. 3 Summary
  • 4. The Federal Housing Administration’s (FHA) share during the third quarter of 2010. These delinquency of the mortgage market, which is reported with a rates decreased for prime, subprime, and FHA loans. 2-month lag, increased only for refinance loans in The percentage of mortgage holders seriously delinquent the third quarter of 2010. Based on loan origination on their mortgages (90 or more days past due or in the data, the FHA’s dollar volume share of the mortgage foreclosure process) fell for the third consecutive quarter; market was 16.8 percent, down from 19.0 percent in the rate had been rising since the third quarter of 2006. the second quarter and 18.2 percent a year earlier. The percentage of newly initiated foreclosures (foreclo- For home purchase loans, the FHA’s dollar volume sure starts), in contrast, increased for prime, subprime, share was 35.3 percent, down from 36.5 percent in and FHA loans. the second quarter and 26.0 percent a year earlier. For refinance loans, the FHA’s dollar volume share According to the MBA, the (SA) delinquency rate for was 10.4 percent in the third quarter, up 7.3 percent all mortgage loans in the third quarter of 2010 was 9.13 from the previous quarter but down from 12.3 percent percent, down from 9.85 percent in the second quarter a year earlier. Based on the number of loans origi- and 9.64 percent a year earlier. The (SA) delinquency nated, the FHA’s share of the mortgage market was rate for prime mortgages was 6.29 percent in the third 19.2 percent in the fourth quarter, down from 22.7 quarter, down from 7.10 percent in the second quarter percent in the previous quarter and 21.6 percent a year and 6.84 percent a year earlier. The (SA) delinquency earlier. For home purchase loans, the FHA’s share of rate for subprime mortgage loans was 26.23 percent the number of new mortgage loans was 40.9 percent, in the third quarter, down from 27.02 percent in the down from 42.4 percent in the previous quarter but second quarter and 26.42 percent a year earlier. For up from 30.3 percent a year earlier. The FHA’s share FHA loans in the MBA survey, the (SA) delinquency of the number of new refinance loans was 11.1 percent rate was 12.62 percent in the third quarter, down from in the third quarter, up from 8.4 percent in the previ- 13.29 percent in the second quarter and 14.36 percent ous quarter but down from 14.5 percent a year earlier. a year earlier. ■ Home builders’ optimism rose in the fourth quarter Newly initiated foreclosures represented 1.34 percent of all of 2010. The NAHB/Wells Fargo composite Hous- mortgage loans in the third quarter, up from 1.11 percent ing Market Index was 16, up 3 points from the third in the second quarter but down from 1.42 percent a year quarter but down 1 point from a year earlier. The earlier. The rate of newly initiated foreclosures on prime index for expected future sales increased from 19 to loans was 1.12 percent in the third quarter, up from 24 points. The composite index is based on three 0.91 percent in the second quarter but down from 1.14 components—current market activity, future sales percent a year earlier. Foreclosures started on subprime expectations, and prospective buyer traffic—and loans rose to 3.31, after having fallen for five consecu- ranges from 0 to 100. tive quarters. Newly initiated foreclosures on subprime loans were up from 2.83 percent in the second quarter but down from 3.76 percent a year earlier. Not all newly Affordability, Homeownership, initiated foreclosures end in foreclosure completions. Before the recent slowdown in the processing of fore- and Foreclosures closures, approximately 52 percent of newly initiated foreclosures were completed 6 months later, which Housing affordability, as measured by the NAR Housing was the approximate average length of time for Affordability Index, increased in the fourth quarter of processing foreclosures. 2010. The NAR composite index estimates that a family earning the median income had 185.0 percent of the The national homeownership rate was 66.5 percent in income needed to purchase a median-priced, existing the fourth quarter of 2010, down from 66.9 percent in single-family home, using standard lending guidelines. the third quarter and 67.2 percent a year earlier. The That value is up 11.9 percentage points over the previous national homeownership rate has not been this low quarter and 11.3 percentage points over the four-quarter since 1998. The homeownership rate for minority house- period. The increase in affordability is attributed to a holds decreased to 48.5 percent in the fourth quarter, 0.7-percent increase in median family income, a 4-percent down from 48.6 percent in the previous quarter and decrease in the median sales price of existing single- 49.8 percent a year earlier. The decline in homeowner- family homes, and a 16-basis-point decrease in mortgage ship reflects the subprime lending crisis, the high rates interest rates. of unemployment, and the recent severe recession. Servicer emphasis on home retention actions, including Estimates from the MBA’s quarterly National Delinquency those actions under the Making Home Affordable Survey, which is reported with a 2-month lag, showed Program, are helping to keep the number of newly that the overall, short-term, and serious delinquency initiated and completed foreclosures down, despite rates for mortgages on 1- to 4-family homes all fell high rates of mortgage delinquency. Foreclosure activity Summary 4
  • 5. has also declined recently as lenders review internal procedures related to the foreclosure process. This de- 2010 annual Data cline is likely to be temporary, however, and loan modi- Housing production indicators improved in 2010. In fication programs cannot help all delinquent borrowers. both the single-family and multifamily sectors, permits In this regard, servicers have indicated that completed and starts increased, although completions declined. foreclosures are likely to increase as alternatives for Shipments of manufactured homes increased 0.4 percent seriously delinquent borrowers are exhausted. in 2010, the first increase in annual shipments since 2005. The marketing sector performed less well, with both new and existing home sales declining during the Multifamily Housing past year. The median price of new homes sold rose during 2010, while remaining steady for existing homes Performance in the multifamily housing sector (five or sold. Housing affordability improved during 2010, more units) was mixed in the fourth quarter of 2010. In although homeownership rates for the nation and for the production sector, the number of building permits, most groups declined. The housing sector component starts, and completions all fell, although the decline of GDP (residential fixed investment) declined in 2010, in permits and completions was small. The absorption but by a much slower rate than in 2009. rate for multifamily apartments increased, while the rental vacancy rate declined. The absorption rate for ■ Builders took out permits for 447,100 new single- condominiums and cooperatives also increased in the family homes in 2010, an increase of 3 percent from fourth quarter. 2009. Multifamily permits were issued for 131,000 new units in 2010, up 11 percent from 2009. ■ During the fourth quarter of 2010, builders took out permits for 131,000 (SAAR) new multifamily units, ■ Single-family housing starts totaled 471,000 units down 3 percent from the third quarter but up 14 in 2010, up 6 percent from 2009, while multifamily percent from a year earlier. housing starts totaled 105,000 units, up 8 percent from the previous year. ■ Builders started construction on 90,000 (SAAR) new multifamily units in the fourth quarter, down ■ In 2010, construction was completed on 497,000 35 percent from 140,000 units in the third quarter new single-family housing units, 4 percent fewer but up 33 percent from 68,000 units a year earlier. than in 2009. A total of 148,000 new multifamily Builders completed 114,000 (SAAR) multifamily units were ready for occupancy in 2010, down 43 units in the fourth quarter, down 1 percent from the percent from 2009. previous quarter and 52 percent from year-earlier levels. ■ Builders sold 321,000 new single-family homes in 2010, down 14 percent from the 375,000 homes ■ Market absorption of new multifamily units in- they sold in 2009. For all of 2010, the median price creased for apartments and for condos and co-ops in of new homes sold was $221,900, up 2.4 percent the fourth quarter of 2010. Of the total number of from 2009. new apartments completed in the third quarter, 62 percent were leased in the first 3 months after com- ■ NAR reported that 4.908 million existing single- pletion, up from 56 percent in the third quarter and family homes were sold in 2010, a 5-percent decrease 10 percentage points higher than year-earlier levels. from the 5.165 million sold in 2009. For all of 2010, Of the total number of new condos and co-ops com- the median price of existing homes sold was $173,000, pleted in the third quarter of 2010, 40 percent were nearly the same as in 2009. sold in the fourth quarter, up 2 percentage points ■ Builders were just slightly more optimistic in 2010 from the third quarter but down 6 percentage points than they were in 2009. The NAHB/Wells Fargo from a year earlier. composite Housing Market Index averaged 16 points ■ The multifamily rental vacancy rate reported by in 2010, up 1 point from 2009. The 2009 value was the Census Bureau was 10.4 percent in the fourth the lowest annual value in the 25-year history of quarter of 2010, down from 11.8 percent in the third this attitude survey. quarter and 12.5 percent a year earlier. ■ The average interest rate for 30-year, fixed-rate mort- gages in 2010, as reported by Freddie Mac’s Primary Mortgage Market Survey, was 4.69 percent, 35 basis points below the 2009 annual average rate, which set a record low. 5 Summary
  • 6. According to the NAR Housing Affordability Index, the affordability of housing improved in 2010, increas- ing by 5.2 percentage points from 2009. A family What Do We KnoW earning the median level of income ($61,583) had 174.6 percent of the income needed to purchase about Single-Family the median-priced existing home ($173,200), while mortgage interest rates declined 25 basis points to rental ProPertieS? 4.89 in 2010. The increase in housing affordability is attributed to falling interest rates and a 0.8-percent increase in median family income, which more than Introduction offset a 0.6-percent increase in the median sales price. The 2009 American Housing Survey1 (AHS) identified ■ The FHA guaranteed 1.625 million mortgages in 130.1 million housing units in the United States, 77 2010, down 20 percent from 2009. Private insur- percent (99.7 million) of which were one- to four-unit ance on mortgages decreased 28 percent in 2010 to buildings,2 with the remaining 23 percent being multi- 317,037 loans. family buildings with five or more units. While most housing discussions focus on homeownership of single- ■ Based on the Housing Vacancy supplement to the family buildings and rental housing within multifamily Current Population Survey, the proportion of Ameri- buildings, 21 percent (20.6 million) of one- to four-unit can households that owned their homes in 2010 buildings provide rental housing. The 2009 AHS found declined to 66.9 percent from 67.4 percent in 2009. that 27 percent of rental housing units were in single- The homeownership rate for White non-Hispanic family-detached structures, 6 percent were located in households was 74.4 percent in 2010, down from single-family-attached structures (for example, row- 74.8 percent in 2009; the homeownership rate for houses sharing one or more common walls on individu- African-American households was 45.9 percent ally owned or leased lots), 20 percent were in two- to in 2010, down from 46.6 percent in 2009; and the four-unit structures (for example, a duplex on a single homeownership rate for Hispanic households was lot), and 48 percent were located in buildings with five 47.5 percent, down from 48.4 percent in 2009. or more units. These figures illustrate that, despite the focus on multifamily rental housing, the U.S. rental ■ The rental vacancy rate declined, while the absorp- housing stock is split nearly down the middle, 52 to 48 tion of new apartments rose in 2010. The vacancy percent, between one- to four-unit, single-family, and rate for multifamily rental units fell to 11.6 percent five or more unit, multifamily, structures . In the wake in 2010, down from 12.3 percent in 2009. The average of the buildup of single-family homes during 2004 lease rate for newly completed apartments rented through 2006, the housing bust of 2007 through 2010, within 3 months of their completion was 55 percent and the dramatic rise in foreclosures and vacancies in 2010 compared with 50 percent for all of 2009. in single-family homes, the one- to four-unit share of ■ The housing component of GDP (residential fixed rental housing is poised to increase further in 2011 investment) declined 3.0 percent in 2010 compared and 2012. Given the significant contribution of one- to with a decline of 22.9 percent in 2009. four-unit structures to the rental housing market, it is important to examine and understand the characteris- tics of single-family rental structures, their residents, their owners, their financing, and their distribution across the United States. AHS Data—Property and Renter Characteristics Table 1 shows the number of bedrooms per unit and the age (year built) of rental buildings with one unit, two to four units, and five or more units in the United States as reported in the 2009 AHS. The top half of Table 1 shows that the largest share of units in multifamily buildings (buildings with five or more units) have one- bedroom while two-bedroom units account for the largest share of units in two- to four-unit buildings, and three- bedroom units account for the largest share of units in one-unit buildings (single-family detached or attached). Summary 6
  • 7. Thus, one-unit and two- to four-unit buildings provide units were built before 1960 versus 48.1 and 49.2 percent more bedrooms and may be better able to accommodate for one-unit and two- to four-unit buildings. larger families than the average rental unit in a multi- family property. The lower half of Table 1 shows the Whereas Table 1 presents rental building character- age distribution of rental buildings. In general, one-unit istics, Tables 2 and 3 present characteristics of rental and two- to four-unit buildings tend to be older, and housing residents. Table 2 shows the age distribution buildings with five or more units tend to be younger. and race and ethnicity of renters; Table 3 shows the For example, 19.6 percent of buildings with five or more relative income and housing costs of rental housing units were built after 1990 versus 16 and 9.7 percent for residents. The top half of Table 2 shows that buildings one-unit and two- to four-unit buildings, respectively. with five or more units have a greater percent share of Similarly, 22.4 percent of buildings with five or more younger (less than 35) or older (greater than 75) residents, Table 1. Bedrooms Per Unit and Building Age of U.S. Rental Housing Stock by Structure Type Structure Type 1 unit (%) 2–4 units (%) 5+ units (%) Total (%) Bedrooms per Unit Studio 0.5 1.2 4.2 2.3 1 bedroom 6.6 26.9 44.5 27.9 2 bedrooms 31.3 54.6 43.9 41.8 3 bedrooms 45.5 15.3 6.4 21.7 4 bedrooms+ 16.1 2.0 0.9 6.4 Total 100.0 100.0 100.0 100.0 Building Age by Year Built Pre-1940 23.1 33.7 13.4 20.9 1940–1959 25.0 15.5 9.0 15.9 1960–1979 27.9 31.0 39.7 33.8 1980–1989 8.0 10.1 18.3 13.1 1990–1999 6.4 5.3 9.3 7.5 2000–2009 9.6 4.4 10.3 8.8 Total 100.0 100.0 100.0 100.0 Sources: American Housing Survey; U.S. Department of Housing and Urban Development Table 2. Age and Race/Ethnicity of U.S. Rental Housing Residents Structure Type 1 unit (%) 2–4 units (%) 5+ units (%) Total (%) Householder Age Under 25 years 10.7 14.1 17.3 14.3 25 to 29 13.5 17.1 16.6 15.6 30 to 34 14.5 12.8 13.6 13.8 35 to 44 24.9 21.4 16.4 20.5 45 to 54 18.5 14.9 14.6 16.1 55 to 64 9.9 10.6 9.2 9.7 65 to 74 4.6 5.0 4.9 4.8 75 years and over 3.5 4.2 7.4 5.3 Total 100.0 100.0 100.0 100.0 Householder Race/Ethnicity Non-Hispanic White 61.8 55.9 51.6 56.1 Non-Hispanic Black 16.8 18.5 19.6 18.4 Hispanic (of any race) 16.5 18.9 20.1 18.6 Other 5.0 6.7 8.8 7.0 Total 100.0 100.0 100.0 100.0 Sources: American Housing Survey; U.S. Department of Housing and Urban Development 7 Summary
  • 8. Table 3. Household Income and Housing Costs Relative to Area Median Income Structure Type 1 unit (%) 2–4 units (%) 5+ units (%) Total (%) Percent of Renters by Building Type in Each Income Category < 30% AMI 17.8 25.1 21.9 21.1 30–50% AMI 18.4 20.8 21.1 20.1 51–60% AMI 8.4 8.2 8.7 8.5 61–80% AMI 14.6 13.7 13.3 13.8 81–100% AMI 10.4 9.6 9.3 9.8 101–120% AMI 9.1 7.8 8.6 8.6 >120% AMI 21.4 14.8 17.0 18.1 Total 100.0 100.0 100.0 100.0 Rent Affordability (% AMI Required To Afford a Particular Housing Unit) < 30% AMI 5.5 5.9 4.8 5.3 30–50% AMI 25.4 35.5 26.4 28.0 51–60% AMI 17.9 22.1 23.1 21.1 61–80% AMI 26.8 24.0 27.2 26.4 81–100% AMI 12.9 5.7 7.7 9.1 101–120% AMI 6.5 3.4 4.3 4.8 >120% AMI 5.0 3.5 6.5 5.4 Total 100.0 100.0 100.0 100 AMI = Area Median Income. Sources: American Housing Survey; U.S. Department of Housing and Urban Development whereas, one-unit buildings, and to a lesser extent two- (AMI). The top half of Table 3 shows the percentage to four-unit rental buildings, have a greater percent share of renters by structure size that falls into each relative of residents from the middle of the age distribution (35 to income category. Note that the table contains only 54 years old). The split in residents in buildings with data on renter households (families and unrelated five units or more may be due to (1) younger households individuals), while AMI estimates are based on all seeking low-maintenance housing and communities families, including homeowners, but exclude unrelated before making the transition into homeownership and individuals. The table shows that residents with the (2) older households seeking low-maintenance housing lowest income relative to AMI (less than or equal to and communities as they make the transition out of 30 percent of AMI) are disproportionately in two- to single-family homeownership. The lower half of Table four-unit buildings and, to a lesser extent, in buildings 2 shows that a higher percent share of non-Hispanic with five or more units. Similarly, residents with the White renters reside in one-unit rental buildings and highest income relative to AMI (greater than or equal that a higher percent share of non-Hispanic Black, to 100 percent AMI) disproportionately choose to live Hispanic, and other minority renters reside in rental in one-unit rental buildings. The lower half of Table 3 buildings with two to four units and five or more units. shows the percent of AMI that a household would have The Home Mortgage Disclosure Act (HMDA) provides to earn to be able to afford a particular rental housing data on the race and ethnicity of the owners of one- to unit. Two- to four-unit buildings have the highest inci- four-unit rental properties. In 2009, one- to four-unit dence of affordability in the two most affordable categories rental mortgage originations were divided at 65.6, 2.7, (below 30 percent of AMI and 30 to 50 percent of AMI), 6.1, and 25.6 percent among the categories of non-His- which probably reflects that two- to four-unit buildings panic White, non-Hispanic Black, Hispanic, and other. have a greater share of older buildings, as shown in The high share for “other” is due, in part, to corporate Table 1. The highest share for one-unit buildings and or nonprofit purchases and refinances in addition to for buildings with five or more units is within the 60- other minorities. Race and ethnicity origination shares to 80-percent AMI category. The share of rental units remained relatively constant from 2004 through 2009, requiring income equal to 80 percent of AMI or greater with the notable exception of the non-Hispanic Black to be affordable is the highest for one-unit buildings share, which declined from 6.02 to 2.70 percent, while and buildings with five or more units, probably because the other share increased from 18.7 to 25.6 percent. of the fact that these property types have a greater share of newer buildings, and one-unit buildings have a Table 3 shows rental household income and rental greater share of units with three or more bedrooms, as housing costs relative to the Area Median Income shown in Table 1. Summary 8
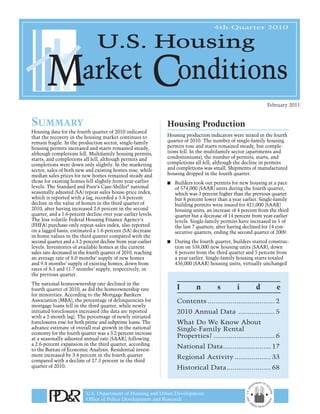
  • 9. Financing and Mortgage first section presents performance for all originations years, with the subsequent six sections containing per- Performance formance for origination years 2005 to 2010; the final section contains performance for mortgages originated Because rental properties are purchased solely for before 2005. For each property type, the table shows investment purposes and owner-occupant properties (1) active loan count, (2) share of loans in foreclosure, are purchased for both the provision of shelter and and (3) total noncurrent share of loans. economic returns, it is often hypothesized that pay- ment and default behaviors differ substantially based Table 4 shows that the trends for both primary residences on occupancy and that mortgages on one- to four-unit and rental properties have moved in tandem; that is, for rental properties underperform the mortgages of owner- the all origination year groups, the share of mortgages occupants. Figure 1 and Tables 4 and 5 use LPS Applied that are in foreclosure and noncurrent has increased Analytics Mortgage Performance Data to compare first- for both primary residences and rental properties over lien mortgage performance for rental property investors time from 2005 to 2010. The table shows that, across and owner-occupants over time.3 origination years, foreclosure and noncurrent shares of more recent vintages (for example, 2010, 2009, 2008) Figure 1 shows the share of active first-lien mortgages performed better in the first, second, and third years that were noncurrent (30 or more days delinquent or after origination than vintages at the peak of the hous- in foreclosure) as of December 31st in each year from ing market in 2006 and 2007. Looking at all origination 2005 through 2010––broken out by units in structure years, the noncurrent share for mortgages on one-unit (one unit versus two to four units) and occupancy status rental properties was less than the noncurrent share on of the property owner (primary residence, second home, one-unit primary residences on December 31st of each or rental property). From 2005 through 2010, default year from 2005 through 2010, with the exception of rates were lowest for one-unit second homes and high- December 2008. The table shows that, for individual est for two- to four-unit primary residences (meaning origination years, the rental noncurrent share is less the owner lives in one of the units), while one-unit than the share for primary residences at all points in rentals, two- to four-unit rentals, and one-unit primary time, for all origination years, with the exception of residences were bound by a range in the center, with the 2005 origination year in December 2008, at which rental properties showing slightly lower default rates point the noncurrent share for rental properties exceeded than one-unit primary residence mortgages, with the the noncurrent share for primary residences. Conversely, exception of 2008, when one-unit rental defaults slightly the rental foreclosure share exceeds the primary resi- exceeded the default rate for one-unit primary residences. dence foreclosure share in nearly every case. The fact that the noncurrent share is lower but the foreclosure Table 4 (Table 5) shows mortgage performance for one- share is higher for one-unit rental properties compared unit (two- to four-unit) primary residence and rental with one-unit primary residences may indicate a greater properties over the period from 2005 through 2010 by willingness by lenders to work with delinquent one- origination year. The left-hand side of the table contains unit, owner-occupant borrowers to avoid foreclosure performance for primary residences and the right-hand relative to nonowner-occupant borrowers. side contains performance for rental properties. The Figure 1. Percent Share Noncurrent by Occupancy and Structure Type 20% 18% 16% 14% 12% 10% 8% 6% 4% 2% 0% December December December December December December 2005 2006 2007 2008 2009 2010 Primary (1 unit) Second Property (1 unit) Rental (1 unit) Primary (2–4 units) Second Property (2–4 units) Rental (2–4 units) Sources: LPS Applied Analytics Mortgage Performance Data; U.S. Department of Housing and Urban Development 9 Summary
  • 10. Table 5 presents performance metrics for two- to four- to four-unit rental properties had superior performance unit structures comparable to those shown in Table 4 across all metrics (foreclosures and noncurrent share), for one-unit structures. While Table 4 depicts a split at all points in time, and across all vintages. Looking in mortgage performance between one-unit primary across all origination years, the average two- to four-unit residences and rentals across origination years (primary primary residence foreclosure and noncurrent shares residences had lower foreclosures, but rentals had lower are 54 and 69 percent higher, respectively, than the delinquencies), the results in Table 5 show that two- respective average foreclosure and noncurrent rental Table 4. One-Unit Primary Residence and Rental Mortgage Performance by Origination Year 1 Unit—Primary Residence 1 Unit—Rental Origination Year and Date Active Loan Foreclosure Total Non- Active Loan Foreclosure Total Non- Count (#) Presale (%) current (%) Count (#) Presale (%) current (%) All origination years 2005 18,094,560 .43 4.99 766,362 .47 3.54 2006 19,178,465 .62 5.52 872,806 .81 4.53 2007 21,814,454 1.16 7.10 999,095 1.73 6.66 2008 26,052,739 1.74 9.93 1,292,266 3.52 10.59 2009 22,611,288 3.13 13.54 1,121,994 5.31 13.47 2010 25,353,804 3.49 11.84 1,330,817 5.00 11.01 2010 originations 2010 3,353,221 .04 .92 142,449 .05 .52 2009 originations 2009 3,335,705 .07 1.65 90,002 .08 .79 2010 3,756,606 .53 3.88 118,615 .42 1.51 2008 originations 2008 2,934,941 .24 3.85 154,858 .55 2.88 2009 1,950,230 1.83 11.17 118,951 2.30 7.13 2010 1,926,049 3.92 14.59 137,740 3.57 7.91 2007 originations 2007 3,124,720 .55 5.11 189,595 .74 4.15 2008 3,546,363 2.42 13.89 216,917 4.74 13.64 2009 2,521,625 6.02 24.81 173,104 8.50 19.66 2010 2,307,898 8.52 24.39 171,846 9.44 18.78 2006 originations 2006 3,295,294 .51 5.14 210,251 .62 4.29 2007 3,437,312 2.73 12.28 207,153 3.32 10.36 2008 3,421,929 4.72 19.33 212,554 7.23 18.80 2009 2,529,104 8.76 29.57 170,865 10.94 23.93 2010 2,229,769 9.89 27.63 165,133 11.02 21.74 2005 originations 2005 3,770,140 .19 3.25 221,992 .22 2.96 2006 3,581,358 .92 6.42 201,950 1.19 4.98 2007 3,391,028 1.86 9.18 184,174 2.69 8.26 2008 3,565,558 2.70 12.52 201,117 5.14 13.88 2009 2,767,412 5.03 18.82 164,937 7.74 17.85 2010 2,556,039 5.95 18.35 169,895 7.62 16.11 Origination before 2005 2005 14,324,420 .49 5.45 544,370 .57 3.78 2006 12,301,813 .57 5.36 460,605 .74 4.44 2007 11,861,394 .66 5.53 418,173 .98 5.25 2008 12,583,948 .82 6.94 506,820 1.70 6.89 2009 9,507,212 1.66 9.40 404,135 2.63 9.31 2010 9,224,222 2.38 9.71 425,139 3.22 8.83 Sources: LPS Applied Analytics Mortgage Performance Data; U.S. Department of Housing and Urban Development Summary 10
  • 11. building shares. The largest differences occur in the for rental property investors was more conservative and most recent vintages, 2008 through 2010, in which that the pool of two- to four-family primary residence the average difference between primary residences and borrowers may have contained a larger share of margin- rental structures is 121 and 180 percent for foreclosures ally qualified or less financially capable candidates who and noncurrent shares, respectively. One possible planned to use rental income to make payments that explanation for this result could be that underwriting did not materialize or were less than anticipated. Table 5. Two- to Four-Unit Primary Residence and Rental Mortgage Performance by Origination Year 2–4 Unit—Primary Residence 2–4 Unit—Rental Origination Year and Date Active Loan Foreclosure Total Non- Active Loan Foreclosure Total Non- Count (#) Presale (%) current (%) Count (#) Presale (%) current (%) All origination years 2005 328,091 .69 5.38 197,715 .44 3.21 2006 359,005 1.24 6.58 226,562 .69 3.45 2007 404,913 2.52 9.36 253,807 1.36 5.20 2008 420,401 3.86 14.38 262,055 2.58 9.02 2009 420,364 6.19 19.89 254,600 4.99 12.30 2010 499,890 6.84 17.36 276,622 5.39 11.37 2010 originations 2010 44,292 .06 1.23 24,750 .03 .48 2009 originations 2009 44,438 .30 2.85 13,682 .14 .93 2010 54,319 1.34 5.64 15,204 .63 1.60 2008 originations 2008 45,288 .72 5.99 25,434 .26 2.36 2009 37,899 5.17 17.96 24,015 2.44 6.84 2010 42,662 8.58 20.38 24,555 4.16 8.34 2007 originations 2007 72,942 1.36 6.83 49,100 .51 3.24 2008 68,963 4.95 19.09 46,330 2.76 10.65 2009 59,847 10.03 32.61 42,027 7.12 17.46 2010 62,012 13.61 31.13 39,587 9.54 19.03 2006 originations 2006 83,886 1.12 7.08 55,708 .49 3.53 2007 85,555 6.06 17.35 53,074 2.62 8.87 2008 74,890 9.90 28.60 47,207 5.64 17.19 2009 65,997 14.79 39.63 41,878 10.36 22.62 2010 63,700 15.63 35.94 38,353 11.06 21.85 2005 originations 2005 82,402 .40 4.25 59,063 .19 2.97 2006 72,691 2.06 8.43 53,607 1.04 4.38 2007 63,548 3.38 11.63 46,211 2.12 7.17 2008 58,819 4.73 16.91 42,789 3.92 12.32 2009 53,778 7.86 24.27 39,057 7.21 16.84 2010 57,016 9.29 23.69 38,483 8.22 17.23 Origination before 2005 2005 245,689 .78 5.76 138,652 .55 3.31 2006 202,428 1.00 5.71 117,247 .63 2.98 2007 182,868 1.02 5.85 105,422 .78 3.39 2008 172,441 1.33 7.66 100,295 1.06 4.69 2009 158,405 2.47 10.62 93,941 2.08 6.55 2010 175,889 3.46 10.67 95,690 2.73 6.79 Sources: LPS Applied Analytics Mortgage Performance Data; U.S. Department of Housing and Urban Development 11 Summary
  • 12. Single-Family Mortgage tion shown in Tables 4 and 5. Despite the focus on owner-occupied, one-unit properties, investor-owned Purchases by Fannie Mae units account for 8.6 percent (250,000) of units in 2008 and 3.8 percent (135,000) in 2009 at Fannie Mae; they and Freddie Mac account for 9.0 percent (175,000) of units in 2008 and 3.3 percent (82,000) in 2009 at Freddie Mac. Two trends Throughout the recession and since house prices peaked apparent in Table 6 are the shifts in GSE mortgage pur- in the second quarter of 2007 (Federal Housing Finance chases toward owner-occupied and one-unit homes Agency House Price Index), credit availability has tight- from 2008 to 2009. ened and lending has been curtailed by nearly all mort- gage funding sources. Secondary mortgage markets for Table 7 shows the distribution of mortgage purchases private-label mortgage backed securities (MBS) saw a by Fannie Mae and Freddie Mac based on loan purpose 93-percent decline in volume in 2007 and a contraction in 2008 and 2009; that is, purchase, refinance, second in private MBS debt outstanding in 2008, 2009, and mortgage, rehabilitation, or other. The shares are very the first three quarters of 2010. Conversely, mortgage close for both GSEs within each year, although significant pools backed by the government-sponsored enterprises differences exist between owner-occupied and investor (GSEs) increased from 2007 through the third quarter properties and from 2008 to 2009. For both Fannie Mae of 2010, providing the primary source of liquidity for and Freddie Mac, a greater share of owner-occupied owner occupants, single-family rental property owners, mortgage purchases are for refinance transactions and and multifamily property owners. Tables 6 through 9 a greater share of investor-owned mortgage purchases compare one- to four-unit owner-occupied and investor are for purchase transactions. In 2008, for example, lending by Fannie Mae and Freddie Mac in 2008 and Fannie Mae’s mortgage purchase share split was 38.4 2009, the time period during which private-label MBS and 56.9 percent for purchase and refinance mortgages, issuance contracted by $647.1 billion (Federal Reserve respectively, to one-unit, owner-occupant borrowers, Board, Flow of Funds Accounts) on net. whereas the share split for one-unit, investor-owned homes was 48.5 percent for purchase mortgages and Table 6 shows the distribution of purchases by Fannie 51.5 percent for refinance mortgages. Mae and Freddie Mac by occupancy and structure type; that is, between owner-occupied and investor homes In 2009, interest rates fell to an average of 5.04 percent and between one-unit and two- to four-unit homes based from 6.03 percent in 2008 and 6.37 percent in 2007, based on unpaid principle balance, the number of mortgages, on Freddie Mac’s Primary Mortgage Market Survey; and the number of units in 2008 and 2009. For both these low rates sparked a refinancing boom for owner- Fannie Mae and Freddie Mac in both 2008 and 2009, occupants. Table 7 shows that the share of Fannie Mae’s most of their purchases are for one-unit versus two- to 2009 mortgage purchases for one-unit, owner-occupant four-unit properties and owner-occupied homes versus purchase transactions fell to 21.6 percent, down 16.8 investor homes, similar to the overall market composi- percentage points from 2008, and that the one-unit, Table 6. GSE Purchase Composition by Structure and Occupancy Fannie Mae Freddie Mac Property or Structure Type Number Number UPB Number UPB Number of Mortgages of Mortgages ($ Millions) of Units ($ Millions) of Units (Properties) (Properties) 2008 Owner-occupied 1 unit 92.8% 91.3% 88.4% 92.5% 91.3% 88.4% Owner-occupied 2–4 units 1.8% 1.4% 2.9% 1.8% 1.2% 2.6% Investor-owned 1 unit 4.4% 6.3% 6.1% 4.3% 6.3% 6.1% Investor-owned 2–4 units 1.0% 1.1% 2.5% 1.3% 1.2% 3.0% Total 100.0% 100.0% 100.0% 100.0% 100.0% 100.0% 2009 Owner-occupied 1 unit 96.3% 95.7% 93.8% 97.0% 96.5% 95.0% Owner-occupied 2–4 units 1.5% 1.1% 2.5% 1.0% 0.7% 1.7% Investor-owned 1 unit 1.9% 2.7% 2.7% 1.6% 2.4% 2.4% Investor-owned 2–4 units 0.4% 0.4% 1.1% 0.4% 0.4% 1.0% Total 100.0% 100.0% 100.0% 100.0% 100.0% 100.0% GSE = government-sponsored enterprise. UPB = unpaid principal balance. Sources: Federal Housing Finance Agency; U.S. Department of Housing and Urban Development Summary 12
  • 13. Table 7. GSE Purchase Composition by Loan Purpose Fannie Mae Freddie Mac Property or Structure Type Property or Structure Type Loan Owner- Owner- Investor- Investor- Owner- Owner- Investor- Investor- Purpose Occupied Occupied Owned Owned Occupied Occupied Owned Owned 1 Unit 2–4 Units 1 Unit 2–4 Units 1 Unit 2–4 Units 1 Unit 2–4 Units (%) (%) (%) (%) (%) (%) (%) (%) 2008 Purchase 38.4 29.4 48.5 39.4 39.3 35.6 43.9 38.9 Refinance 56.9 63.9 51.5 60.5 60.7 64.4 56.1 61.1 2nd mortgage 0.0 0.0 0.0 0.0 0.0 0.0 0.0 0.0 Rehabilitation 0.0 0.1 0.0 0.1 0.0 0.0 0.0 0.0 NA 4.7 6.7 0.0 0.0 0.0 0.0 0.0 0.0 Total 100.0 100.0 100.0 100.0 100.0 100.0 100.0 100.0 2009 Purchase 21.6 23.8 47.1 44.4 21.1 24.7 46.5 39.2 Refinance 76.6 71.7 52.8 55.3 78.9 75.3 53.5 60.8 2nd mortgage 0.0 0.0 0.0 0.0 0.0 0.0 0.0 0.0 Rehabilitation 0.0 0.1 0.1 0.3 0.0 0.0 0.0 0.0 NA 1.8 4.5 0.0 0.0 0.0 0.0 0.0 0.0 Total 100.0 100.0 100.0 100.0 100.0 100.0 100 100 GSE = government-sponsored enterprise. NA = not applicable or unknown. Sources: Federal Housing Finance Agency; U.S. Department of Housing and Urban Development owner-occupant refinance share increased 19.7 percent- one-unit investor-owned, and two- to four-unit investor- age points to 76.6 percent. The lower mortgage rates owned purchases, respectively, had rents that were had less of an effect on the investor market as Fannie affordable at or below 80 percent of AMI, and, in 2009, Mae’s 2009 purchase and refinance shares for one-unit, the shares were 82.6, 64.7, and 79.6 percent, respectively. investor-owned homes were 47.1 and 52.8 percent, respectively––down 1.4 percentage points and up 1.3 Table 9 shows GSE mortgage purchases in underserved percentage points, respectively, from 2008. areas by structure and occupancy type. In 2008, one-unit, owner-occupied homes financed by Fannie Mae and In both 2008 and 2009, GSE purchases of investor pur- Freddie Mac had the lowest percent share in under- chase and refinance mortgages were approximately equal, served areas, at 31.3 and 31.1 percent, respectively, and while GSE purchases of owner-occupant mortgages two- to four-unit, owner-occupied homes had the highest shifted towards refinances as interest rates declined in percent share, 73.8 and 71.5 percent, respectively. From 2009. In the presence of the declining purchase share 2008 to 2009, the share of mortgage purchases in under- for owner-occupants, the consistency of the investor served areas decreased for all structure and occupancy purchase share likely helped stabilize housing prices, types, although the rank order (highest percent share by reducing the glut of unsold properties. to lowest percent share) remained the same across structure and occupancy types, with Fannie Mae (Freddie Tables 8 and 9 show the extent to which GSE mortgage Mac) underserved area purchases being 67.5 percent purchases supported affordable rental properties and the (64.6 percent) for two- to four-unit, owner-occupied extension of credit in underserved areas. Table 8 shows buildings; 66.3 percent (63.0 percent) for two- to four- that a significant share of Fannie Mae’s and Freddie unit, investor-owned buildings; 45.9 percent (43.3 percent) Mac’s mortgage purchases of one-unit, investor-owned for one-unit, investor-owned homes; and 24.6 percent homes and two- to four-unit structures have rents that (22.5 percent) for one-unit, owner-occupied homes. are affordable4 at or below 80 percent of AMI and that Thus, the GSEs’ single-family rental mortgage pur- the percent shares remained relatively constant in 2008 chase programs disproportionately increased lending and 2009. In 2008, for example, 87.7, 53.6, and 73.7 per- in underserved areas compared with their one-unit, cent of Freddie Mac’s two- to four-unit owner-occupied, owner-occupant mortgage purchases. 13 Summary
  • 14. Table 8. GSE Purchase Composition––Rent Affordability Fannie Mae Freddie Mac Property or Structure Type Property or Structure Type Rent Owner- Owner- Investor- Investor- Owner- Owner- Investor- Investor- Affordability* Occupied Occupied Owned Owned Occupied Occupied Owned Owned 1 Unit 2–4 Units 1 Unit 2–4 Units 1 Unit 2–4 Units 1 Unit 2–4 Units (%) (%) (%) (%) (%) (%) (%) (%) 2008 >100% of area median 0.0 7.6 15.3 7.8 0.0 6.1 14.4 9.2 81% to 100% of area median 0.0 8.6 16.3 11.5 0.0 5.0 13.2 10.5 51% to 80% of area median 0.0 17.4 36.0 46.3 0.0 28.1 31.5 40.9 ≤50% area median 0.0 7.5 18.9 27.7 0.0 59.6 22.1 32.8 0% or missing data 100.0 58.9 13.6 6.7 100.0 1.2 18.8 6.6 Total 100.0 100.0 100.0 100.0 100.0 100.0 100.0 100.0 2009 >100% of area median 0.0 5.5 17.3 8.0 0.0 9.1 14.4 7.7 81% to 100% of area median 0.0 7.3 17.0 11.8 0.0 7.3 16.1 10.6 51% to 80% of area median 0.0 16.8 37.1 46.6 0.0 34.5 39.4 44.1 ≤50% area median 0.0 8.0 17.0 27.5 0.0 48.1 25.3 35.5 0% or missing data 100.0 62.4 11.6 6.2 100.0 1.0 4.8 2.0 Total 100.0 100.0 100.0 100.0 100.0 100.0 100.0 100.0 *Rent to median tract income ratio. Sources: Federal Housing Finance Agency; U.S. Department of Housing and Urban Development Table 9. GSE Purchase Composition in Underserved Areas Fannie Mae Freddie Mac Property or Structure Type Property or Structure Type Owner- Owner- Investor- Investor- Owner- Owner- Investor- Investor- Occupied Occupied Owned Owned Occupied Occupied Owned Owned 1 Unit 2–4 Units 1 Unit 2–4 Units 1 Unit 2–4 Units 1 Unit 2–4 Units (%) (%) (%) (%) (%) (%) (%) (%) 2008 Served 68.6 26.1 48.4 31.7 68.8 28.4 47.8 31.8 Underserved 31.3 73.8 51.5 68.1 31.1 71.5 52.1 68.1 Bad GEOCODE/NA 0.1 0.1 0.1 0.2 0.1 0.1 0.1 0.1 Total 100.0 100.0 100.0 100.0 100.0 100.0 100.0 100.0 2009 Served 75.3 32.4 54.0 33.6 77.3 35.2 56.5 36.8 Underserved 24.6 67.5 45.9 66.3 22.5 64.6 43.3 63.0 Bad GEOCODE/NA 0.1 0.1 0.1 0.1 0.2 0.2 0.2 0.2 Total 100.0 100.0 100.0 100.0 100.0 100.0 100.0 100.0 NA = not available. Sources: Federal Housing Finance Agency; U.S. Department of Housing and Urban Development Summary 14
  • 15. Distribution of U.S. Rental Table 11 shows the distribution of one-unit rental properties relative to one-unit primary residences in Structures the 50 states and the District of Columbia, based on the Lender Processing Services Mortgage Performance Tables 10 and 11 present data on the geographic distribu- Data at the end of 2010. Although California, Florida, tion of U.S. rental properties. The top half of Table 10 and Texas have the greatest number of one-unit rental shows that 1-unit rental properties are most heavily properties, only Florida (ranked 7th) is within the top-10 concentrated in the suburbs, while all other property list of states by relative one-unit rental share. Table 11 types (from 2- to 4-unit buildings up to properties with lists states ordered by the ratio of the “percent of one- 50 or more units) are most heavily concentrated in unit rental properties” to the “percent of one-unit primary central cities. The lower half of Table 10 shows that, residences” for each state. This ratio gives an indica- on a regional basis, 1-unit properties are most heavily tion of which states have a disproportionate share of concentrated in the South and West. Properties with one-unit rental properties (ratio is greater than 1) and 2 to 4 units are more evenly distributed, with slightly which states may have a shortage of one-unit rental higher concentrations in the Northeast and South. properties or an environment that does not lend itself Similar to 1-unit properties, properties of 5 to 49 units to one-unit rentals (ratio is less than 1), relative to are most heavily concentrated in the South and West, primary residences. The five highest one-unit rental while concentrations of properties with 50 or more to primary residence ratios are in Hawaii, Nevada, the units align more closely with 2- to 4-unit property District of Columbia, Arizona, and Idaho. The five concentrations in the Northeast and South. lowest ratios are in Connecticut, North Dakota, Iowa, New York, and Massachusetts. Table 10. Regional and Urban Distribution of U.S. Rental Structures Structure Type Single Family 2–4 Units 5–19 Units 20–49 Units 50+ Units Total City/Suburban Status Central city 33.7% 48.7% 47.0% 54.8% 67.2% 45.2% Suburb 43.3% 35.3% 44.3% 37.5% 29.8% 40.2% Nonmetro 23.0% 16.0% 8.8% 7.7% 3.0% 14.6% Total units (#) 10,896,007 6,679,178 8,514,613 3,007,953 2,740,682 31,838,432 Region Midwest 20.4% 23.6% 20.6% 18.6% 19.1% 20.8% Northeast 12.0% 28.1% 15.8% 21.4% 31.4% 19.0% South 40.8% 26.0% 38.1% 31.8% 26.2% 34.8% West 26.8% 22.4% 25.6% 28.2% 23.4% 25.4% Total units (#) 10,896,007 6,679,178 8,514,613 3,007,953 2,740,682 31,838,432 Sources: American Housing Survey; U.S. Department of Housing and Urban Development Table 11. Relative Distribution of One-Unit Rental Homes 1-Unit Rentals and Rental-to-Primary Residence Ratio State Ratio State Ratio State Ratio State Ratio State Ratio HI 1.8 CA 1.3 ME 1.0 IN 0.9 IL 0.7 NV 1.7 DE 1.3 MO 1.0 RI 0.9 NH 0.6 DC 1.6 SC 1.2 WY 1.0 KY 0.9 MN 0.6 AZ 1.6 WA 1.2 TX 0.9 AR 0.8 NE 0.6 ID 1.6 VA 1.1 AL 0.9 LA 0.8 SD 0.6 OR 1.5 GA 1.1 MS 0.9 MI 0.8 NJ 0.6 FL 1.4 MT 1.1 KS 0.9 PA 0.7 MA 0.6 CO 1.4 UT 1.1 OH 0.9 WV 0.7 NY 0.6 NM 1.4 OK 1.1 TN 0.9 WI 0.7 IA 0.5 NC 1.3 VA 1.0 MD 0.9 AK 0.7 ND 0.5 CT 0.5 Sources: LPS Applied Analytics Mortgage Performance Data; U.S. Department of Housing and Urban Development 15 Summary
  • 16. Conclusion Although it is common to think of rental “properties” as 2 meaning one or more buildings under common manage- ment and financing, most federal government surveys Although housing discussions traditionally focus on actually collect information on individual buildings, homeownership in single-family properties and rental not properties; exceptions are the Property Owners and housing within multifamily properties, 21 percent of Managers Survey of 1996 and the Residential Finance single-family, one- to four-unit buildings are used as Surveys of 2001 and earlier. HUD and the Census Bureau rental properties, and 2009 AHS data show that U.S. are currently developing a Rental Housing Finance Survey rental housing is split nearly down the middle, 52 to that will also attempt to survey properties rather than 48 percent, between one- to four-unit, single-family individual buildings. On the other hand, private-sector dwellings and multifamily buildings with five or more financing data is more likely to be for properties than for units. The characteristics of rental units vary signifi- individual buildings. cantly in terms of size (number of bedrooms), structure type, age, and geography. At the same time, the residents 3 This comparison may exclude financing for some one- to of different kinds of rental housing vary significantly in four-unit structures that are part of properties with five or age, race and ethnicity, and income. Analysis of mortgage more units. data for owner-occupied and rental properties indicates that, with sound underwriting, mortgages on rental 4 In Table 8, affordability is defined as the share of rental properties perform at least as well as owner-occupant units that have rents less than or equal to a given share of mortgages such that reluctance to extend credit to AMI. For example, in 2009, 17.0 percent of Fannie Mae’s rental property investors because of the perception of one-unit, investor property mortgage purchases had rents elevated risk may be unwarranted. Revisiting lending equal to less than 50 percent of AMI. to rental property investors could assist housing markets in working through the glut of vacant single-family properties and help victims of the foreclosure crisis by Glossary providing additional rental housing opportunities. active loan. Mortgage actively being serviced by a mortgage servicer. Notes in foreclosure. Mortgage that has been referred to an 1 The American Housing Survey is conducted by the Cen- attorney to begin foreclosure proceedings, but for which sus Bureau for the U.S. Department of Housing and Urban the foreclosure sale or auction has not yet happened. Development (HUD). noncurrent. Mortgage that is either 30 or more days delinquent or is in foreclosure. Summary 16