
Recomendados
Recomendados
Mais conteúdo relacionado
Mais procurados
Mais procurados (11)
Destaque
Semelhante a Mottin-jouvet-1997-neuroscience
Semelhante a Mottin-jouvet-1997-neuroscience (20)
Último
Último (20)
Mottin-jouvet-1997-neuroscience
- 1. Neuroscience Vol. 79, No. 3, pp. 683–693, 1997 Copyright 1997 IBRO. Published by Elsevier Science Ltd Printed in Great Britain. All rights reserved Pergamon PII: S0306-4522(96)00709-9 0306–4522/97 $17.00+0.00 DETERMINATION OF NADH IN THE RAT BRAIN DURING SLEEP-WAKE STATES WITH AN OPTIC FIBRE SENSOR AND TIME-RESOLVED FLUORESCENCE PROCEDURES S. MOTTIN,* P. LAPORTE,* M. JOUVET† and R. CESPUGLIO†‡ *T. S. I. Laboratory, CNRS-URA842, Jean Monnet University, F-42023, St-Etienne, Cedex 02, France †Department of Experimental Medicine, INSERM-U52 CNRS-ERS5645, F-69373 Lyon, Cedex 08, France Abstract––The present paper reports a nanosecond time-resolved fluorescence derived from the cortex and the area of the periaqueductal gray including the nucleus raphe dorsalis (PAG-nRD) in unanaesthetized freely moving rats. The measurements were acquired through a single optic fibre transmitting a subnanosecond nitrogen laser pulse (337 nm, 15 Hz) and collecting the brain fluorescence occurring at 460 nm which might depend on mitochondrial NADH (reduced form of nicotinamide adenine dinucle- otide). The fluorometric method was combined with polygraphic recordings, and this procedure allowed us to define, for the first time, variations of the 460 nm signal occurring throughout the sleep-wake cycle. In the PAG-nRD, the signal exhibited moderate heterogeneous variation in amplitude during slow-wave as compared to the waking state. Constant increases were observed during paradoxical sleep as compared to the waking state. For this state of sleep the magnitude of the variations depended on the optic fibre location. In the cortex and during either slow-wave sleep or paradoxical sleep, the signal presented moderate increases which were significant during paradoxical sleep. The magnitude of the redox variations observed either in the PAG-nRD or in the cortex might be ascribed to the oxidative energy balance which is related to sleep states. 1997 IBRO. Published by Elsevier Science Ltd. Key words: optic sensor, laser, NADH, brain, sleep, rat. The use of biochemical sensors or of permeation sensor (FOCS), easily implantable in the brain of methods allowing measurement of brain-specific animals under chronic conditions and allowing fast compounds is actually a well established procedure. measurements of the brain chemical contents in com- These tools are suitable for behavioural studies since bination with sleep polygraphic recordings. Since this they are mini-invasive and sufficiently sensitive to approach is applicable to several fields, for clarity’s detect, for example, extracellular changes occurring sake we shall review the issues associated with each in neurochemicals across sleep-wake alternations.9,74 field. Biochemical sensors, through an electrochemical detection, allow quasi-continuous measurements Technical aspect without causing significant disturbances to the brain. Nevertheless, they are only suitable for a limited The first detailed spectrofluorometric study per- number of compounds, generally the amines and formed in the brain used the ‘‘surface microfluorom- their metabolites74, nitric oxide11,47 and glucose.72 etry’’ technique for detection of brain NADH Permeation methods allow measurement of a greater fluorescence.12 Since then, the authors have also used variety of substances, but are limited by their a Y-shaped optic fibre ( =200 µm) to monitor the anatomical resolution and the time-lag necessary NADH fluorescence in the surface of the rat brain.50 to collect the fractions between successive These approaches have allowed the emergence of measurements.4 multiple technical improvements, i.e. laser-induced To overcome these difficulties, we introduced an fluorescence system, micro-optical fibre, fluorescence alternative technique using a fibre optic chemical microscopy, video imagery and time-resolved fluor- escence techniques.22,32,40,50,66,70 Lastly, and in ad- ‡To whom correspondence should be addressed. dition to the above aspects, light reflectance has also Abbreviations: AcCoA, acetyl coenzyme A; ACh, acetyl- been measured from the dorsal hippocampus to choline; CSF, cerebrospinal fluid; EEG, electroencepha- assess correlations with electroencephalographic logram; EMG, electromyogram; FOCS, fibre optic activity.61 chemical sensor; 5-HT, serotonin; nRD, nucleus raphe dorsalis; PAG, periaqueductal gray; PDH, pyruvate de- The autofluorescence measured by spectroscopic hydrogenase; PS, paradoxical sleep; SWS, slow-wave methods is now believed to be dependent on the sleep; W, waking state. mitochondrial NADH fraction contained within the 683
- 2. 684 S. Mottin et al. volume probed 12,22,34,50 for the following reasons: (i) energy supply and, according to the oxidative phos- NADH absorbs only in its reduced form at 340 nm phorylation processes, is first metabolized within the and fluoresces within the range of blue light at glial cells into pyruvate which is then transported 440–530 nm;12 (ii) in the gray matter78 or in the into neurons.1,67 GLUT3 (glucose transporter, iso- cortex,34 increased levels of the 450–460 nm autofluo- form 3) is believed to be the major neuronal glucose rescence are well correlated with increased tissue transporter.28 At this level, mainly through the pyru- levels of NADH and the decreased tissue contents in vate dehydrogenase complex (PDH), pyruvate is the glucose and ATP;56 (iii) results reported by imaging source for the production of acetyl coenzyme A studies in the surface of the brain also indicate that (AcCoA) and NADH: the blue fluorescence is correlated with the distribu- Pyruvate+CoASH+NAD+ PDHAcCoA+ tion of the mitochondrial NADH fluorescence;22 (iv) NADH+H++CO2 finally, injection of cyanide (cytochrome oxidase Through allosteric regulations, PDH is inhibited inhibitor) increases blue fluorescence while the injec- by the end products and activated by the substrates, tion of FCCP (carbonylcyanide-p-trifluoromethoxy i.e. oxygen, Ca2+, pyruvate...57 AcCoA is the basic phenylhydrazone), which uncouples phosphorylation fuel for the tricarboxylic acid cycle which produces and oxidative processes, decreases it.22 NADH. Together with oxygen, and through It must also be emphasized that changes occurring chemiosmotically-coupled oxidative phosphoryla- in ‘‘NADH’’ fluorescence are complicated by the fact tion, it is highly ATP productive.23 It contributes to that sampling performed with optic fibre sensors the synthesis of various chemical species like the fatty involves the entire tissue sample. Indeed, assignment acids, the ketonic compounds, acetylcholine of the compartment from which the signal arises (ACh)....29 NADH is reoxidized into NAD+ through still remains to be precisely determined, and this redox processes of the proton motive respiratory aspect has given rise to controversies.19,22,50 chain.6,53 It is thus evident that the above aspects of Another essential issue concerns the conditions of oxidative metabolism depend on, and are reflected the animals in reported experimental protocols. It is, by, the redox potential of the cells31 and that NADH indeed, suggested19 that the ‘‘prestimulatory’’ steady may reflect the status of this aspect.3 redox state is of paramount importance in determin- ing the direction of NAD/NADH redox balance Sleep and energetic aspects evoked by activation of the brain cortex. Whether the animals are habituated or not to experimental con- As yet, the brain energetic mechanisms involved in ditions may lead to decreased or increased in brain sleep have not been extensively investigated. It is contents of lactate and pyruvate.62 It is also likely nevertheless reported that during slow-wave sleep that data obtained with anaesthetized animals may (SWS), glucose49 and oxygen consumption45,49 de- not exactly reflect the genuine changes occurring in crease while glycogen content increases,37 thus con- true physiological conditions. tributing to the restoration of the energy pool.30,37 Indeed, SWS is generally assumed to be a restorative state5,38 necessary for the occurrence of PS77 which Sleep aspect needs energy to occur. In this respect, on the basis of A great variety of data obtained a few decades deoxyglucose (614C) use through autoradiographic ago35 or more recently10 still point to the leading role technique or positron emission tomography, in- played by serotonin (5-HT) in sleep. This amine is creases in glucose consumption have been reported synthesized within serotoninergic neurons whose during PS as compared to the waking state perikarya are located in the raphe system and con- (W).25,44,48,60 tribute, together with hypnogenic substances, to sleep preparation, triggering and maintenance.20,21 In ad- General purpose dition to the aspects relative to neurotransmission or neuromodulation associated with 5-HT or hypno- Our experiments were conducted with animals genic substances, the energetic mechanisms involved under strictly controlled physiological conditions. in this critical area throughout the sleep-wake cycle Despite the evidence stated above, we first reconsid- and particularly during paradoxical sleep (PS), re- ered the NADH dependence of the in vivo 460 nm main poorly documented. The brevity of the PS signal since this aspect is essential for a sound in- episodes displayed by most experimental animals terpretation of the data. Afterwards, we examined could explain this issue. the relationship existing between the oxidative brain metabolism and the vigilance states. For this pur- pose, we investigated, throughout the sleep-wake Energetic aspect cycle, variations of the 460 nm fluorescence occurring Energy is generally trapped as ATP by two pro- in the PAG-nRD, an area known to contain a large cesses, glycolysis and mitochondrial oxidative phos- proportion of serotoninergic neurons79 as well as the phorylation, whose respective efficiencies are 6% and PDH complex.52,57 Finally, we also investigated the 94%.23 In the rat, glucose is the basic substrate for frontal cortex where the axonal processes arising
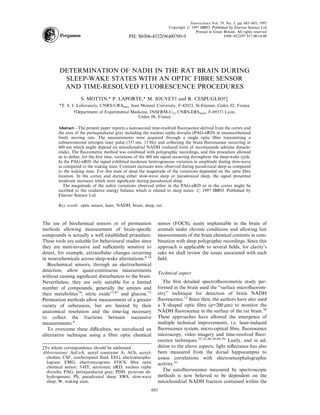
- 3. Brain NADH determination with an optic fibre sensor 685 Fig. 2. General configuration of the experimental set-up displayed for the experiments performed with unanaesthe- tized and freely moving rats. The experimental sessions were scheduled during the light period (12 h). F, filter; M, dich- roic mirror; M1 mirror; L, lens; PMT, photomultiplier; PD, photodiode. Fig. 1. Schematic diagram of the optic fibre and the polygraphic electrodes assembly. After surgery, 10 days were necessary for recovery. Constant care was devoted to emerging from the inner edge by about 2 mm. Afterwards, the animals, the cannula guide was also removed and the brain was removed, coronal sections (depth: 20 µm) replaced every day. performed with a cryostat and classical Cresyl Violet staining of brain cuts applied. from the PAG-nRD area impinge. To our knowl- Data scoring and statistics edge, the time-resolved measurement of brain fluor- Polygraphic data were scored visually as previously de- escence in deep tissue like the PAG-nRD area and its scribed20 while the fluorescent signals measured were stored variations throughout the sleep-wake cycle have in a microcomputer and analysed by means of a home-made never been reported. program. For statistics, an ANOVA followed by a multiple range test (Bonferroni–Dunnet) were used (Fig. 5). EXPERIMENTAL PROCEDURES Time-resolved fluorescence measurements The experimental set-up used (Fig. 2) has been described In vivo experimental procedure elsewhere.54 Here, we recall briefly that the laser source used OFA male rats (IFFA CREDO, n=5) weighing 260–300 g was a nitrogen laser delivering pulses of 300 ps (FWHM). were anaesthetized with chloral hydrate (400 mg/kg, i.p.). The R3810 photomultiplier type (Hamamatsu) was selected Two guide cannulas were then implanted in the PAG-nRD in gain in order to detect single events. The 50 output of and the cortex58 (Fig. 1). The insertion was performed the photomultiplier was coupled to a transient digitizer according to two different angulations (cortex: 45 /frontal (Tektronix Model 7912 AD mainframe, Model 7A19 ampli- plane; nRD: 30 /sagittal plane). The animals were also fier unit, Model 7B90P time base unit). The fluorescence equipped with electrodes necessary for polygraphic record- signal was averaged during 6 s with a laser repetition rate at ings (electroencephalogram (EEG) and electromyogram 15 Hz. The fibre used was a step index multimode, model (EMG): recording of the electrical activity of the cortex and PCS 200 (Quartz et Silice, core=200 µm). The measure- of the neck muscles, respectively). Surgery, electrode produc- ments were volumetric since performed either in the extra- tion and placement were performed as already described.20 cellular space or in the intracellular compartment. After ten days of recovery (12 h:12 h light:dark, tempera- According to data already published12 and established by ture at 24 0.5 C, food and water ad libitum), the FOCS means of an excitation wavelength at 337 nm applied on was placed in the cannula from which it emerged by 2 mm brain slices, it appeared that the maximal volume probed by (inner edge). Time-resolved fluorescence measurements, to- our sensor (diameter 200 µm, excitation at 337 nm) was gether with polygraphic recordings, started immediately and about 0.063 µl. This contrasts with electrochemical methods daily sessions (about 6 h) were possible for more than one detecting current at the active surface of the sensor and month. At the end of each experimental session, the optical permeation methods using a membrane as active surface. fibre was removed from the cannula and washed with milliQ water. In vitro, a 15 µM NADH (Sigma) solution at pH 7 (phosphate buffer, Merck) was used as reference before and RESULTS after in vivo sessions. To avoid cerebrospinal fluid overflow between each experimental session, a metallic guide was Characteristics of the in vitro and in vivo signals inserted into the cannula from which it emerged by 2 mm. In vitro. A 15 µM NADH solution (pH 7, Recording sites location temperature=24 C) yielded a typical fluorescence at At the end of the different experimental sessions, the 460 nm (Fig. 3A). With the oxidized form of NADH animals were killed with a lethal dose of barbiturates (NAD+) no fluorescent emission was obtained. (Nembutal), recordings being continued during this step. After death, the position of the working sensor was checked in every animal by applying an anodic current (1 mA/2 s) In vivo. The signals derived from the cortex and through an iron electrode inserted into the cannula and also the PAG-nRD area appeared in the spectral range
- 4. 686 S. Mottin et al. Fig. 4. Upper part; typical PAG-nRD measurements (fluor- escence at 460 nm) obtained throughout the sleep-wake cycle. Data obtained are expressed with reference to the waking state (100%). For each measurement the fluor- escence pulses are integrated during 6 s (digitizer full scale at 20 ns). Lower part; hypnogram indicating the vigilance states during which the fluorescence is measured. Note the PS-related increases in fluorescence intensity. The small dots refer to the measured values; the solid line is the best fit. line Abscissae, time in minutes; Ordinates AU, arbitrary units. For other abbreviations see also Fig. 1 and Fig. 3. Fig. 3. A) Typical fluorescence spectra derived through the conditions, i.e. about 10 days after surgery. At the optic fiber located in; the cortex (P) or the PAG-nRD area beginning, just after the first brain insertion of the ( ) during a single in vivo experimental session; a buffer FOCS, the signal obtained exhibited an intensity level solution at pH 7 (filled line on grey columns, 1 column=1 which decreases exponentially (typical factor of 1.8) experimental point); a NADH solution (O, 15 µm, pH 7). Bars represent S.E.M. obtained with five measurements. It during about 90 min. Afterwards, the signal height can be noticed that the signals derived from the cortex and increased slightly but continuously for 6–7 hours. the PAG-nRD area, appear in the spectral range peaking After three to five insertions, performed during suc- around 430–450 nm while, in vitro, the signal derived from a cessive sessions, these phenomena lessened, leading NADH solution appears at about 460 nm; the shift ob- to the occurrence of a signal that decreases just after served in vivo is due to the presence of an unknown compound peaking around 400 nm. It also appears that the the probe insertion for about 30 min and remained, fluorescence level derived from the nRD is higher than that thereafter, stable as checked on special sessions ex- derived from the cortex. Cx, cortex; NADH, nicotinamide tending up to 24 h. The magnitude of the ‘‘insertion adenine dinucleotide, reduced form). B) Comparison be- effect’’ depends on the probe location and the tween the typical fluorescence pulses obtained at 460 nm from the two areas investigated (Cx and PAG-nRD) and mechanical stimulation that is inevitably applied from a NADH solution (15 µM, pH 7) at 24 C. It can be during the brain insertion. The background noise, noticed that decay times measured in vivo are longer than in attached to the signals measured in chronic condi- vitro. Wavelength is expressed in nanometers (nm), time is tions, is mainly due to the laser impulse fluctuations. expressed in nanoseconds (ns) and intensity in arbitrary No noticeable changes occurred in the signal when units (AU). For other abbreviations see Fig. 1 and Fig. 3A. stretching or rolling-up of the optical fibre was produced by the spontaneous movements of the peaking around 430–450 nm (Fig. 3A). Their decay animal. Such a result is, at least partly, due to the times were longer than in vitro (Fig. 3). Moreover, the fibre selected which is weakly sensitive to torsions fluorescence level derived from the PAG-nRD area and rotations. Moreover, during experimental ses- was constantly higher than that obtained in the sions the animal was on permanent visual control cortex and the magnitude of the ratio PAG-nRD/ and its home cage was standing on a rotatable plate cortex was 2 (Fig. 3). Finally, in the fluorescence which was manually moved to compensate torsions. range 390–430 nm, either in the PAG-nRD or in the Such manual compensation was rather unfrequent, cortex, an additional signal was present (Fig. 3). i.e. typically once per hour. To further limit spon- According to our in vitro measurements, it might taneous movements, the fibre was also holded by a depend on different endogenous fluorophores and a rubber wire attached to the ceiling of the home cage. contribution of 5-hydroxyindole compounds is Data obtained have been expressed with reference to possible.54 the waking state (100%, Fig. 4), since the changes in the signal intensity occurring throughout the sleep- Combined polygraphic and time-resolved fluorescence wake cycle were relative from one state to another. measurements Sleep-related changes of the fluorescence in the Effect of the optic fibre brain insertion. Combined PAG-nRD. In this area, the intensity of the 460 nm measurements were performed in long-term chronic fluorescence varied according to the vigilance state
- 5. Brain NADH determination with an optic fibre sensor 687 and the location site of the probe (Fig. 5). In its from the PAG-nRD area or the cortex, throughout antero-medio-dorsal part (Fig. 5C), a slight decrease the rat sleep-wake cycle. Before discussing the signifi- was measured during SWS/W (/:versus) while during cance of the observed phenomena, it is necessary to PS/W a significant increase occurs. In its antero- carefully analyse the specificity of the measurements dorso-lateral part (Fig. 5D), increases in the signal performed towards NADH. In this respect, data height were observed either during SWS or PS/W. In from the literature, also obtained by means of its ventrolateral part (Fig. 5B), the signal decreased spectroscopic methods in the brain,12,32,50 are in significantly during SWS/W and during PS, while keeping with the results reported here. Indeed, in decreasing/W, it increases/SWS. Laterally to the vivo, an excitation at 337 nm leads to the appearance aqueduct, in a site not considered to be part of the of a fluorescent signal analogous to that observed in PAG-nRD (Fig. 5A), very mild changes occurred vitro in the spectral window 460–520 nm with a during either SWS or PS/W. In this site, the fluor- 15 µM NADH solution. The decay times measured in escence level increase was significant during PS/W both conditions appear, however, to be slightly dif- (Fig. 5A). Finally, outside of the PAG-nRD area and ferent and this discrepancy might be attached to the in a mediolateral position, the signal remained stable fact that, in vivo, NADH exists either in a free form during W, SWS and PS. or combined with enzymatic proteins. It is, indeed, reported that the quantum efficiency as well as the Sleep-related changes of the fluorescence in the mean lifetime of the protein-bound NADH is largely cortex. Contrary to what was observed in the PAG- increased as compared to that of the free nRD area, in the cortex, the fluorometric signal NADH.12,27,41,63 Moreover, the latter form also exhibited homogenous variations, i.e. mild increases presents a biexponential lifetime resulting from the during SWS or PS as compared to W. The variation complex photophysical properties of nicotinamide of the signal measured during PS was, however, and the equilibrium existing at short distance be- significantly different as compared to W. tween open/folded conformations of adenine and 1,4-dihydronicotinamide.16 Variations in the 460 nm fluorescence after a lethal However, NAD(P)H, also present in vivo, yields dose of barbiturates. 1–2 min after injection of bar- a signal at 460 nm which, at first sight, might biturates, the animal stopped breathing. Shortly after contribute to our 460 nm signal. It is, nevertheless, and precisely when the heart beats become irregular, very unlikely since: (i) NAD(P)H-NAD(P) is the signal height rose actively for 10 min and then present in much lower concentrations in the tissue remained stable for another 30 min (Fig. 6). In the than NADH-NAD+;45 (ii) the fluorescence derived cortex and the PAG-nRD, the anoxic/normoxic ratio from the cortex is well correlated with the NADH of the 460 nm fluorescence was in the 1.6–2.4 range. endogenous concentrations,34 and (iii) the localized It took about 2.6 min for the signal height increase to mitochondrial blue autofluorescence is altered by occur in the cortex and 4.3 min in the PAG-nRD (tm, specific inhibitors of the oxidative metabolism.22 fitting function: 1-exp[ t/tm]). Finally, a perfect control, allowing one to check the strict dependence of the 460 nm signal on the DISCUSSION NADH tissue content, would consist in inhibiting The present approach has been technically feasible its synthesis pharmacologically. Such a procedure, on the basis of three major technical developments: currently used by bioelectrochemists to identify the (i) delivery and collection of light signals (laser and chemical species in vivo9 is unfortunately not poss- fluorescence) through a thin single optic fibre allow- ible with NADH since the substances altering its ing fast measurements (10 s) together with a good production would immediately be lethal for the anatomical resolution ( =200 µm); (ii) implantation animals. Whatever the difficulties, data reported of a guide cannula into specific brain areas allowing here or available in the literature, support the the insertion of the optical fibre in the freely moving hypothesis that protein-bound NADH might be the animal for five to six weeks; (iii) simultaneous data compound that mainly contributes to the 460 nm processing of the optic and polygraphic signals signal measured in vivo. derived from the brain. Particular care was constantly devoted to the ani- Compartment probed mals. Only those in perfect condition were included in the protocol. Moreover, the small diameter of the In the brain there are 3 main compartments, i.e. optic fibre core used enabled us to check the changes vascular, intra- and extracellular. From the indica- occurring in the signal height in limited areas of the tions mentioned in the present report, it seems brain. likely that when the probe is inserted into the brain, the measurements assess a maximum spherical vol- ume of about 0.063 µl and that, in a first instance, Measurement specificity all three compartments might be involved. Regard- The present work reports the changes occurring in ing the vascular compartment, the limited loss in the intensity of the 460 nm emission, derived either sensitivity due to blood and observed with
- 6. 688 S. Mottin et al. PAG-nRD area W SWS PS A 100 0.26 (n=599) 100.5 0.2 (n=1029) 101.2 0.3 (n=402) B 100 0.35 (n=1020) 99.1 0.47 (n=267) 102 0.59 (n=112) C 100 0.45 (n=224) 99.1 0.47 (n=267) 102 0.59 (n=112) D 100 0.18 (n=2896) 104.6 0.21 (n=1879) 106.6 0.46 (n=469) E 100 0.3 (n=606) 100.7 0.26 (n=698) 100.3 0.68 (n=101) 101.2 0.3 (n=402) Cortex (Cx) 100 0.26 (n=600) 100.5 0.2 (n=1029) Fig. 5. Mean variations ( S.E.M.) of the in vivo 460 nm signal measured throughout the rat sleep-wake cycle in the PAG-nRD area and in the cortex (1 count=10 s; n=number of counts). For the PAG-nRD, A to E are single recording sites, in each of them measurements were performed during W, SWS and PS. It must be noticed that in the PAG-nRD area the changes occurring in the NADH signal are very heterogeneous. For the cortex (Cx), since the variations measured in each site were very homogeneous, pooled values are reported. W=100 0.26 (n=600); SWS=100.5 0.2 (n=1029); PS=101.2 0.3 (n=402). It can be underlined that in the Cx, contrary to the PAG-nRD, the changes in the NADH signal are homogeneous. Statistics: an ANOVA followed by a multiple range test (Bonferroni–Dunnet) were used. Comparisons shown in the figure (PAG-nRD and Cx) were performed according to SWS/W and PS/W; significance of the differences is as follows: *P0.05; **P0.01; ***P0.001; (NS, non-significant differences in E). Comparisons according to PS/SWS (not marked in the figure) are significant in B (*), C (**) and D (***). Aq, aqueduct; see also other figures for abbreviations. Localizations of the sensor (with reference to Paxinos and Watson atlas58) are in the frontal plane +1.00 for the PAG-nRD and +9.7 for the Cx. The vigilance state of the animal, determined by polygraphic recordings, is noted at the bottom of each histogram.
- 7. Brain NADH determination with an optic fibre sensor 689 during SWS or PS. It is also reported that cytosolic PDH might be active in ACh synthesis75 which is involved in PS executive mechanisms76 and also released during this state of sleep.39 Such processes take place during PS and are important for its occurrence. Their contribution to the redox potential is limited since for one AcCoA contributing to ACh synthesis, 200 more are used in the tricarboxylic acid cycle.75 It appears thus likely that the brain measure- ments reported here may reflect changes occurring in the redox state of the mitochondrial protein-bound Fig. 6. Variations in the PAG-nRD 460 nm fluorescence NADH. after a lethal dose of barbiturates (i.p.). Mean value of the data was established during the 30 min period preceding the injection (period referenced as 0%) and during the 15– Sleep data interpretation 30 min interval immediately following it (period referenced as 100%). The curve fit equation is y=A (1-exp(-x/ ) and Measurements carried out inside the PAG-nRD =4.31 min in this example. Each dot corresponds to the area under chronic conditions and reported here, fluorescence pulses integrated for 6 s (digitizer full scale at 10 ns). (a), breathing cessation; see also other figures for indicate that variations of the 460 nm signal, occur- abbreviations. ring throughout the sleep-wake cycle, are hetero- geneous and dependent on the probe position and the vigilance state. During SWS, according to the site unperfused/perfused brain slices12 can rule out, in investigated, the signal height either increased signifi- our physiological conditions, its significant partici- cantly or remained stable or exhibited a decreasing pation in the signal generation through reflectance tendency. During PS, the changes observed were and fluorescence. It is clear that haemoglobin more homogeneous and significant increases were (oxygenated and deoxygenated) absorbs at 337 nm constantly observed. In the cortex, the signal showed (excitation) and 460 nm (fluorescence). In this way, a constant tendency to increase during SWS and PS the fluorescence intensity is influenced by tissue as compared to W. The fluorescence levels measured blood contents. However, it can be emphasized that in this structure are, however, significant only during the vascular bed is twice less dense in the nRD than PS/W. The variations in the redox potential appear, in the cortex.18 It must be also noticed that these at first sight, difficult to interpret owing to the myriad interferences are strongly amplified when the exper- of metabolic and transport processes regulating the imental conditions do not allow self-homeostatic redox equivalent delivery to the mitochondria. Con- regulation, as in the case with anaesthetized ani- siderable heterogeneity in the literature data3,19,71 mals. The present approach overcomes the exper- renders these mechanisms even more difficult to imental artifacts attached to the animal preparation, interpret. In contrast with the in vitro preparations since it was performed in the freely moving rat and in vivo anaesthetized animals, our results were which self-regulates homeostatic aspects. obtained with animals in perfect physiological condi- Concerning intra- and extracellular compart- tions in which all the parameters influencing the ments, data obtained with cerebrospinal fluid (CSF) NAD+/NADH balance were self-regulated by the indicate that this fluid does not yield a noticeable animal itself, i.e. oxygen supply, temperature regula- 460 nm fluorescence signal and is thus devoid of tion, food given ad libitum for the availability of basic detectable amounts of extracellular NADH.55 It energetic substrates. Furthermore, brain NADH is cannot be excluded, however, that CSF from brain closely linked with ATP production in the rat, mainly cavities might differ from that contained in the from glucose and through the chain of electron tissue. Anatomical and biochemical data, never- transfers (oxidative phosphorylation) in which theless, lay stress on the fact that NADH is an oxygen is determinant.68 The balance of the redox intracellular compound present mainly within potential depends on the oxidative phosphorylation mitochondria.12,22,34,71 which favours the consumption of NADH, and the Whether the autofluorescence is an index of the PDH and the tricarboxycylic acid cycles which both free NADH and/or protein-bound NADH is another produce or regenerate NADH.3,13,23 This aspect is issue. It is well-known that NADH fluorescence is clearly illustrated by the use of a lethal dose of greatly enhanced by protein binding.27,41 A change in barbiturates which, in reducing the oxygen avail- autofluorescence measurement can be interpreted as ability, limits the chemical processes at the AcCoA a change in the redox state of NADH or a change in step and produces a considerable increase in the its molecular environment (protein binding, mem- 460 nm NADH signal. During PS, generally the brane effects...). With our subnanosecond time- NADH signal also increases in both areas investi- resolved fluorescence sensor, we did not observe gated, i.e. the PAG-nRD and cortex, and the oxygen significant differences in the subnanosecond time availability might again be the condition determinant shapes of the NADH fluorescence derived either for such an effect. Several reports, indeed, add
- 8. 690 S. Mottin et al. strength to such an hypothesis since hypoxia de- ties46,79 within the whole raphe nuclei. Throughout creases PS.2,42 The increase observed in the signal the sleep-wake cycle, it is now well established that intensity during this state of sleep thus reflects a the nRD 5-HT neurons exhibit a regular firing rate higher activity of PDH and tricarboxcylic acid cycles during W, which decreases during SWS and even directed towards an enhanced production of the more during PS.8,24,51 This pattern of discharge has oxidative energy. Indeed, by this time, glucose and been referred to as PS-off.65 Furthermore, moderate oxygen consumption increase,30 consumption of and localized cooling (10 C) of the nRD, which also glycogen decreases36 while lactate concentrations re- produces a decrease in neuronal discharge, is sleep- main unchanged.69 Thus, in our physiological condi- inducing.6,7 The iontophoretic application of 5-HT tions and particularly during PS, an increase in the within the nRD decreases the discharge rate of 5-HT NADH 460 nm signal would reflect an activation of neurons.73 During SWS and PS as compared to W, the phosphorylative pathway in which metabolic these neurons are subjected to a somatodendritic processes from glucose to ATP might be limited by release of 5-HT which, through an autoinhibitory the oxygen availability. This view is again consist- process, decreases their discharge rate.10 The pres- ently strengthened by the following three sets of data: ence of vesicles within 5-HT dendrites provides evi- whether in the rat or in the cat there exists a rise in dence that 5-HT may be released from them.15,18 brain temperature during PS, accompanied by a fall This dendritic release might be triggered by non- in cerebral blood flow at the beginning of the PS 5-HT axonal nerve endings impinging on the den- episode,17,64 it is likely that this fall might limit the drites.10 Finally, in the structures where the 5-HT oxygen availability; chloramphenicol, known to axonal nerve endings impinge (caudate, cortex, basal strongly inhibit the first site of the oxidative phos- hypothalamus), the 5-HT release occurs throughout phorylation,26 very efficiently reduces PS in the cat59 the sleep-wake cycle in an opposite manner, i.e. and in the rat;14 glucose metabolism is clearly in- maximum during W and decreased during SWS and creased during PS.44 Concerning the latter aspect it PS.10 Otherwise, the significant increase in glucose can be emphasized that, whether in the cortex or in metabolism, reported to occur during PS,44 is per- the PAG-nRD area, the magnitude of the index fectly in line with our results indicating that the related to glucose utilization during PS as compared 460 nm NADH fluorescence is increased during PS. to W44 is in good agreement with the NADH varia- It should be noticed that, paradoxically, when the tions reported in the present paper. These variations serotoninergic neurons are silent, glucose metabolism appear mild at first sight, but this is not surprising increases. The energy consumption might thus be since they reflect the genuine variations occurring in a necessary for the processes attached to the dendritic strict natural situation, i.e. alternation from W to PS. release of 5-HT which could occur through depolar- Finally, according to the above discussion emphasiz- izing processes independent of the soma.43 In this ing the importance of the oxidative energy for PS respect, it is well known that about 50% of the brain occurrence, it is not excluded that its rate of produc- ATP is consumed by brain Na+, K+-ATPase and tion and/or consumption might also influence its that dendrites require elevated Na+, K+-ATPase periodicity. activity.23,33 The data obtained during SWS in specific PAG- nRD sites or in the cortex, where the NADH signal respectively decreases or exhibits non-significant CONCLUSION changes, indicate that the consumption of oxidative energy is decreased, as currently suggested during this state of sleep.30 However, the PAG-nRD probe loca- The adaptation of our FOCS in freely moving tions in which the signal increases during SWS might, animals is now efficient for the evaluation of the laser stimulated fluorescence. This procedure, providing nevertheless, account for the existence of an oxidative rapid assessment of the metabolic changes occurring energy consumption during this state of sleep. In this within defined brain regions with a good spatial respect, a noticeable release of 5-HT has been re- resolution, is of wide interest for biochemists, behav- ported to take place within these sites during SWS.10 iourists and sleep physiologists. The evidence allow- It should also be mentioned that the PAG-nRD area ing one to suggest that the signal measured at 460 nm contains other biochemical components which could might be related to NADH has been discussed. This require energy during SWS.21 signal varies according to the sleep states and gener- ally increases during PS in the PAG-nRD area. The Metabolism of the PAG-nRD area during paradoxical changes observed may reflect a state related to the sleep oxidative energy. The majority of the 5-HT perikarya is located within the raphe nuclei (77.5%).79 The largest Acknowledgements—This work was supported by INSERM number is contained within the nRD (52% of the U52, DRET (Grant no 93-057), CNRS ERS-5645 and raphe nuclei serotoninergic cells). These perikarya URA-842. We also thank Miss C. Limoges and Dr J. also exhibit different morphological particulari- Carrew for improving the English text.
- 9. Brain NADH determination with an optic fibre sensor 691 REFERENCES 1. Bagley P. R. (1989) Anatomical mapping of glucose transporter protein and pyruvate dehydrogenase in rat brain: an immunogold study. Brain Res. 40, 214–224. 2. Baker T. L. and McGinty D. J. (1979) Sleep-waking patterns in hypoxic kittens. Devl PsychoBiol. 12, 561–575. 3. Balaban R. S. (1990) Regulation of oxidative phosphorylation in the mammalian cell. Am. J. Physiol 258, C377–C389. 4. Benveniste H. (1989) Brain microdialysis. J. Neurochem. 52, 1667–1679. 5. Berger R. J. and Phillips N. H. (1993) Sleep and energy conservation. NIPS 8, 276–281. 6. Cespuglio R., Walker E., Gomez M. E. and Musolino R. (1976) Cooling of the nucleus raphe dorsalis induces sleep in the cat. Neurosci. Lett. 3, 221–227. 7. Cespuglio R., Gomez M. E., Walker E. and Jouvet M. (1979) Effects du refroidissement et de la stimulation des noyaux du syteme du raphe sur les etats de vigilance chez le chat. Electroenceph. clin. Neurophysiol. 47, 289–308. ` ´ ´ 8. Cespuglio R., Faradji H., Gomez M. E. and Jouvet M. (1981) Single unit recording in the nuclei raphe dorsalis and magnus during the sleep-waking cycle of semi-chronic prepared cats. Neurosci. Lett. 24, 133–138. 9. Cespuglio R., Sarda N., Gharib A., Chastrette N., Houdouin F., Rampin C. and Jouvet M. (1990) Voltammetric detection of the release of 5-hydroxyindole compounds throughout the sleep-waking cycle of the rat. Expl Brain Res. 80, 121–128. 10. Cespuglio R., Houdouin F., Oulerich M., El Mansari M. and Jouvet M. (1992) Axonal and somatodendritic modalities of serotonin release: their involvement in sleep preparation, triggering and maintenance. J. Sleep Res. 1, 150–156. 11. Cespuglio R., Burlet S., Lambas-Senas, L. and Robert F. and Jouvet M. (1994) Voltammetric detection of NO throughout the sleep-wake cycle of the rat. In Monitoring Molecules in Neuroscience (eds Louilot A., Durkin T., Spampinato U., Cador M.) pp. 215-216. TXP, Gralignan. 12. Chance B., Cohen P., Jobsis F. and Schoener B. (1962) Intracellular oxidation-reduction states in vivo. Science 137, 499–508. 13. Chance B., Leigh J. S., Kent L., McCully K., Nioka S., Clark B. J., Maris J. M. and Graham T. (1986) Multiple controls of oxidative metabolism in living tissues as studied by phosphorus resonance. Proc. natn. Acad. Sci. U.S.A. 83, 9458–9462. 14. Chastrette N., Cespuglio R. and Jouvet M. (1990) POMC-derived peptides and sleep in the rat. Part 1: hypnogenic properties of ACTH derivatives. Neuropeptides 15, 61–74. 15. Chazal G. and Ralston H. J. (1987) Serotonin-containing structures in the nucleus raphe dorsalis of the cat: an ultrastructural analysis of dentrites, presynaptic dentrites, and axon terminals. J. comp. Neurol. 259, 317–329. 16. Couprie M. E., Merola F., Tauc P., Garzella D., Delboulbe A., Hara T. and Billardon M. (1994) First use of the UV ´ ´ Super ACO free-electron laser: fluorescence decays and rotational dynamics of the NADH coenzyme. Rev. sci. Instrum. 65, 1485–1495. 17. Denoyer M., Sallanon M., Buda C., Delhomme G., Dittmar A. and Jouvet M. (1991) The posterior hypothalamus is responsible for the increase of brain temperature during paradoxical sleep. Expl Brain Res. 84, 326–334. 18. Descarries L., Watkins K. C., Garcia S. and Beaudet A. (1982) The serotonin neurons in nucleus raphe dorsalis of adult rat: a light and electron microscope radioautographic study. J. comp. Neurol. 207, 239–254. 19. Dora E., Gyulai L. and Kovach A. G. B. (1984) Determinants of brain activation-induced cortical NAD/NADH response in vivo. Brain Res. 299, 61–72. 20. El Kafi B., Cespuglio R., Leger L., Marinesco S. and Jouvet M. (1994) Is the nucleus raphe dorsalis a target for the peptides possessing hypnogenic properties?. Brain Res. 637, 211–221. 21. El Kafi B., Leger L., Seguin S., Jouvet M. and Cespuglio R. (1995) Sleep permissive components within the dorsal raphe nucleus in the rat. Brain Res. 686, 150–159. 22. Eng J., Lynch R. M. and Balaban R. S. (1989) Nicotinamide adenine dinucleotide fluorescence spectroscopy and imaging of isolated cardiac myocytes. Biophys. J. 55, 621–630. 23. Erecinska M. and Silver I. A. (1989) ATP and brain function. J. cereb. Blood Flow Metab. 9, 2–19. 24. Fornal C. A. and Jacobs B. L. (1988) Physiological and behavorial correlates of serotonergic single-unit activity. In Neuronal Serotonin (eds Osborne N. N., Hamon M.) pp. 305-345. Wiley J. and Sons, Chichester, U.K. 25. Franck G., Salmon E., Poirrier R., Sadzot B. and Franco G. (1987) Etude du metabolisme glucidique cerebral regional ´ ´ ´ ´ chez l’homme, au cours de l’eveil et du sommeil, par tomographie a emission de positons. Rev. Electroenceph. ´ ` ´ Neurophysiol. Clin. 17, 71–77. 26. Freeman K. B. and Haldar D. (1968) The inhibition of mammalian NADH oxidation by chloramphenicol and its isomers and analogues. Can. J. Biochem. 46, 1003–1008. 27. Gafni A. and Brand L. (1976) Fluorescence decay studies of reduced nicotinamide adenine dinucleotide in solution and bound to liver alcohol dehydrogenase. Biochemistry 15, 3165–3171. 28. Gerhart D. Z., Leino R. L., Borson N. D., Taylor W. E., Gronlund K. M., McCall A. L. and Drewes L. R. (1995) Localization of glucose transporter GLUT3 in brain: comparison of rodent and dog using species-specific carboxyl- terminal antisera. Neuroscience 66, 237–246. 29. Gibson G. E. and Peterson C. (1983) Acetylcholine and oxidative metabolism in septum and hippocampus in vitro. J. biol. Chem. 258, 1142–1145. 30. Giuditta A. and Capano C. P. and Zucconi G. G. (1984) The neurochemical approach to the study of sleep. In Handbook of neurochemistry (eds Lajtha A.) pp. 443-476. Plenum Press, New York. 31. Hansford R. G. (1985) Relation between mitochondrial calcium transport and control of energy metabolism. Rev. Physiol. Biochem. Pharmac. 102, 1–72. 32. Harbig K., Chance B., Kovach A. G. B. and Reivich M. (1976) In vivo measurement of pyridine nucleotide fluorescence from cat brain cortex. J. appl. Physiol. 41, 480–488. 33. Hevner R. F. and Wong-Riley M. T. T. (1993) Mitochondrial and nuclear gene expression for cytochrome oxidase are disproportionately regulated by functional activity in neurons. J. Neurosci. 13, 1805–1819. 34. Jobsis F. F. (1971) Intracellular redox changes in functioning cerebral cortex. J. Neurophysiol. 34, 735–749. ¨ 35. Jouvet M. (1969) Biogenic amines and the states of sleep. Science 163, 32–41.
- 10. 692 S. Mottin et al. 36. Karadzic V. and Mrsulja B. (1969) Deprivation of paradoxical sleep and brain glycogen. J. Neurochem 16, 29–34. 37. Karnovsky M. L., Reich P., Anchors J. M. and Burrows B. L. (1983) Changes in brain glycogen during slow-wave sleep in the rat. J. Neurochem 41, 1498–1501. 38. Kilduff T. S., Krilowicz B., Milsom W. K., Trachsel L. and Wang L. C. H. (1993) Sleep and mammalian hibernation: homologous adaptations and homologous processes. Sleep 16, 372–386. 39. Kodama T., Takahashi Y. and Honda Y. (1990) Enhancement of acetylcholine release during paradoxical sleep in the dorsal tegmental field of the cat brain stem. Neurosci. Lett. 114, 277–282. 40. Krainer R. S. and Pearlstein R. D. (1979) Cerebral cortical microfluorometry at isobestic wavelengths for correction of vascular artifact. Science 205, 693–696. 41. Lakowicz J. R., Szmacinski H., Nowaczyk K. and Johnson M. L. (1992) Fluorescence lifetime imaging of free and protein-bound NADH. Proc. natn. Acad. Sci. U.S.A. 89, 1271–1275. 42. Laszy J. and Sarkadi A. (1990) Hypoxia-induced sleep disturbance in rats. Sleep 13, 205–217. 43. Llinas R. (1984) Electrophysiology of pars compacta cells in the in vitro substantia nigra: a possible mechanism for dentritic release. Brain Res. 294, 127–132. 44. Lydic R., Baghdoyan H. A., Hibbard L., Bonyak E. V., DeJoseph M. R. and Hawkins R. A. (1991) Regional brain glucose metabolism is altered during rapid eye movement sleep in the cat: a preliminary study. J. comp. Neurol. 304, 517–529. 45. MacIlwain H. and (1959) In Biochemistry and the central nervous system (ed. MacIlwain H.), pp. 140–143. J. and A. Churchill Ltd, London. 46. Maeda T., Fujimiya M., Kitahama K., Imai H. and Kimura H. (1989) Serotonin neurons and their physiological roles. Archs Histol. Cytol. 52 Suppl. 1, 113–120. 47. Malinski T. and Taha Z. (1992) Nitric oxide release from a single cell measured in situ by a porphyrinic-based microsensor. Nature 358, 676–678. 48. Maquet P., Dive D., Salmon E., Sadzot B., Franco G., Poirier R., Von Frenckell R. and Franck G. (1990) Cerebral glucose utilization during sleep-wake cycle in man determined by positron emission tomography and [18F]2-fluoro-2- deoxy--glucose method. Brain Res. 513, 136–143. 49. Marsden P. L. and Wildschiodtz G. (1994) Cerebral oxygen metabolism during the sleep-wake cycle in man. J. Sleep Res. 3 Suppl. 1, 154. 50. Mayevsky A. (1984) Brain NADH redox state monitored in vivo by fiber optic surface fluorometry. Brain Res. Rev. 7, 49–68. 51. McGinty D. J. and Harper R. M. (1976) Dorsal raphe neurons: depression of firing during sleep in cats. Brain Res. 101, 569–575. 52. Milner T. A., Aoki C., Sheu K., Blass J. P. and Pickel V. M. (1987) Light microscopic immunocytochemical localization of pyruvate dehydrogenase complex in rat brain: topological distribution and relation to cholinergic and catecholaminergic nuclei. J. Neurosci. 7, 3171–3190. 53. Mitchell P. (1976) Vectorial chemistry and the molecular mechanics of chemiosmotic coupling: power transmission by proticity. Biochem. Soc. Trans. 4, 399–430. 54. Mottin S., Tran-Minh C., Laporte P., Cespuglio R. and Jouvet M. (1993) Fiber-optic time-resolved fluorescence sensor for in vitro serotonin determination. Appl. Spectrosc. 47, 590–597. 55. Mottin S., Tran-Minh C., Laporte P., Cespuglio R. and Jouvet M. (1994) Spectrofluorimetric analytical investigation of ex vivo cerebrospinal fluids and in vivo raphe dorsalis nuclei of the brain of freely moving rats. J. Phys. IV C4, 261–264. 56. Paschen W., Niebuhr I. and Hossmann K. A. (1981) A bioluminescence method for the demonstration of regional glucose distribution in brain slices. J. Neurochem. 36, 513–517. 57. Patel M. S. (1990) Molecular biology and biochemistry of pyruvate dehydrogenase complexes. Fedn Am. Socs exp. Biol. J. 4, 3224–3233. 58. Paxinos G. and Watson C. (1986) The Rat Brain in Stereotaxic Coordinates, Academic Press, Tokyo. 59. Petitjean F., Buda C., Janin M., David M. and Jouvet M. (1979) Ellets du chloramphenicol sur le sommeil du chat, comparaison avec le thiamphenicol, l’erythromycine et l’oxytetracycline. Psychopharmacology 66, 147–153. ´ ´ ´ 60. Ramm P. and Frost B. J. (1983) Regional metabolic activity in the rat brain during sleep-wake activity. Sleep 3, 196–216. 61. Rector D. M., Poe G. R., Kristenen M. P. and Harper R. M. (1995) Imaging the dorsal hippocampus: light reflectance relationships to electroencephalographic patterns during sleep. Brain Res. 696, 151–160. 62. Reich P., Geyer S. J. and Karnovsky M. L. (1972) Metabolism of brain during sleep and wakefulness. J. Neurochem. 19, 487–497. 63. Ross J. B. A. and Subramanian S. and Brand L. (1982) Spectroscopic studies. In The Pyridine Nucleotide coenzymes (eds Everse J., Anderson B. and You K.), pp. 33–49. Academic Press, New York. 64. Roussel B., Dittmar A. and Chouvet G. (1980) Internal temperature variations during the sleep-wake cycle in the rat. Waking and Sleeping 4, 63–75. 65. Sakai K. (1988) Executive mechanisms of paradoxical sleep. Archs ital. Biol. 126, 239–257. 66. Sato B., Tanaka A., Mori S., Yanabu N., Kitai T., Tokura A., Inomoto T., Iwata S., Yamaoka Y. and Chance B. (1995) Quantitative analysis of redox gradient within the rat liver acini by fluorescence images: effects of glucagon perfusion. Biochem. Biophys. 1268, 20–26. 67. Selak I., Skaper S. D. and Varon S. (1985) Pyruvate participation in the low molecular weight trophic activity for central system neurons in glia-conditioned media. J. Neurosci. 5, 23–28. 68. Senior A. E. (1988) ATP synthesis by oxidative phosphorylation. Physiol. Rev. 68, 177–231. 69. Shimizu H., Tabushi K., Hishikawa Y., Kakimoto Y. and Kaneko Z. (1966) Concentration of lactic acid in rat brain during natural sleep. Nature 212, 936–937. 70. Sholtz T. D., Laughlin M. R., Balaban R. S., Kupriyanov V. V. and Heineman F. W. (1995) Effect of substrate on mitochondrial NADH, cytosolic redox state, and phosphorylated compounds in isolated hearts. Am. J. Physiol. 268, H82–H91. 71. Siesjo B. K. (1978) In Brain Energy Metabolism pp. 187-270. John Wiley and Sons, London.
- 11. Brain NADH determination with an optic fibre sensor 693 72. Silver I. A. and Erecinska M. (1994) Extracellular glucose concentration in mammalian brain: continuous monitoring of changes during increased neuronal activity and upon limitation in oxygen supply in normo-hypo- and hyper- glycemic animals. J. Neurosci. 14, 5068–5076. 73. Sprouse J. S. and Aghajanian G. K. (1987) Electrophysiological responses of serotoninergic dorsal raphe neurons to 5-HT1A and 5-HT1B agonists. Synapse 1, 3–9. 74. Suaud-Chagny M. R., Cespuglio R. C., Rivot J. P., Buda M. and Gonon F. (1993) High sensitivity measurement of brain catechols and indoles in vivo using electrochemically treated carbon-fiber electrodes. J. Neurosci. Meth. 48, 241–250. 75. Tucek S. (1984) Problems in the organization and control of acetylcholine synthesis in brain neurons. Prog. Biophys. molec. Biol. 44, 1–46. 76. Vanni-Mercier G., Sakai K., Lin J. S. and Jouvet M. (1989) Mapping of cholinoceptive brainstem structures responsible for the generation of paradoxical sleep in the cat. Archs ital. Biol. 127, 133–164. 77. Weiss T. and Roldan E. (1964) Comparative study of sleep cycles in rodents. Experientia 20, 280–281. 78. Welsh F. A. and Rieder W. (1978) Evaluation of in situ freezing of cat brain by NADH fluorescence. J. Neurochem. 31, 299–309. 79. Wiklund L., Leger L. and Persson M. (1981) Monoamine cell distribution in the cat brain stem. A fluorescence ´ histochemical study with quantification of indolaminergic and locus coeruleus cell groups. J. comp. Neurol. 203, 613–647. (Accepted 10 December 1996)