This is a team collaboration conducted by myself, Tom Eitel,Tim McGrew, Damilola Ashaolu and Trevor Colley. 1990-2010 Descriptive Statistics and Graphing Assignment of PepsiCo and Carbonated Soft Drink Industry.
Usability vs. User Experience: What's the difference?
Team Descriptive Statistics and Graphing
1. Question 1
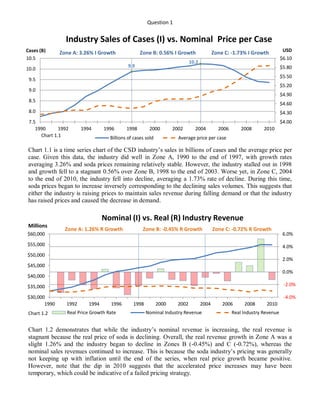
Industry Sales of Cases (I) vs. Nominal Price per Case
Cases (B) USD
Zone A: 3.26% I Growth Zone B: 0.56% I Growth Zone C: -1.73% I Growth
10.5 $6.10
10.2
9.9 $5.80
10.0
$5.50
9.5
$5.20
9.0
$4.90
8.5
$4.60
8.0 $4.30
7.5 $4.00
1990 1992 1994 1996 1998 2000 2002 2004 2006 2008 2010
Chart 1.1 Billions of cases sold Average price per case
Chart 1.1 is a time series chart of the CSD industry’s sales in billions of cases and the average price per
case. Given this data, the industry did well in Zone A, 1990 to the end of 1997, with growth rates
averaging 3.26% and soda prices remaining relatively stable. However, the industry stalled out in 1998
and growth fell to a stagnant 0.56% over Zone B, 1998 to the end of 2003. Worse yet, in Zone C, 2004
to the end of 2010, the industry fell into decline, averaging a 1.73% rate of decline. During this time,
soda prices began to increase inversely corresponding to the declining sales volumes. This suggests that
either the industry is raising prices to maintain sales revenue during falling demand or that the industry
has raised prices and caused the decrease in demand.
Nominal (I) vs. Real (R) Industry Revenue
Millions
Zone A: 1.26% R Growth Zone B: -0.45% R Growth Zone C: -0.72% R Growth
$60,000 6.0%
$55,000 4.0%
$50,000
2.0%
$45,000
0.0%
$40,000
$35,000 -2.0%
$30,000 -4.0%
1990 1992 1994 1996 1998 2000 2002 2004 2006 2008 2010
Chart 1.2 Real Price Growth Rate Nominal Industry Revenue Real Industry Revenue
Chart 1.2 demonstrates that while the industry’s nominal revenue is increasing, the real revenue is
stagnant because the real price of soda is declining. Overall, the real revenue growth in Zone A was a
slight 1.26% and the industry began to decline in Zones B (-0.45%) and C (-0.72%), whereas the
nominal sales revenues continued to increase. This is because the soda industry’s pricing was generally
not keeping up with inflation until the end of the series, when real price growth became positive.
However, note that the dip in 2010 suggests that the accelerated price increases may have been
temporary, which could be indicative of a failed pricing strategy.
2. Question 2
Cases(B)
Sales Volume of Pepsi vs. the Industry
14.0 Zone A Zone B Zone C
13.0
12.0
11.0
10.0
9.0
8.0
7.0
6.0
5.0
4.0
3.0
2.0
1.0
0.0
1990 1992 1994 1996 1998 2000 2002 2004 2006 2008 2010
Chart 2.1 PEP Industry
Compared to the carbonated soda drink (CSD) industry, Pepsi appears stable. The average number of
cases sold per year by Pepsi is 2,937.3 while the industry averaged 9,401.9, averaging a 31.2% market
share. The CSD industry and Pepsi had positive annual growth rates through Zone A, flattening out into
Zone B, and declining into Zone C. Throughout the series, Pepsi tracked with the industry fairly closely.
The overall shape of the chart suggests that the industry has passed through the first two stages of the
product life cycle, growth and maturity, and is entering decline.
Growth Rate of Pepsi vs. the Industry
Zone A Zone B Zone C
6.0%
4.0%
2.0%
0.0%
-2.0%
-4.0%
-6.0%
1990 1992 1994 1996 1998 2000 2002 2004 2006 2008 2010
Chart 2.2 PEP Industry GrRate
Period PEP Industry
Pepsi’s growth rate tended to track with the industry very closely.
Zone A: 1990-1997 2.56% 3.25%
According to Table 2.1, Pepsi under-performed relative to the industry in Zone B: 1998-2003 0.75% 0.53%
Zones A and C but over-performed in Zone B. Overall, Pepsi under- Zone C: 2004-2010 -2.90% -1.73%
performed against the industry. Plus, Pepsi’s relative performance Overall: 1990-2010 0.86% 1.09%
declined in Zone C, it can be inferred that Pepsi is not mitigating Table 2.1
downward pressures against the industry as well as its competitors.
3. Question 3
a) We believe that one of the major turning points for the soft drink industry was the emergence of
reports explicitly stating that soft drinks were directly connected to major health issues such as
childhood obesity, diabetes, and malnutrition. The 1998 report published by the Center for Science in
the Public Interest called “Liquid Candy: How Soft Drinks Are Harming Americans’ Health” was one of
the first widely recognized studies that outlined the problem. This report was only the beginning of what
would become an era of attacks on the soft drink industry leading to legislation that would completely
remove or heavily regulate soft drink availability at elementary schools in the United States. Elementary
schools house one of the main target demographics of soft drink consumers, children. To limit
government intervention, self-regulation was the industry’s response to these studies. We suggest that
this was the major turning point in the soft drink industry, leading major bottlers (Pepsi, Coke) to
diversify product lines and spend more time and resources on products that are more appealing to the
public in the light of reports suggesting that soft drinks are essentially deadly (Jacobson, 2005a). The
data supports this conclusion, as sales in 1998 sharply flattened and transitioned into stagnation until
around 2004.
b) Based on the coefficient of variation, Coke’s sales (10.6%) were more variable than Pepsi’s (8.5%).
c)
Health issues: The increasing occurrence of health issues such as obesity, diabetes, osteoporosis, tooth
decay, and other weight-related illnesses has created a greater awareness of the adverse effects of
consuming heavily sweetened carbonated drinks (Jacobson, 2005b).
Substitutes: Due to this health trend, many healthier non-carbonated substitutes are gaining market share
over soda. Further, consumers are buying more diet soft drinks, which are cannibalizing the core
products of each company (Coca Cola, 2011).
Water/Social Responsibility: The global water crisis has affected this industry in a variety of ways,
namely in terms of supply. Water is a major resource in the production of these drinks and if there is no
water, there can be no supply and subsequently no sales of these drinks (PepsiCo, 2011).
Economic Recession: The recent global recession negatively impacted sales, but it also reduced sales of
many substitute industries. Therefore, this is a less significant strategic factor, because there is little that
the companies can do about it (Bottled and Canned, 2011).
d)
i) According to the Pepsi Company 2010 annual report, Pepsi operates in over 200 countries (PepsiCo,
2010). According to Pepsi’s 2009 reporting structure, the company operated 5,018 facilities that were
either owned, leased, or jointly operated (PepsiCo, 2009).
ii) According to a joint study with The Nature Conservancy and PepsiCo on the 5 major watersheds that
PepsiCo operates in, having a positive water impact means “that [PepsiCo] will make more and better
water available to the environment and the communities where we and our suppliers operate.” For
companies where water is a major component of the product, positive water impact is very
important. According to this report, “1 in 5 of the largest business consumers of water are experiencing
significant water related impacts.” This is a huge problem for companies that rely heavily on water for
their products. Since every watershed is unique, PepsiCo has developed a variety of methods to give
back to the local watersheds while reducing the amount of water they require from the municipality they
operate in. Advanced research and development has produced effective and efficient processes to
mitigate the impact PepsiCo has on local watersheds, in some cases giving back more useable water than
consumed (PepsiCo, 2011).
4. Question 4
References
Bottled and Canned Soft Drinks and Carbonated Water. (2011). Retrieved September 4, 2011, from
Highbeam Business: http://business.highbeam.com/industry-reports/food/bottled-canned-soft-
drinks-carbonated-waters
Coca Cola Company Overview. (2011, April 28). Retrieved September 4, 2011, from Trefis:
http://www.trefis.com/company?hm=KO.trefis&hk=4d3a03f1a789acb4e107dd2b6c98a4452281f
4cd#
Michael F. Jacobson, P. (2005a, June). Liquid Candy. Retrieved September 4, 2011, from Center for
Science in the Public Interest:
http://www.cspinet.org/new/pdf/liquid_candy_final_w_new_supplement.pdf
Michael F. Jacobson, P. (2005b, July 13). Petition To Require Health Messages on Soft Drinks
Containing High-fructose Corn Syrup and other Caloric Sweeteners. Retrieved Sept 4, 2011,
from CSPInet.org: http://www.cspinet.org/new/pdf/final_soda_petition.pdf
PepsiCo. (2009). Our Business & Brands. Retrieved September 4, 2011, from PepsiCo.com:
http://www.pepsico.com/Purpose/Performance-with-Purpose/Our-Businesses-and-Brands.html
PepsiCo. (2010). PepsiCo Annual Report 2010. Retrieved September 4, 2011, from PepsiCo.com:
http://pepsico.com/Download/PepsiCo_Annual_Report_2010_Full_Annual_Report.pdf
PepsiCo, The Nature Conservancy. (2011). Striving for Positive Water Impact. Retrieved September 4,
2011, from PepsiCo.com:
http://www.pepsico.com/Download/PEP_WaterReport11_Nar_mech13.pdf