SlideShare a Scribd company logo
1 of 4
Download to read offline
Pareto Charts
Pareto (pa-RAY-toe) analysis is named after Vilfredo Pareto, an Italian economist who lived in the late 19th and
early 20th centuries. In 1897, he presented a formula that showed that income was distributed unevenly, with
about 80% of the wealth in the hands of about 20% of the people.

In a similar way, a disproportionately large percentage of errors or defects in any process are usually caused by
relatively few problems. Pareto analysis helps identify those significant few problems so people can target them
for action. It is particularly helpful in the measure and control phases of Six Sigma methodology.

What can it do for you?
There are so many aspects of work that can be improved, knowing where to begin is often difficult. Pareto
analysis will help you:

   Categorize and stratify such things as errors, defects, delays, customer complaints or any other measures of
    the resulting quality of your process so that you can identify different classes or types of problems.
   Graphically display your results so that the significant few problems emerge from the general background.

How do you do it?
1. Decide how to classify your problems. This may involve looking at the reasons cited for returned or rejected
   material, talking to your customer, or examining the rework aspects of your process.
2. Create a preliminary list of problem categories. Try to keep this list to no more than six or seven. (You may
   find yourself modifying this list as you continue your analysis.)
3. Decide on a time frame or other scope limitations on the material you will consider. The time frame or
   scope you choose should be representative of the whole process you are examining.
4. Tally the occurrences in each problem classification. (If cost or time is an issue, you may wish to tally the
   cost or time involved in each problem classification.) If a problem does not fit in any of your classifications,
   tally it as “other.”
5. Determine the total occurrences (or total cost or total time) in each classification. Add these totals to
   produce a grand total.
6. Divide each classification total by the grand total to determine the percentage that each individual problem
   classification represents of all the problems.
7. Arrange the problem classifications in order from highest value or most frequent to lowest value or least
   frequent. The “other” category should always be put last even if it is larger than some of the others.
8. Draw a horizontal axis and two vertical axes. Mark the left vertical axis in increments from zero to the grand
   total of all the problem classifications. Mark the right vertical axis in increments from zero to 100%.
9. Construct the vertical bar diagram beginning on the left with the highest percentage classification and
   progressing to the lowest and ending with “other.” The height of each bar should correspond with the value
   or number of occurrences on the left axis and the percentage of the total on the right axis. The width of the
   bars should be the same and they should be touching.
10. Label the bars under the horizontal axis.
11. Beginning at the left zero point, plot a line showing the cumulative percentage total reached with the
    addition of each problem classification. The line should end at the 100% mark on the right axis.
12. Title the chart. It is also a good idea to write a brief summary telling how and when you collected the data
    you used to produce your Pareto chart.


NOTE: The first pass at a Pareto chart may identify a significant problem that is still too big to work on. A
second Pareto analysis may be necessary to break this most significant problem into workable pieces.
Now what?
If everyone tried to make improvements individually with no definite basis for what they were doing, much
energy would produce disappointing results. A Pareto chart is a useful tool to draw the attention and
cooperation of all concerned to target the most important problems affecting quality.

   Use the Pareto chart as a basis to “divide and conquer” problems. It tells you what to work on first.
   It is normally easier to reduce a tall bar by half than to reduce a short bar to zero. Use the Pareto chart like a
    map to “island hop.” Significantly reduce one big problem, and then hop to the next. Leave the smaller
    problems for “mopping up” later.
   Of course, if you find a small problem that is easy to fix, don’t ignore it. But don’t get tangled in chasing
    small problems or trying to fix everything at once.
   After you have worked on the problems for a while, use the same techniques to collect data again and create
    a new Pareto chart.

The new chart will tell you how you are doing. Use the data on the new chart to identify and target the new most
significant problems.


                                           Pareto Chart
                         4000
                                                                                                       100


                                                                                                             Percent Distribution
      Jan 2008 Rejects


                         3000                                                                          80


                                                                                                       60
                         2000

                                                                                                       40

                         1000
                                                                                                       20


                0                                                                                      0
Jan 2008 Rejects                PS2      EY7         AD1        Others       FD1        Other
           2008                 1350     1000         500         320         300         180
         Percent                37.0     27.4        13.7         8.8         8.2         4.9
         Cum %                  37.0     64.4        78.1        86.8        95.1       100.0
Pareto charts can be used to identify problems to work on. They can help you produce greater efficiency,
conserve materials, reduce costs or increase safety. They are most meaningful, however, if your customer–the
person or organization that receives your work and helps define the problem categories.

                     Steven Bonacorsi is the President of the International Standard for Lean Six Sigma
                     (ISLSS) and Certified Lean Six Sigma Master Black Belt instructor and coach. Steven
                     Bonacorsi has trained hundreds of Master Black Belts, Black Belts, Green Belts, and
                     Project Sponsors and Executive Leaders in Lean Six Sigma DMAIC and Design for
                     Lean Six Sigma process improvement methodologies.
                                                   Author for the Process Excellence Network (PEX Network /
                                                   IQPC). FREE Lean Six Sigma and BPM content

                      International Standard for Lean Six Sigma
                      Steven Bonacorsi, President and Lean Six Sigma Master Black Belt
                      47 Seasons Lane, Londonderry, NH 03053, USA
                      Phone: + (1) 603-401-7047
                      Steven Bonacorsi e-mail
                      Steven Bonacorsi LinkedIn
                      Steven Bonacorsi Twitter
                      Lean Six Sigma Group

More Related Content

More from Kevin Egan

Qaa paul nelson
Qaa   paul nelsonQaa   paul nelson
Qaa paul nelson
Kevin Egan
 

More from Kevin Egan (11)

Gillette Six Sigma Case Study
Gillette Six Sigma Case StudyGillette Six Sigma Case Study
Gillette Six Sigma Case Study
 
Image Update Six Sigma Case Study
Image Update Six Sigma Case StudyImage Update Six Sigma Case Study
Image Update Six Sigma Case Study
 
Operating System Six Sigma Case Study
Operating System Six Sigma Case StudyOperating System Six Sigma Case Study
Operating System Six Sigma Case Study
 
Pc Shipping Improvement Six Sigma Case Study
Pc Shipping Improvement Six Sigma Case StudyPc Shipping Improvement Six Sigma Case Study
Pc Shipping Improvement Six Sigma Case Study
 
Serrver Imaging Six Sigma Case Study
Serrver Imaging Six Sigma Case StudySerrver Imaging Six Sigma Case Study
Serrver Imaging Six Sigma Case Study
 
Sms Integration Six Sigma Case Study
Sms Integration Six Sigma Case StudySms Integration Six Sigma Case Study
Sms Integration Six Sigma Case Study
 
Ticket Accuracy Six Sigma Case Study
Ticket Accuracy   Six Sigma Case StudyTicket Accuracy   Six Sigma Case Study
Ticket Accuracy Six Sigma Case Study
 
Qaa paul nelson
Qaa   paul nelsonQaa   paul nelson
Qaa paul nelson
 
Pharma iq mediakit1
Pharma iq mediakit1Pharma iq mediakit1
Pharma iq mediakit1
 
Jack Welch Speak - PEXN
Jack Welch Speak - PEXNJack Welch Speak - PEXN
Jack Welch Speak - PEXN
 
ISLSS Offerings
ISLSS OfferingsISLSS Offerings
ISLSS Offerings
 

Recently uploaded

Cloud Frontiers: A Deep Dive into Serverless Spatial Data and FME
Cloud Frontiers:  A Deep Dive into Serverless Spatial Data and FMECloud Frontiers:  A Deep Dive into Serverless Spatial Data and FME
Cloud Frontiers: A Deep Dive into Serverless Spatial Data and FME
Safe Software
 
Why Teams call analytics are critical to your entire business
Why Teams call analytics are critical to your entire businessWhy Teams call analytics are critical to your entire business
Why Teams call analytics are critical to your entire business
panagenda
 
+971581248768>> SAFE AND ORIGINAL ABORTION PILLS FOR SALE IN DUBAI AND ABUDHA...
+971581248768>> SAFE AND ORIGINAL ABORTION PILLS FOR SALE IN DUBAI AND ABUDHA...+971581248768>> SAFE AND ORIGINAL ABORTION PILLS FOR SALE IN DUBAI AND ABUDHA...
+971581248768>> SAFE AND ORIGINAL ABORTION PILLS FOR SALE IN DUBAI AND ABUDHA...
?#DUbAI#??##{{(☎️+971_581248768%)**%*]'#abortion pills for sale in dubai@
 

Recently uploaded (20)

Apidays New York 2024 - Scaling API-first by Ian Reasor and Radu Cotescu, Adobe
Apidays New York 2024 - Scaling API-first by Ian Reasor and Radu Cotescu, AdobeApidays New York 2024 - Scaling API-first by Ian Reasor and Radu Cotescu, Adobe
Apidays New York 2024 - Scaling API-first by Ian Reasor and Radu Cotescu, Adobe
 
Mastering MySQL Database Architecture: Deep Dive into MySQL Shell and MySQL R...
Mastering MySQL Database Architecture: Deep Dive into MySQL Shell and MySQL R...Mastering MySQL Database Architecture: Deep Dive into MySQL Shell and MySQL R...
Mastering MySQL Database Architecture: Deep Dive into MySQL Shell and MySQL R...
 
Cloud Frontiers: A Deep Dive into Serverless Spatial Data and FME
Cloud Frontiers:  A Deep Dive into Serverless Spatial Data and FMECloud Frontiers:  A Deep Dive into Serverless Spatial Data and FME
Cloud Frontiers: A Deep Dive into Serverless Spatial Data and FME
 
Boost PC performance: How more available memory can improve productivity
Boost PC performance: How more available memory can improve productivityBoost PC performance: How more available memory can improve productivity
Boost PC performance: How more available memory can improve productivity
 
Tata AIG General Insurance Company - Insurer Innovation Award 2024
Tata AIG General Insurance Company - Insurer Innovation Award 2024Tata AIG General Insurance Company - Insurer Innovation Award 2024
Tata AIG General Insurance Company - Insurer Innovation Award 2024
 
TrustArc Webinar - Stay Ahead of US State Data Privacy Law Developments
TrustArc Webinar - Stay Ahead of US State Data Privacy Law DevelopmentsTrustArc Webinar - Stay Ahead of US State Data Privacy Law Developments
TrustArc Webinar - Stay Ahead of US State Data Privacy Law Developments
 
presentation ICT roal in 21st century education
presentation ICT roal in 21st century educationpresentation ICT roal in 21st century education
presentation ICT roal in 21st century education
 
Why Teams call analytics are critical to your entire business
Why Teams call analytics are critical to your entire businessWhy Teams call analytics are critical to your entire business
Why Teams call analytics are critical to your entire business
 
A Domino Admins Adventures (Engage 2024)
A Domino Admins Adventures (Engage 2024)A Domino Admins Adventures (Engage 2024)
A Domino Admins Adventures (Engage 2024)
 
Powerful Google developer tools for immediate impact! (2023-24 C)
Powerful Google developer tools for immediate impact! (2023-24 C)Powerful Google developer tools for immediate impact! (2023-24 C)
Powerful Google developer tools for immediate impact! (2023-24 C)
 
GenAI Risks & Security Meetup 01052024.pdf
GenAI Risks & Security Meetup 01052024.pdfGenAI Risks & Security Meetup 01052024.pdf
GenAI Risks & Security Meetup 01052024.pdf
 
Apidays New York 2024 - The Good, the Bad and the Governed by David O'Neill, ...
Apidays New York 2024 - The Good, the Bad and the Governed by David O'Neill, ...Apidays New York 2024 - The Good, the Bad and the Governed by David O'Neill, ...
Apidays New York 2024 - The Good, the Bad and the Governed by David O'Neill, ...
 
AWS Community Day CPH - Three problems of Terraform
AWS Community Day CPH - Three problems of TerraformAWS Community Day CPH - Three problems of Terraform
AWS Community Day CPH - Three problems of Terraform
 
Automating Google Workspace (GWS) & more with Apps Script
Automating Google Workspace (GWS) & more with Apps ScriptAutomating Google Workspace (GWS) & more with Apps Script
Automating Google Workspace (GWS) & more with Apps Script
 
+971581248768>> SAFE AND ORIGINAL ABORTION PILLS FOR SALE IN DUBAI AND ABUDHA...
+971581248768>> SAFE AND ORIGINAL ABORTION PILLS FOR SALE IN DUBAI AND ABUDHA...+971581248768>> SAFE AND ORIGINAL ABORTION PILLS FOR SALE IN DUBAI AND ABUDHA...
+971581248768>> SAFE AND ORIGINAL ABORTION PILLS FOR SALE IN DUBAI AND ABUDHA...
 
Apidays Singapore 2024 - Building Digital Trust in a Digital Economy by Veron...
Apidays Singapore 2024 - Building Digital Trust in a Digital Economy by Veron...Apidays Singapore 2024 - Building Digital Trust in a Digital Economy by Veron...
Apidays Singapore 2024 - Building Digital Trust in a Digital Economy by Veron...
 
Partners Life - Insurer Innovation Award 2024
Partners Life - Insurer Innovation Award 2024Partners Life - Insurer Innovation Award 2024
Partners Life - Insurer Innovation Award 2024
 
The 7 Things I Know About Cyber Security After 25 Years | April 2024
The 7 Things I Know About Cyber Security After 25 Years | April 2024The 7 Things I Know About Cyber Security After 25 Years | April 2024
The 7 Things I Know About Cyber Security After 25 Years | April 2024
 
Connector Corner: Accelerate revenue generation using UiPath API-centric busi...
Connector Corner: Accelerate revenue generation using UiPath API-centric busi...Connector Corner: Accelerate revenue generation using UiPath API-centric busi...
Connector Corner: Accelerate revenue generation using UiPath API-centric busi...
 
From Event to Action: Accelerate Your Decision Making with Real-Time Automation
From Event to Action: Accelerate Your Decision Making with Real-Time AutomationFrom Event to Action: Accelerate Your Decision Making with Real-Time Automation
From Event to Action: Accelerate Your Decision Making with Real-Time Automation
 

Pareto charts

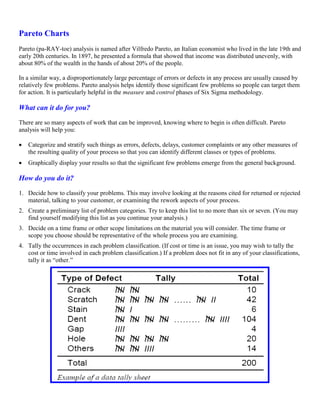
  • 1. Pareto Charts Pareto (pa-RAY-toe) analysis is named after Vilfredo Pareto, an Italian economist who lived in the late 19th and early 20th centuries. In 1897, he presented a formula that showed that income was distributed unevenly, with about 80% of the wealth in the hands of about 20% of the people. In a similar way, a disproportionately large percentage of errors or defects in any process are usually caused by relatively few problems. Pareto analysis helps identify those significant few problems so people can target them for action. It is particularly helpful in the measure and control phases of Six Sigma methodology. What can it do for you? There are so many aspects of work that can be improved, knowing where to begin is often difficult. Pareto analysis will help you:  Categorize and stratify such things as errors, defects, delays, customer complaints or any other measures of the resulting quality of your process so that you can identify different classes or types of problems.  Graphically display your results so that the significant few problems emerge from the general background. How do you do it? 1. Decide how to classify your problems. This may involve looking at the reasons cited for returned or rejected material, talking to your customer, or examining the rework aspects of your process. 2. Create a preliminary list of problem categories. Try to keep this list to no more than six or seven. (You may find yourself modifying this list as you continue your analysis.) 3. Decide on a time frame or other scope limitations on the material you will consider. The time frame or scope you choose should be representative of the whole process you are examining. 4. Tally the occurrences in each problem classification. (If cost or time is an issue, you may wish to tally the cost or time involved in each problem classification.) If a problem does not fit in any of your classifications, tally it as “other.”
  • 2. 5. Determine the total occurrences (or total cost or total time) in each classification. Add these totals to produce a grand total. 6. Divide each classification total by the grand total to determine the percentage that each individual problem classification represents of all the problems. 7. Arrange the problem classifications in order from highest value or most frequent to lowest value or least frequent. The “other” category should always be put last even if it is larger than some of the others. 8. Draw a horizontal axis and two vertical axes. Mark the left vertical axis in increments from zero to the grand total of all the problem classifications. Mark the right vertical axis in increments from zero to 100%. 9. Construct the vertical bar diagram beginning on the left with the highest percentage classification and progressing to the lowest and ending with “other.” The height of each bar should correspond with the value or number of occurrences on the left axis and the percentage of the total on the right axis. The width of the bars should be the same and they should be touching. 10. Label the bars under the horizontal axis. 11. Beginning at the left zero point, plot a line showing the cumulative percentage total reached with the addition of each problem classification. The line should end at the 100% mark on the right axis. 12. Title the chart. It is also a good idea to write a brief summary telling how and when you collected the data you used to produce your Pareto chart. NOTE: The first pass at a Pareto chart may identify a significant problem that is still too big to work on. A second Pareto analysis may be necessary to break this most significant problem into workable pieces.
  • 3. Now what? If everyone tried to make improvements individually with no definite basis for what they were doing, much energy would produce disappointing results. A Pareto chart is a useful tool to draw the attention and cooperation of all concerned to target the most important problems affecting quality.  Use the Pareto chart as a basis to “divide and conquer” problems. It tells you what to work on first.  It is normally easier to reduce a tall bar by half than to reduce a short bar to zero. Use the Pareto chart like a map to “island hop.” Significantly reduce one big problem, and then hop to the next. Leave the smaller problems for “mopping up” later.  Of course, if you find a small problem that is easy to fix, don’t ignore it. But don’t get tangled in chasing small problems or trying to fix everything at once.  After you have worked on the problems for a while, use the same techniques to collect data again and create a new Pareto chart. The new chart will tell you how you are doing. Use the data on the new chart to identify and target the new most significant problems. Pareto Chart 4000 100 Percent Distribution Jan 2008 Rejects 3000 80 60 2000 40 1000 20 0 0 Jan 2008 Rejects PS2 EY7 AD1 Others FD1 Other 2008 1350 1000 500 320 300 180 Percent 37.0 27.4 13.7 8.8 8.2 4.9 Cum % 37.0 64.4 78.1 86.8 95.1 100.0
  • 4. Pareto charts can be used to identify problems to work on. They can help you produce greater efficiency, conserve materials, reduce costs or increase safety. They are most meaningful, however, if your customer–the person or organization that receives your work and helps define the problem categories. Steven Bonacorsi is the President of the International Standard for Lean Six Sigma (ISLSS) and Certified Lean Six Sigma Master Black Belt instructor and coach. Steven Bonacorsi has trained hundreds of Master Black Belts, Black Belts, Green Belts, and Project Sponsors and Executive Leaders in Lean Six Sigma DMAIC and Design for Lean Six Sigma process improvement methodologies. Author for the Process Excellence Network (PEX Network / IQPC). FREE Lean Six Sigma and BPM content International Standard for Lean Six Sigma Steven Bonacorsi, President and Lean Six Sigma Master Black Belt 47 Seasons Lane, Londonderry, NH 03053, USA Phone: + (1) 603-401-7047 Steven Bonacorsi e-mail Steven Bonacorsi LinkedIn Steven Bonacorsi Twitter Lean Six Sigma Group