B04609014

The IOSR Journal of Pharmacy (IOSRPHR) is an open access online & offline peer reviewed international journal, which publishes innovative research papers, reviews, mini-reviews, short communications and notes dealing with Pharmaceutical Sciences( Pharmaceutical Technology, Pharmaceutics, Biopharmaceutics, Pharmacokinetics, Pharmaceutical/Medicinal Chemistry, Computational Chemistry and Molecular Drug Design, Pharmacognosy & Phytochemistry, Pharmacology, Pharmaceutical Analysis, Pharmacy Practice, Clinical and Hospital Pharmacy, Cell Biology, Genomics and Proteomics, Pharmacogenomics, Bioinformatics and Biotechnology of Pharmaceutical Interest........more details on Aim & Scope). All manuscripts are subject to rapid peer review. Those of high quality (not previously published and not under consideration for publication in another journal) will be published without delay.

Recomendados
Mais conteúdo relacionado
Mais procurados
Mais procurados (19)
Semelhante a B04609014
Semelhante a B04609014 (20)
Mais de iosrphr_editor
Mais de iosrphr_editor (20)
Último
Último (20)
B04609014
- 1. IOSR Journal Of Pharmacy (e)-ISSN: 2250-3013, (p)-ISSN: 2319-4219 www.iosrphr.org Volume 4, Issue 6 (June 2014), PP. 09-14 9 Determination of HOMA IR cut off value, and efficiency of lipids and lipoprotein ratios as discriminator of insulin resistance in type 2 Diabetes Mellitus patients Momin AA1*, Bankar MP2, Bhoite GM3 1* (Assistant Lecturer, Department of Biochemistry, BVDU Medical College, Pune) 2 (Professor, Department of Biochemistry, B. J. Government Medical College, Pune,) 3 (Assistant Professor, Department of Human physiology & Biochemistry, BVDU Dental College, Pune,) ABSTRACT : Insulin resistance has a central role, not only to predict the future development of type 2 diabetes and incident cardiovascular diseases; as well as can be used as a therapeutic target after hyperglycemia is diagnosed. The use of surrogate markers therefore be useful to know the status of insulin resistance. The HOMA IR can perform same function, and the ratios calculated from the lipids and lipoprotein may also be useful to know the status of the insulin resistance in type 2 diabetic patients. In the present study 150 type 2 diabetic subjects and 150 age & sex matched healthy controls were included, to find the cut off value of HOMA IR as well as lipid & lipoprotein ratios to predict insulin resistance. The ROC curve analysis gave the cut off value of >2.41 for HOMA IR with highest sensitivity and specificity, further type 2 diabetics were divided on the basis of cut off value of HOMA IR from present study. Significant increases in TG, VLDL-C, TC/HDL-C, TG/HDL-C, LDL-C/HDL-C ratios were found in patients with HOMA IR cut off value of >2.41 than with HOMA IR cut off value of ≤ 2.41. Also the ROC curve analysis for lipids and lipoproteins indicated that, TC, TG, TC/HDL-C, TG/HDL-C, LDL-C/HDL-C, CRF and Non HDL-C serves the better discriminator for insulin resistance. Therefore, the lipoprotein ratios along with the lipid and lipoprotein levels may be used as markers for insulin resistance. Keywords - Type 2 diabetes mellitus, Insulin resistance, Lipoprotein ratios, Triglyceride, total Cholesterol, ROC curve analysis I. INTRODUCTION Type 2 diabetes mellitus (T2DM) makes up about 90% of total diabetic population. It is a heterogeneous condition showing hyperglycemia, characterized by either impaired insulin secretion and/or insulin resistance. T2DM if uncontrolled may lead to certain complications, which might be due to abnormalities in lipid and lipoprotein metabolism.1 The link between insulin resistance and T2DM has been documented from over a last half century. Insulin resistance is having a central role, not only it helps to foretell future development of T2DM and incident cardiovascular diseases (CVD); as well as can be used as a therapeutic target after hyperglycemia is diagnosed. The high risk population for insulin resistance from general population, thus important to target and to undertake preventive interventions for T2DM and CVD.2, 3 Therefore, the need is to develop the reliable markers for the prediction of insulin resistance. Health care providers use blood tests to determine whether a person has pre-diabetes, including blood glucose levels, but do not usually test for insulin resistance. The most accurate test used for confirmation of insulin resistance is the euglycemic clamp, it is a research tool used by researchers to study more about glucose metabolism. But this test is too costly and complicated to be used.4 The fasting plasma glucose and insulin concentrations are determined by their interaction in a feedback loop. A computer-solved model has been used to predict the homeostatic concentrations which arise from varying degrees of beta-cell deficiency and insulin resistance. Comparison of a patients fasting values with the model's predictions allows a quantitative assessment of the contributions of insulin resistance and deficient beta- cell function to the fasting hyperglycemia, the model is called homeostasis model assessment (HOMA).5 Homeostasis model assessment for insulin resistance (HOMA-IR) is a simple and inexpensive technique to evaluate insulin resistance from basal (fasting) glucose and insulin or C-peptide concentrations. HOMA IR is an alternative to euglycemic clamp and the most commonly used surrogate measure of insulin resistance in vivo. In terms of precision, HOMA-IR is comparable to the euglycemic clamp technique, but it is inferior to the clamp technique in terms of accuracy, but using HOMA-IR makes it possible to study subjects with a single glucose and insulin measurement in the fasting state.3
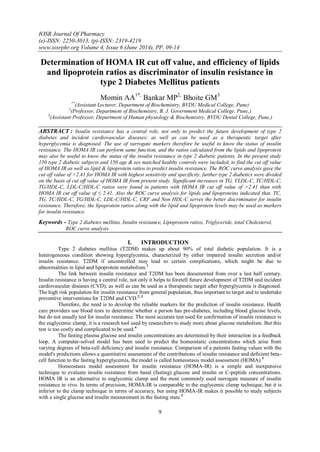
- 2. Determination of HOMA IR cut off value, and efficiency of lipids and… 10 Despite the wide use of HOMA-IR, no consensus has been reached regarding the HOMA-IR cut-off value for identifying subjects with insulin resistance. Various investigators studied the cut off values for HOMA IR from different regions of globe, but the cut off values cannot be applied to all population worldwide. It may vary from race to race.6-12 Therefore, the objective of the present study was to find the cut off value of HOMA IR in T2DM patients, and to check the effect of HOMA IR (insulin resistance) on cardiovascular risk markers, and to evaluate the cut off values of lipid and lipoprotein ratios for the prediction of insulin resistance. II. MATERIAL AND METHODS: 2.1 Subjects In present study, 150 T2DM patients within the age group of 40-60 years were included randomly, from Department of Medicine, B. J. Government Medical College, Pune. T2DM patients with cardiovascular, pulmonary diseases, with any diabetic complications and those on insulin treatment were excluded from the study. In addition to T2DM patients, age and sex matched 150 healthy subjects were included as controls. The control subjects were non-diabetic and with no history of cardiovascular disorders or any major illness. The study protocol was approved by Institutional Ethics Committee and written informed consent was obtained from each participant after complete explanation of the procedure. 2.2 Laboratory measurements The blood samples were collected by venipuncture in a sitting position after fasting of 12 hours. Fasting blood glucose was estimated by enzymatic glucose oxidase-peroxidase method.13 Fasting insulin was measured by chemiluminescence immunoassay.14 Insulin resistance was calculated by means of HOMA-IR from fasting blood glucose and insulin levels.5, 15 Total cholesterol (TC)16 and triglyceride (TG)17 levels were measured by enzymatic methods. High density lipoprotein cholesterol (HDL-C) was estimated after precipitation of chylomicrons, very low density lipoproteins (VLDL) and low density lipoprotein (LDL) fractions of cholesterol from serum with phosphotungstic acid and magnesium chloride. After centrifugation the cholesterol in the HDL fraction, which remains in the supernatant was assayed with enzymatic cholesterol oxidase peroxidase method.18 LDL-C and VLDL-C were calculated by Friedwald’s formula.19 After analysis of all lipid and lipoprotein levels, TC/HDL-C ratio, TG/HDL-C ratio, LDL-C/HDL-C ratio, cholesterol retention fraction (CRF) and non-HDL-C were calculated. 2.3 Statistical analysis To determine the cut off value of HOMA IR, receiver operating characteristic (ROC) curve analysis was used. Further, T2DM patients were divided into two groups, on the basis of HOMA IR cut off value from the present study, the variables were presented as Mean ± SD (standard deviation) and lipids and lipoprotein ratios were compared within these groups using ‘z’ test. The efficacy of lipids, lipoproteins and their ratios viz. TC, TG, TC/HDL-C, TG/HDL-C, LDL- C/HDL-C, CRF and non-HDL-C were evaluated by ROC curve for insulin resistance, their respective cut off values with highest sensitivity and specificity were found with level of significance. Areas under the ROC curve (AUC) and their 95% confidence intervals (CI) were evaluated as a measure of diagnostic accuracy. In general, an AUC of 0.5 suggests no discrimination, whereas a maximal AUC of a ROC near to 1 suggests better discrimination. P-values <0.05 were considered as significant. III. RESULTS The lipids and lipoprotein levels were estimated and the lipoprotein ratios were calculated for study and control group. A cut off value of HOMA IR was calculated for T2DM patients by ROC curve analysis, which was found to be >2.41. Fig. 1 shows the graph with the AUC of 0.868 with standard error of 0.0204 and 95% CI between 0.824 to 0.904 with the associated z and p value of 18.024 & <0.0001 respectively. The sensitivity was 67.33% (95% CI of 59.2-74.8), specificity was 90.67% (95% CI of 85.6-95.3). The positive and negative predictive values of 87.83% & 73.51% respectively. Table 1 shows the statistical findings for the determination of HOMA IR cut off value in T2DM patients from ROC curve analysis. Table 1: Statistical findings in ROC curve analysis of HOMA IR in T2DM patients Area under the ROC curve (AUC) 0.868 Standard Error 0.0204 95% Confidence interval 0.824 to 0.904 z statistic 18.024 Significance level P <0.0001* Associated criterion >2.41 Sensitivity 67.33% (59.2 - 74.8) Specificity 91.33% (85.6 - 95.3) Positive predictive value 87.83% (80.42-93.18) Negative predictive value 73.51% (66.54-79.72)
- 3. Determination of HOMA IR cut off value, and efficiency of lipids and… 11 Figure 1: The ROC curve analysis of HOMA IR in type 2 diabetic patients T2DM patients were further divided into 2 groups on the basis of their defined cut off value of HOMA IR (Insulin resistance); first group consisted of patients with HOMA IR value >2.41 and second group with HOMA IR value ≤2.41. The lipids, lipoproteins and their ratios were compared between these two groups. A significant increase was found in TG, VLDL-C, ratios of TC/HDL-C, TG/HDL-C, LDL-C/HDL-C, while no significant change was found in TC, HDL-C, LDL-C, CRF and non HDL-C within T2DM patients with HOMA IR >2.41 than in patients HOMA IR value of ≤ 2.41. The results of comparison between two groups on the basis of HOMA IR are depicted in Table 2. Table 2: Comparison of lipids, lipoproteins and their ratios in groups on the basis of HOMA IR cutoff value (>2.41) in T2DM patients Variables T2DM patients with HOMA IR of > 2.41 (n=84) T2DM patients with HOMA IR of ≤ 2.41 (n=66) Total cholesterol (mg/dl) 207.1 ± 31.93 199.9 ± 29.10 Triglycerides (mg/dl) 166.4 ± 24.01 158.0 ± 23.42* HDL-C (mg/dl) 43.2 ± 5.44 45.0 ± 6.04 LDL-C (mg/dl) 130.7 ± 30.55 123.4 ± 27.55 VLDL (mg/dl) 33.3 ± 4.80 31.6 ± 4.68* TC/HDL-C 4.9 ± 0.98 4.5 ± 0.77* TG/HDL-C 3.9 ± 0.79 3.6 ± 0.82* LDL-C/HDL-C 3.1 ± 0.87 2.8 ± 0.7* CRF 0.6 ± 0.09 0.6 ± 0.11 Non-HDL-C (mg/dl) 155.0 ± 28.4 164.0 ± 32.71 * Statistically significant We further plotted the ROC curves for lipids and lipoprotein ratios for the prediction of insulin resistance in patients with T2DM. ROC curve analysis gave the highest AUC ± SE (standard error) for TC/HDL-C i.e. 0.860 ± 0.0216 with 95% CI of 0.816-0.897, followed by LDL-C/HDL-C (0.838 ± 0.0231), CRF (0.836 ± 0.0232), Non HDL-C (0.827 ± 0.0234), TG/HDL-C (0.805 ± 0.0248), and the least AUC was found for TG & TC (0.755 ± 0.0282 & 0.795 ± 0.0251 respectively) with the significance level of <0.0001. The AUC with standard error and 95% CI for lipids and lipoprotein ratios are shown in Table no 3, and fig. 2 depicts the respective ROC curves for lipids & lipoprotein ratios. The cut off values of TC, TG, TC/HDL-C, TG/HDL-C, LDL-C/HDL-C, CRF and non HDL-C by ROC curve analysis were 180.7, 122.3, 4.1, 2.91, 2.44, 0.59 and 143 respectively with the highest sensitivity and specificity. Table 4 indicates the cut off values for lipids & lipoprotein ratios with highest sensitivity and specificity with respective 95% CI. Table 3: Area under the receiver-operating characteristic curves of the lipid markers With the corresponding 95% confidence interval Parameters Area under the ROC curve ± SE 95% CI p value TC 0.795 ± 0.0251 0.745-0.839 <0.0001* TG 0.755 ± 0.0282 0.702-0.803 <0.0001* TC/HDL 0.860 ± 0.0216 0.816-0.897 <0.0001* TG/HDL 0.805 ± 0.0248 0.755-0.848 <0.0001* LDL/HDL 0.838 ± 0.0231 0.791-0.878 <0.0001* CRF 0.836 ± 0.0232 0.790-0.876 <0.0001* NON HDL 0.827 ± 0.0234 0.780-0.868 <0.0001*
- 4. Determination of HOMA IR cut off value, and efficiency of lipids and… 12 Table 4: The cut off values of lipids and lipoprotein ratios with corresponding highest sensitivity and specificity from the ROC curves for the prediction of insulin resistance in T2DM patients Parameters Cut off value Type 2 diabetes mellitus Sensitivity (%) 95% CI Specificity (%) 95 % CI TC 180.7 80.67 73.4-86.7 63.33 55.1-71.0 TG 122.3 98.67 95.3-99.8 50.0 41.7-58.3 TC/HDL-C 4.1 78.0 70.5-84.3 82.67 75.6-88.4 TG/HDL-C 2.91 87.33 80.9-92.2 62.00 53.7-69.8 LDL-C/HDL-C 2.44 76.0 68.4-82.6 79.33 72.0-85.5 CRF 0.59 74.67 66.9-81.4 80.0 72.7-86.1 NON HDL-C 143 74.0 66.2-80.8 78.67 71.2-84.9 Figure 2: ROC curves for TC, TG, TC/HDL-C, TG/HDL-C, LDL-C/HDL-C, CRF and Non HDL-C IV. DISCUSSION: The tendency of Indians to coronary artery disease (CAD) has been confirmed beyond doubt, Indian subjects are more prone to develop CAD at a younger age, it is calculated, that by the year 2015 India will be having largest CAD burden worldwide. It is demonstrated that the condition of insulin resistance plays a primary role both in the pathogenesis of metabolic syndrome and in the pathogenesis and progression of CVD. The previous results showed positive correlation of elevation in fasting blood glucose and insulin resistance with the frequency of cardiac events in patients with CAD, with or without a previous diagnosis of diabetes. Also plasma TG, HDL-C, and TC are independently associated with insulin resistance, insulin level, and are independent predictors of CVD.20 Clinically, it will help in targeting the insulin resistant population, a preferred domain for primary prevention of diabetes.
- 5. Determination of HOMA IR cut off value, and efficiency of lipids and… 13 The present study aimed to find the cut off values of HOMA IR and lipoprotein ratios for insulin resistance prediction. The ROC curve analysis for HOMA IR in T2DM patients gave the cut off value of HOMA IR to be >2.41. So, this cut off value can be used to predict the population with insulin resistance, and thereby concentrating on the preventive measures in the development of T2DM, metabolic syndrome and CVDs. Additional use of cut off value of HOMA IR i.e. >2.41 was used as indicator of insulin resistance in study group, the yield for T2DM patients was 84 (56%). The comparison of biochemical parameters within the groups on the basis of HOMA IR cut off value (>2.41) in T2DM patients, showed a significant increase in TG, VLDL-C, and lipoprotein ratios of TC/HDL-C, TG/HDL-C and LDL-C/HDL-C in group having insulin resistance than without according to the cut off value from present study, this specifies the role of insulin resistance in the progression or worsening of dyslipidemia with increase in HOMA IR index i.e. insulin resistance. The different cut off points were given throughout the world in general, diabetic and/or metabolic syndrome population. In a group of non-obese, normoglycemic Brazilian subjects found a threshold value for insulin resistance to be 2.71.7 A study in diabetic individuals by P Gayoso-Diz21 et al found the HOMA-IR cut-off value of 1.60 for metabolic syndrome according to ATP III guidelines in men and 1.58 in women. J Yin22 et al in Chinese children and teenagers, a HOMA IR cut off value of 3.0 was found for total participants, while it was 2.6 for children in prepubertal stage and 3.2 in pubertal period. While for diagnosis of metabolic syndrome HOMA IR cut off values were 2.3 in total participants, 1.7 in prepubertal children and 2.6 in pubertal adolescents. In an Iranian study by A Esteghamati3 et al in diabetic individuals gave the cut off points for HOMA IR, to be 3.875 and 4.325 for ATPIII and IDF defined metabolic syndrome respectively. The cut off value of HOMA-IR 3.04 was found using ROC curve analysis in non-diabetic adults from Korea by S Lee9 et al for defining insulin resistance. The risk of CVDs by insulin resistance was analyzed by various investigators. The results of the present study are in accordance with the study by T Abdel-Aziz23 et al, mean fasting blood glucose, TG, TG/ HDL-C ratio, and insulin level were significantly higher in the elevated HOMA-IR (>3.2) group, but differs for HDL-C level which was significantly lower in the elevated HOMA IR group in their study. In Taiwanese adults, JK Chiang24 et al found significantly higher levels of BMI, fasting blood glucose, TG, alanine transaminase, & insulin, while HDL-C level was significantly lower in the elevated HOMA-IR (>2) group, with no significant differences in TC and LDL-C. S Ray20 et al, revealed the findings with significantly higher BMI, TC, TG, LDL-C, TG/HDL-C and TC/HDL-C in individuals with HOMA IR >2 as compared to subjects with HOMA IR <2. In urban Indian adolescents, the significant differences were found for TG, HDL-C but not for TC in metabolic syndrome based on HOMA IR.25 Therefore, from the findings of present study the HOMA IR value of >2.41 can be used as a surrogate marker for prediction of insulin resistance, simply by estimating the fasting blood glucose and insulin. The preventive measures will be taken accordingly against development of T2DM and CVDs in future. Apart from the HOMA IR as a surrogate marker, the research was focused on the measurement of TG/HDL-C as surrogate marker for insulin resistance from India as well as from other countries. In the present study, further we evaluated the efficacy of lipid, and their ratios with lipoproteins for prediction of insulin resistance. The ROC curve analysis for TC, TG, TC/HDL-C, TG/HDL-C, CRF and Non HDL-C gave the cut off values of 180.7, 122.3, 4.1, 2.91, 2.44, 0.59 and 143 respectively. Previous studies concentrated only on TG/HDL-C ratio, and found similar results for TG/HDL-C ratio as a surrogate marker for the prediction of insulin resistance as that of present study. P Samant26 et al verified TG/HDL-C ratio as economic laboratory marker to identify insulin resistance in metabolic syndrome patients. In study by S Ray20 et al indicated TG/HDL-C and TC/ HDL-C ratios can be used as reliable markers for predicting the insulin resistance. C Giannini27 et al stated TG/HDL-C can be used to predict insulin resistance with the cut off value of 2.27 for TG/HDL-C, which is slightly lower than that of found in present study. JK Chiang24 et al identified use of additional three factors viz. sex, waist circumference and ALT levels to enhance accuracy of TG/HDL-C for diagnosis of insulin resistance. Slightly higher AUC were obtained for TG/HDL-C predicting insulin resistance in non-Hispanic whites, non- Hispanic blacks, and Mexican Americans.28 In a cross sectional study, ZH Jian29 et al, suggested LDL-C/HDL-C ratio of 0.74 to be the best marker for prediction of insulin resistance in non-obese subjects. In Japanese adults, cut-off point for TG/HDL-C was ≥1.50 for identifying insulin resistance, and for LDL-C/HDL-C it was ≥2.14 in non-obese subjects, and ≥2.20, ≥2.25 respectively in overweight subjects.30 Cut off value of ≥3.5 for TG/HDL-C was found by T McLaughlin31 et al. One of the study by J Jeppesen32 et al, stated patients with a high TC/HDL-C were significantly more insulin resistant. The high risk for CHD was demonstrated by WP Castelli33 they gave cut off value of ≥4.5 for TC/HDL-C. In Pakistani adults, A Nadeem34 et al point out BMI as the best indicator of insulin resistance in males. V. CONCLUSION The results of HOMA IR cut off value; therefore can be used for the prediction or diagnosis of insulin resistance in general population from Maharashtra. Also, HOMA IR can be used to assess longitudinal changes of insulin resistance in patients with diabetes in order to examine the natural history of the disease and to assess the effects of treatment. It was also shown that TC/HDL-C, TG/HDL-C, LDL-C/HDL-C, CRF and Non HDL-C cut-points can also identify the person who are insulin resistant and at increased CVD risk. As HOMA IR may differ from population to population, the present study results can be used as a reference for further Indian studies using HOMA-IR value as a surrogate marker for insulin resistance, so the results should be interpreted according to population being studied. In addition, this information of HOMA IR, will be helpful to the individual clinician/investigator, can use this approach that seems most relevant to their clinical/research interests, for determining insulin resistance, also for prediction and management of T2DM.
- 6. Determination of HOMA IR cut off value, and efficiency of lipids and… 14 REFERENCES: [1]. AA Momin, MP Bankar, GM Bhoite, B Shaheen, RD Yadav: Association of cardiovascular risk factors with insulin & insulin resistance in type-2 Diabetes Mellitus patients. Sch. J. App. Med. Sci., 2(1B), 2014, 152-156 [2]. R Taylor: Insulin Resistance and Type 2 Diabetes. Diabetes, 61, 2012, 778-779 [3]. A Esteghamati, H Ashraf, O Khalilzadeh, A Zandieh, M Nakhjavani, A Rashidi: Optimal cut-off of homeostasis model assessment of insulin resistance (HOMA-IR) for the diagnosis of metabolic syndrome: third national surveillance of risk factors of noncommunicable diseases in Iran (SuRFNCD-2007). Nutrition & Metabolism, 7, 2010, 26. [4]. National Institutes of Health: Insulin Resistance and Prediabetes. NIH Publication No. 09–4893 October 2008 [5]. DR Matthews, JP Hosker, AS Rudenski, BA Naylor, DF Treacher, RC Turner: Homeostasis model assessment: insulin resistance and beta-cell function from fasting plasma glucose and insulin concentrations in man. Diabetologia, 28(7), 1985, 412-419 [6]. MT Ghiringhello, JG Vieira, TT Tachibana, C Ferrer, RM Maciel, PH Amioka et al: Distribution of HOMA-IR in Brazilian subjects with different body mass indexes. Arq Bras Endocrinol Metab, 5, 2006 ,573-574 [7]. B Geloneze, EM Repetto, SR Geloneze, MA Tambascia, MN Ermetice: The threshold value for insulin resistance (HOMA-IR) in an admixture population IR in the Brazilian Metabolic Syndrome Study. Diabetes Res Clin Pract, 72, 2006, 219-220. [8]. A Esteghamati, H Ashraf, AR Esteghamati, A Meysamie, O Khalilzadeh, M Nakhjavani et al: Optimal threshold of homeostasis model assessment for insulin resistance in an Iranian population: The implication of metabolic syndrome to detect insulin resistance. Diabetes Res Clin Pract, 84, 2009, 279-287 [9]. S Lee, S Choi, HJ Kim, YS Chung, KW Lee, HC Lee et al: Cut off values of surrogate measures of insulin resistance for metabolic syndrome in Korean non-diabetic adults. J Korean Med Sci, 21, 2006, 695-700 [10]. Y Nakai, M Fukushima, S Nakaishi, H Kishimoto, Y Seino, S Nagasaka et al: The threshold value for insulin resistance on homeostasis model assessment of insulin sensitivity. Diabet Med, 19, 2002, 344-348 [11]. B Tresaco, G Bueno, I Pineda, LA Moreno, JM Garagorri, M Bueno: Homeostatic Model Assessment (HOMA) index cut-off values to identify the metabolic syndrome in children. J Physiol Biochem, 61, 2005, 381-388 [12]. M Keskin, S Kurtoglu, M Kendirci, ME Atabek, C Yazici: Homeostasis model assessment is more reliable than the fasting glucose/insulin ratio and quantitative insulin sensitivity check index for assessing insulin resistance among obese children and adolescents. Pediatrics, 115, 2005, 500-503 [13]. P Trinder: Glucose assay: A colorimetric enzyme-kinetic method assay. Ann Clin Biochem, 6, 1969, 24 [14]. LR Sapin, V Le Galudec, F Gasser, M Pinget, D Grucker: Elecsys Insulin Assay: Free Insulin Determination and the Absence of Cross-Reactivity with Insulin. Clin Chem, 47(3), 2001, 602-605 [15]. SM Haffner, E Kennedy, C Gonzalez, MP Stern, H Miettinen: A prospective analysis of the HOMA model. The Mexico City Diabetes Study. Diabetes Care, 19, 1996, 1138-1141 [16]. CC Allain, LS Poon, CS Chan, W Richmond, PC Fu: Enzymatic determination of total serum cholesterol. Clin Chem, 20(4), 1974, 470-475 [17]. G Bucolo, H David: Quantitative determination of serum triglycerides by the use of enzymes. Clin Chem, 19(5), 1973, 476-482 [18]. GR Warnick, M Nauck, N Rifai: Evolution of method for measurement of HDL cholesterol: from ultracentrifugation to homogenous assays. Clin Chem, 47(9), 2001, 1579-1596 [19]. WT Friedewald, RI Levy, DS Fredrickson: Estimation of the concentration of low density lipoprotein cholesterol in plasma, without use of the preparative ultracentrifuge. Clin Chem, 18, 1972, 499-502 [20]. S Ray, AK Bairagi, S Guha, S Ganguly, D Ray, AK Basu et al: A simple way to identify insulin resistance in non-diabetic acute coronary syndrome patients with impaired fasting glucose. Indian J Endocr Metab, 16, 2012, S460-S464 [21]. P Gayoso-Diz, A Otero-González, MX Rodriguez-Alvarez, R Gude, R García, A De Francisco et al: Insulin resistance (HOMA-IR) cut-off values and the metabolic syndrome in a general adult population: effect of gender and age: EPIRCE cross-sectional study. BMC Endocrine Disorders, 13, 2013, 47. [22]. J Yin, M Li, L Xu, Y Wang, H Cheng, X Zhao et al: Insulin resistance determined by Homeostasis Model Assessment (HOMA) and associations with metabolic syndrome among Chinese children and teenagers. Diabetology & Metabolic Syndrome, 5, 2013, 71. [23]. T Abdel-Aziz, N Azab, M Odah, IM Eldeen: Correlation of Triglycerides to High Density Lipoprotein Cholesterol Ratio with Insulin Resistance in Egyptian Population. Biochemistry, 3(8), 2013, 5-6 [24]. JK Chiang, NS Lai, JK Chang, M Koo: Predicting insulin resistance using the triglyceride-to-high-density lipoprotein cholesterol ratio in Taiwanese adults. Cardiovascular Diabetology, 10, 2011, 93 [25]. Y Singh, MK Garg, N Tandon, RK Marwaha: A Study of Insulin Resistance by HOMA-IR and its Cut-off Value to Identify Metabolic Syndrome in Urban Indian Adolescents. J Clin Res Pediatr Endocrinol, 5(4), 2013, 245-251 [26]. P Samant, P Chavan, S Rai: TG/HDL-C ratio, a surrogate marker of insulin resistance in patients of metabolic syndrome. MGM Journal of Medical Sciences, 1(1), 2013, 18-21 [27]. C Giannini, N Santoro, S Caprio, G Kim, D Lartaud, M Shaw et al: The Triglyceride-to-HDL Cholesterol Ratio Association with insulin resistance in obese youths of different ethnic Backgrounds. Diabetes Care, 34, 2011, 1869-1874 [28]. C Li, ES Ford, YX Meng, AH Mokdad, GM Reaven: Does the association of the triglyceride to high-density lipoprotein cholesterol ratio with fasting serum insulin differ by race/ethnicity? Cardiovascular Diabetology, 7, 2008, 4 [29]. JCC Lung, PC Ko, YH Sun, JY Huang, CC Ho, CY Ho et al: The association between the apolipoprotein A1/ high density lipoprotein -cholesterol and diabetes in Taiwan- a cross-sectional study. BMC Endocrine Disorders, 13, 2013, 42 [30]. R Kawamoto, Y Tabara, K Kohara, T Miki, T Kusunoki, S Takayama et al: Low-density lipoprotein cholesterol to high-density lipoprotein cholesterol ratio is the best surrogate marker for insulin resistance in non-obese Japanese adults. Lipids in Health and Disease, 9, 2010, 138 [31]. T McLaughlin, G Reaven, F Abbasi, C Lamendola, M Saad, D Waters et al: Is there a simple way to identify insulin-resistant individuals at increased risk of cardiovascular disease? Am J Cardiol, 96(3), 2005, 399-404 [32]. J Jeppesen, FS Facchini, GM Reaven: Individuals with high total cholesterol/HDL cholesterol ratios are insulin resistant. J Intern Med, 243(4), 1998, 293-298 [33]. Castelli WP: Cardiovascular disease in women. Am J Obstet Gynecol, 158(6Pt2), 1988, 1553-1560, 1566-1567 [34]. A Nadeem, AK Naveed, MM Hussain, SI Raza: Cut-off values of anthropometric indices to determine insulin resistance in Pakistani adults. J Pak Med Assoc, 63(10), 2013, 1220-1225