2. Podcasting and Radio Listening via
Internet Survey
June 2008
1. Introduction
Over the past few years the Internet has proved to be a very successful platform
for delivering audio content, perhaps most notably for live streaming. Nowadays,
just about every UK radio station has an online listening facility and several have
developed Listen Again services where people can catch programmes that they
might have missed earlier in the week.
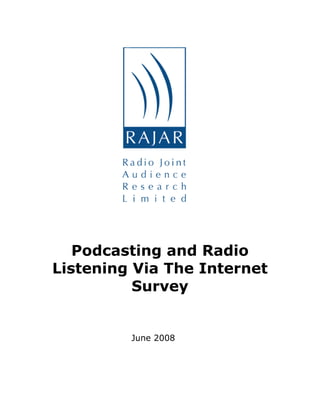
Weekly listening via the internet *
0%
2%
4%
6%
8%
10%
12%
14%
16%
14.4%
13.4%
10.8%
8.6%
6.1%
3.5%
2.2%
Q1 02 Q1 03 Q1 04 Q1 05 Q1 06 Q1 07 Q1 08
Base: All adults 15+
Source: RAJAR/Ipsos MORI
(* Respondents who claimed to listen to the radio via the Internet at least once a week. Includes
Listen Again + listening to foreign stations and other non-RAJAR services)
- 1 -
3. - 2 -
Intelligent interactive software has enabled Personalised Online Radio (POR)
services to gain a foothold (e.g. Last fm, Pandora), while the Internet has enabled
broadcasters, newspapers, and other producers of audio to potentially reach a
whole new audience via Podcasts – downloadable files that can be listened to at
the downloader’s convenience.
RAJAR traditionally only measures live radio. Listen Again, POR and Podcasts
reside outside of the measurement spectrum. However, many RAJAR subscribers
are actively involved in those particular areas, and conduct that business largely
without any real information on actual consumption. Additionally, there is little or
no knowledge of how these relatively new media formats are impacting on
conventional radio.
In an effort to fill this gap, RAJAR commissioned its second research study into
Podcasting and radio listening via Internet.
The first instalment was conducted in October – November 2007. This later
survey was conducted in April and May 2008 by Ipsos MORI using a sample made
of respondents to the first instalment of this survey (conducted in October 2007)
and RAJAR respondents from the previous 6 months who had claimed to listen to
the radio via the Internet, or downloaded Podcasts.
Along with all 614 respondents to the first online survey, a further 2,881 RAJAR
respondents within the target audience (i.e. respondents who had claimed to
listen to the radio via the Internet and / or download Podcasts) were invited to
participate in the online survey.
At the cut-off point, and after QC procedures had been implemented, the final
usable sample was 863 respondents (394 from the first survey and 469 new
respondents). This report is based on their responses.
4. - 3 -
2. Summary
14.5 million people (up from 12m in Survey 1) have claimed to listen to radio via
the Internet, including 10.9 million listening live (up from 9m) and 9.3 million
who have used Listen Again services (up from 7.6m). In addition, 6 million have
downloaded a Podcast (up from 4.3m) and 2.1 million have used a Personalised
Online Radio (up from 1.6m).
9.4 million people claim to listen to radio via the Internet at least once a week,
either live or through a Listen Again service (up from 8.1m), and 3.7 million to
listen to a Podcast (up from 1.9m).
The average user of Listen Again services listens to 1.8 programmes each week.
Three quarters of Listen Again listeners say the service has no impact on the
amount of live radio that they listen to; however, 13% claim to now listen to
more live radio while 7% say they listen to less. Almost half of Listen Again
listeners said they are now listening to radio programmes that they didn’t
previously listen to as a result of the Listen Again service.
The typical Podcast user subscribes to 3.59 Podcasts (up from 3.16) and spends
just over an hour in the last week listening to them. Comedy and music are the
two favourite genres.
iTunes is the software of choice, used by almost three quarters of Podcast users
to subscribe to Podcasts, while a fifth (20%) simply download directly from the
website via their browser. 79% listen to Podcasts on their home computer, and
66% listen using a portable audio/mp3 player.
Podcast listening occurs throughout the day, with an evening peak when 44% of
Podcast users press the play button (weekdays). 83% listen to Podcasts that are
more than a week old.
Podcasting appears to have a marginal positive effect on live radio listening –
almost 15% say they now listen to more live radio since they started downloading
Podcasts while 10% say they listen to less, and 39% say they are now listening to
radio programmes that they never used to listen to before thanks to Podcasts.
Thinking about how Podcasts may be funded in the future, there is some appetite
among the Podcast community for Podcasts containing adverts if they were free
as a result with 53% saying they would be interested in downloading such
content; however, only 31% responded positively to the idea of Podcasts without
adverts that had to be paid for.
5. - 4 -
3. Report
Unless otherwise stated, the sample size for tables is 863.
How Often?
Over a quarter (28.9%) of the UK’s adult population (those aged 15 or over) have
listened to radio via the Internet. That equates to 14.5 million people.
Two thirds of these, or 18.8% of the adult population, listen at least once a week,
with 5% listening via the Internet every day or most days – that’s 2.5 million
people.
Table 1: How often do you generally listen to the radio via the
Internet?
Sample size = 863 (‘000s) (%)
Base = All Adults aged
15+
50,344 100%
Ever listen via Internet 14,534 28.9
Several times a day 496 1.0
Everyday/most days 2,012 4.0
2-3 days per week 3,463 6.9
About once a week 3,467 6.9
About once a month 3,108 6.2
Less often 1,905 3.8
Don’t know 81 0.2
Never listen via Internet 35,810 71.1
6. - 5 -
Where & When?
The vast majority of Internet radio listeners (89.2%) listen at home; almost 1 in
4 listen at work (24.4%) while 6.4% listen elsewhere.
Asked when they listen, 36.3% (5.3 million) said their listening was always in real
time. A further 24.7% (3.6 million) said they listened at a later time than the
original broadcast, while 39% (5.7 million) used a combination of real time and
Listen Again, meaning that 9.3 million people use Listen Again facilities.
Table 2: Where/when do you listen to radio via the Internet?
Sample size = 827 (‘000s) (%)
Base = all listening via
Internet
14,534 100%
Where?
At home 12,966 89.2
At work 3,542 24.4
Elsewhere 930 6.4
When?
Using live streaming 5,274 36.3
Using Listen Again 3,594 24.7
A combination of these 5,666 39.0
Listen Again
Those who said they have used a Listen Again service were asked about the
programmes they had listened to in the past 7 days. Approximately half of this
sample listened to 1 or 2 programmes, with the average coming in at 1.78.
Table 3: Number of Listen Again programmes in past 7 days
Sample size = 532 ‘000s %
Base = All who listen again 9,260 100%
0 1,857 20.1
1 2,981 32.2
2 2,501 27.0
3 877 9.5
4 490 5.3
5 192 2.1
6+ 361 3.9
Mean (excludes not stated) 1.78
7. - 6 -
We asked the Listen Again audience some questions about the impact that Listen
Again had on their other listening to music and radio.
On balance Listen Again had a positive affect on overall listening, with 13.2%
claiming to listen to more live radio since discovering Listen Again, and 7.1%
listening less, although only 2% claimed to be listening to significantly less live
radio. The vast majority (77.2%) said it had no effect either way.
Table 4: Since you started listening after the original time of
broadcast (Listen Again), how would you say your live radio habits
have changed?
Sample size = 532 (‘000s) (%)
Base = all who Listen
Again
9,260 100%
I now listen to…
(5) …much more live
radio
275 3.0
(4) …more live radio 945 10.2
(3) …just as much as
before
7,146 77.2
(2) …less live radio 473 5.1
(1) …much less live radio 182 2.0
Mean score out of 5 3.07
Furthermore, almost half of Listen Again listeners (48%, or 4.4 million) say they
now listen to radio programmes that they didn’t previously listen to as a result of
the Listen Again service.
8. - 7 -
Assessing the impact of Listen Again on pre-recorded music (CDs, mp3s, vinyl,
tape), there was no significant impact. 74.4% claimed it had no effect
whatsoever, 9% said they now listen to more pre-recorded music while 12.3%
said they listened to less.
Table 5: Has using Listen Again changed how much recorded music you
listen to?
Sample size = 532 (‘000s) (%)
Base = all who Listen
Again
9,260 100%
I now listen to…
(5) …much more music 261 2.8
(4) …more music 569 6.1
(3) …just as much as
before
6,888 74.4
(2) …less music 986 10.6
(1) …much less music 153 1.7
Mean score out of 5 2.98
Personalised Online Radio (POR)
Personalised Online Radio is an online service that uses a music recommendation
system. Intelligent software selects music for listeners based on their personal
likes and dislikes. Some of the better known examples are Last FM and Pandora.
Asked if they were aware of such services, 31.3% of Internet radio listeners (4.8
million) said that they were.
People who said they were aware of POR were asked how often they used it. The
total number of POR users is just over 2 million with over a million using at least
once a week.
Table 6: How often do you use Personalised Online Radio?
Sample size = 106 (‘000s) (%)
Base = All POR users 2,069 100%
Use everyday 170 8.2
Use 2-3 times per week 346 16.7
Use about once a week 555 26.8
Use about once a month 413 20.0
Use less often 545 26.0
Varies 40 1.9
9. - 8 -
All users were asked if POR had changed how much conventional radio they
listened to.
Table 7: Has using POR changed how much traditional live radio you
listen to?
Sample size = 106 (‘000s) (%)
Base = All POR users 2,069 100%
I now listen to…
(5) …much more live
radio
128 6.2
(4) …more live radio 118 5.7
(3) …just as much as
before
1,467 70.9
(2) …less live radio 198 9.6
(1) …much less live radio 12 0.6
Mean score out of 5 3.08
For 82.8% of users, POR has not eroded their traditional radio listening, and only
0.6% admitted listening to much less.
Media Players and Software
All respondents (i.e. everyone who listens to radio via the Internet or downloads
Podcasts) were asked which media player software they use to organise music
and/or audio on their PCs at home and at work. At home, Windows Media Player
came out on top, being mentioned by 8.6 million users. The next most popular
applications were iTunes (7.8 million) and RealPlayer (5.9 million).
At work, Windows Media Player was still the preferred software with 4.4 million
users. Both iTunes and RealPlayer were mentioned by 2.3m.
Table 8: Which media player software do you use to organise music
/ audio on your computer? (Top 3 answers)
Sample size = 863 At Home At Work
‘000s % ‘000s %
Base = All respondents 15,223 100% 15,223 100%
iTunes 7,760 51.0 2,290 15.0
Windows Media Player 8,642 56.8 4,366 28.7
RealPlayer 5,942 39.0 2,291 15.0
10. - 9 -
Podcasts
A total of 6 million people have ever downloaded Podcasts, representing 12% of
UK adults. 1.9 million have downloaded a vodcast (video Podcast) and almost 1
million have downloaded an enhanced Podcast (i.e. with chapters and pictures).
Table 9: Do you ever download Podcasts?
Sample size = 863 ‘000s %
Base = All respondents 15,223 100%
TOTAL YES 6,031 39.6
Yes – standard Podcasts 5,185 34.1
Yes – enhanced Podcasts 974 6.4
Yes – video Podcasts 1,869 12.3
No 9,102 59.8
Don’t know 90 0.6
3.7 million listen to Podcasts at least weekly.
Table 10: How often do you generally listen to Podcasts?
Sample size = 317 ‘000s % All % Podcast users
All adults… 50,334 100% (Sample = 317)
…downloading
Podcasts…
…ever 6,031 12.0 100%
…several times a day 157 0.3 2.6
…everyday 587 1.2 9.7
…2-3 days per week 949 1.9 15.7
…about once a week 2,003 4.0 33.2
…about once a month 1,128 2.2 18.7
…less often 1,173 2.3 19.4
…don’t know 35 0.1 0.6
11. - 10 -
Asking people for a minute-perfect assessment of the time they spend listening to
Podcasts was deemed impractical so instead, they were asked to select the time-
band that best reflected their consumption in the last week. By taking the mid
point in the estimations, we are able to calculate an approximate average
duration. In a typical week, the average Podcast listener listens for just over an
hour (63.2 minutes), and an extrapolation of this figure shows that the average
UK adult listens to 5.6 minutes of Podcasts per week.
Table 11: In the last week, how long do you spend listening to
Podcasts?
Sample = 317
Podcast users
(000s)
%
Podcast
users
%
All adults
100%
…downloading Podcasts… 6,031 100% 12.0%
Not at all 1,598 26.5% 91.2%
Less than 30 minutes
(15)
1,042 17.3% 2.1%
30 minutes to an hour
(45)
1,138 18.9% 2.3%
1-2 hours (90) 1,182 19.6% 2.3%
2-3 hours (150) 514 8.5% 1.0%
3-5 hours (240) 236 3.9% 0.5%
> 5 hours (300) 227 3.8% 0.5%
Not sure 94 1.6% 0.2%
Average minutes in last
week (without “don’t
know”)
63.2 mins 5.6 mins
12. - 11 -
Types of Podcast
Asked what types of Podcast they were interested in, more than 3 million opted
for Comedy. Next came Music (2.2m), TV & Film (1.9m) and News & Politics
(1.3m). However, when asked which particular types of Podcast they actually
subscribed to, there were some differences. Comedy, Music and TV & Film News
& Politics were still numbers 1, 2 and 3 respectively, but in fourth position
Technology was replaced by News and Politics.
Table 12: What types of Podcast are you interested in?
Interested in…. Subscribe to…
Sample size = 317 ‘000s % (Rank) ‘000s % (Rank)
Base = All Podcast
users
6,031 100% 6,031 100%
Comedy 3,066 50.8 (1) 2,208 36.6 (1)
Music 2,223 36.9 (2) 1,335 22.1 (2)
TV and Film 1,876 31.1 (3) 899 14.9 (3)
Technology 1,412 23.4 (4) 743 12.3 (5)
News & Politics 1,311 21.7 (5) 882 14.6 (4)
Arts 1,167 19.4 (6) 639 10.6 (7)
Sports and Recreation 1,026 17.0 (7) 522 8.7 (8)
Science & Medicine 1,017 16.9 (8) 519 8.6 (9)
Games and Hobbies 981 16.3 (9) 408 6.8 (12)
Education (e.g.
languages)
910 15.1 (10) 498 8.3 (11)
Society & Culture 887 14.7 (11) 662 11.0 (6)
Business 711 11.8 (12) 514 8.5 (10)
Health 400 6.6 (13) 188 3.1 (14)
Religion & Spirituality 399 6.6 (14) 251 4.2 (13)
Kids and Family 310 5.1 (15) 99 1.6 (16)
Government &
Organisations
268 4.4 (16) 165 2.7 (15)
13. - 12 -
Podcasts in General
The BBC is the biggest Podcast supplier with almost 70% reach within the
Podcasting community.
Table 13: Do you subscribe to any Podcasts from any of the following
suppliers?
Sample size = 317 ‘000s %
Base = All Podcast users 6,031 100%
BBC 4,061 67.3
UK commercial radio stations 244 4.0
UK newspapers 485 8.0
foreign/international radio stations 671 11.1
Other 1,363 22.6
Don't Know 1,116 18.5
Overall, Podcast users subscribe to an average of 3.6 Podcasts per head, and
over 50% subscribe to between 1 and 5 Podcasts.
Table 14: How many Podcasts do you currently subscribe to?
Sample size = 317 ‘000s %
Base = All Podcast users 6,031 100%
0 892 14.8
1 1250 20.7
2 875 14.5
3 515 8.5
4 220 3.6
5 287 4.8
1-5 3147 52.2
6-10 553 9.2
11+ 319 5.3
Mean (excludes not stated) 3.59
14. - 13 -
Respondents were asked what proportion of the individual Podcast episodes they
normally listen to. Over half (59.8%) claimed that they usually listen to the
whole episode, and nearly a third (28.1%) said they listened to most of it.
Table 15a: In general, what proportion of an episode do you normally
listen to?
Sample size = 317 ‘000s %
Base = All who ever
download Podcasts
6,031 100%
The whole episode 3,608 59.8
Most of it 1,693 28.1
About half 170 2.8
Less than half 102 1.7
None 12 0.2
It varies widely 336 5.6
Don’t know 109 1.8
Only 30% of Podcast users have time to listen to all the Podcasts they have
downloaded in an average week, with another 31% listening to half of them or
less.
Table 15b: In an average week, roughly what proportion of all Podcast
episodes that you download do you actually get round to listening to?
Sample size = 317 ‘000s %
Base = All who ever
download Podcasts
6,031 100%
All of them 1,831 30.4
Most of them 2,195 36.4
About half of them 916 15.2
Less than half of them 932 15.5
None of them 0 0.0
Don't know / Not
applicable
157 2.6
Respondents were next asked if they ever listen to Podcast episodes that are
more than a week old. Over four out of five (82.9%) said that they do.
15. - 14 -
Software
The most popular software used to download and play Podcasts is iTunes, which
was chosen by almost three quarters (72.8%) of Podcast users. However almost
20% download directly from websites.
Table 16: What software program do you use to subscribe to Podcasts?
Sample size = 317 ‘000s %
Base = All Podcast users 6,031 100%
iTunes 4,390 72.8
QuickTime 463 7.7
Mozilla 220 3.6
Juice 219 3.6
Sony PSP 142 2.4
Directly via
website/browser
1,192 19.8
Other 159 2.6
Hardware
About 10% of Podcast users subscribe to the same Podcasts on more than one
computer (for example, at home and at work).
The PC is the number one device when it comes to listening to Podcasts for
almost 80% of downloaders; however, a significant number also use a portable
audio player (66.1%) such as an iPod. The following table shows the devices
used in order of preference.
Table 17: On which of the following do you listen to Podcast episodes?
Sample size = 317 ‘000s %
Base = All Podcast users 6,031 100%
Home computer (PC/Mac) 4,741 78.6
Portable mp3/digital audio
player
3,985 66.1
Mobile phone 598 9.9
Through a home hi-fi 309 5.1
Other 614 10.2
16. - 15 -
Podcast Listening Behaviour
Four out of five (79%) Podcast users like to listen to Podcasts at home – that’s
4.7 million adults. The car and public transport are the next most popular
locations, each being favoured by one in four (25%, or just over 1.5 million),
while walking (21%) and the workplace (19%) also featured.
Table 18: Where do you normally listen to Podcasts?
Sample size = 317 ‘000s %
Base = All Podcast users 6,031 100%
At home 4,743 78.6
In the car 1,523 25.3
On public transport 1,522 25.2
Whilst walking 1,262 20.9
At work 1,132 18.8
Whilst exercising 659 10.9
During the week, the late afternoon and evening are the favourite times of day to
listen to Podcasts, although there is a significant level of listening throughout the
day. Apart from midnight to 6am, the least likely time to find people listening to
Podcasts is between 9am and 2pm.
Table 19a: WEEKDAYS - When do you normally listen to Podcasts?
Sample size = 317 ‘000s %
Base = All Podcast users 6,031 100%
Early morning (6am-9am) 1,372 22.7
Mid morning (9am-12pm) 719 11.9
Lunchtime (12pm-2pm) 643 10.7
Early afternoon (2pm-4pm) 1,009 16.7
Afternoon/early evening (4pm-
7pm)
1,930 32.0
Evening (7pm-midnight) 2,626 43.5
Overnight 273 4.5
Don’t know 798 13.2
17. - 16 -
During the weekend, as one would expect, there is very little listening taking
place before 9am. Again the peak of listening is in the evening, although the high
level of “don’t know” compared with weekdays indicates that listening time varies
a lot more during the weekend.
Table 19b: SATURDAY - When do you normally listen to Podcasts?
Sample size = 317 ‘000s %
Base = All Podcast users 6,031 100%
Early morning (6am-9am) 339 5.6
Mid morning (9am-12pm) 939 15.6
Lunchtime (12pm-2pm) 742 12.3
Early afternoon (2pm-4pm) 1,033 17.1
Afternoon/early evening (4pm-
7pm)
1,091 18.1
Evening (7pm-midnight) 1,560 25.9
Overnight 270 4.5
Don’t know 2236 37.1
Table 19c: SUNDAY - When do you normally listen to Podcasts?
Sample size = 317 ‘000s %
Base = All Podcast users 6,031 100%
Early morning (6am-9am) 334 5.5
Mid morning (9am-12pm) 786 13.0
Lunchtime (12pm-2pm) 587 9.7
Early afternoon (2pm-4pm) 830 13.8
Afternoon/early evening (4pm-
7pm)
911 15.1
Evening (7pm-midnight) 1,551 25.7
Overnight 240 4.0
Don’t know 2,550 42.3
18. - 17 -
For most people, the freedom to listen when they want is perceived as the main
benefit of Podcasts, with almost 60% citing this as their top answer and a total of
91% including it in their top 3 benefits. Being able to hear radio shows that they
have missed is the second biggest benefit – almost a quarter mentioned this as
their main reason. Sound quality was not considered to be a benefit, nor was the
ability to share programme content with friends – only 7% and 6% respectively
counted these factors among the benefits.
Table 20: What are the 3 main benefits of downloading Podcasts for you?
Main Benefit All Mentions
Sample size = 317 ‘000s % ‘000s %
Base = All Podcast users 6,031 100% 6,031 100%
I can listen when I want 3,448 57.2 5,464 90.6
I can hear shows I missed on the radio 1,352 22.4 4,398 72.9
I can transfer files to a portable device 776 12.9 3,168 52.5
I can listen more than once 118 2.0 1,347 22.3
I can collect audio for listening in future 107 1.8 977 16.2
I can fast forward & rewind the programme 87 1.4 1,522 25.2
Good sound quality 0 0 449 7.4
I can share them with friends 0 0 338 5.6
19. - 18 -
Deleting and Unsubscribing
A Podcast differs from a standard audio file for its use of RSS (Really Simple
Syndication) feed technology. This means that once a Podcast has been
subscribed to, and until the recipient decides to unsubscribe, subsequent episodes
will be flagged and in most cases automatically delivered to the Podcast
subscriber.
A majority of Podcast users (57.5%) said that they normally delete the file after
they have listened to a Podcast.
Table 22: After listening to a Podcast, do you normally delete it?
Sample size = 317 ‘000s %
Base = All Podcast users 6,031 100%
Yes 3,465 57.5
No 2,373 39.3
Don’t know 193 3.2
Asked why they might keep some Podcasts after they have listened, the two
biggest answers were to listen to them again in the future, and to keep a
collection.
Table 23: Why do you normally keep at least some Podcast
episodes?
Sample size = 133 ‘000s %
Base = All who do not delete 2,566 100%
To listen to them again in the
future
1,590 62.0
To keep a collection 852 33.2
To send to friends 100 3.9
To edit/use audio for own
purposes
75 2.9
Almost half of the sample have never unsubscribed from a Podcast.
Table 24: Have you ever unsubscribed from a Podcast?
Sample size = 317 ‘000s %
Base = All Podcast users 6,031 100%
Yes 2,922 48.4
No 2,719 45.1
Don’t know 389 6.5
20. - 19 -
Those that have unsubscribed were asked why they had done so. The majority of
responses indicate a lack of commitment or interest, with more than half saying
they got bored with it, and 30% losing interest in the subject. 50% simply
couldn’t find time to listen.
Table 25: Why did you unsubscribe from a Podcast?
Sample size = 153 ‘000s %
Base = All who have unsubscribed 2,922 100%
I got bored of the content 1,516 51.9
I couldn’t find time to listen 1,475 50.5
No longer interested in subject 865 29.6
Podcast was not updated often
enough
613 21.0
Quality was not good enough 193 6.6
Podcast was too short / too long 134 4.6
I ran out of hard disk space 121 4.1
Over 70% say they listen to just as much live radio as before they started
listening to Podcasts. Only 10% said that they listen to less live radio, with 15%
claiming they now listen to more.
Table 26: Since you started listening to Podcasts, how would
you say your live radio listening habits have changed?
Sample size = 317 (‘000s) (%)
Base = All Podcast users 6,031 100%
I now listen to…
(5) …much more live
radio
334 5.5
(4) …more live radio 562 9.3
(3) …just as much as
before
4,328 71.8
(2) …less live radio 488 8.1
(1) …much less live radio 124 2.1
Mean score out of 5 3.08
21. - 20 -
Almost 40% of Podcast users say that they now listen to radio programmes that
they didn’t previously listen to as a result of downloading Podcasts.
Table 27: Has listening to Podcasts changed how much recorded
music you listen to?
Sample size = 317 (‘000s) (%)
Base = All Podcast users 6,031 100%
I now listen to…
(5) …much more music 312 5.2
(4) …more music 638 10.6
(3) …just as much as
before
4047 67.1
(2) …less music 684 11.3
(1) …much less music 74 1.2
Mean score out of 5 3.07
Furthermore, Podcasts have encouraged people to spend more time listening to
their mp3 players – 43% listen just as much as before, while another 43% listen
more. Only 3% claim to now listen to their mp3 player less.
Table 28: Has listening to Podcasts changed how much time you
spend listening to your mp3 player?
Sample size = 317 (‘000s) (%)
Base = All Podcast users 6,031 100%
I now listen to my mp3
player…
(5) …much more 919 15.2
(4) …more 1,677 27.8
(3) …just as much as before 2,587 42.9
(2) …less 153 2.5
(1) …much less 44 0.7
Mean score out of 5 3.61
Only 188,000 people (3.1% of Podcast users) said that they had paid to subscribe
to a Podcast, and only 1 million (16.7% of Podcast users) said that they would
ever be willing to pay for any.
22. - 21 -
Asked to think about how Podcasts might be paid for in future, there was some
interest in advert-sponsored content, with more than half (53.2%) of Podcast
users expressing interest.
Table 29: In the future, how interested would you be in
downloading a free Podcast containing adverts?
Sample size = 317 (‘000s) (%)
Base = All Podcast users 6,031 100%
Very interested 996 16.5
Quite interested 2,213 36.7
Not very interested 1,349 22.4
Not interested 1,137 18.9
Don’t know 336 5.6
However, there was far less interest in paid-for Podcasts, even without
advertising. Only 31% answered positively, with almost 60% saying they had
little or no interest.
Table 30: In the future, how interested would you be in
downloading a paid-for Podcast but without adverts?
Sample size = 317 (‘000s) (%)
Base = All Podcast users 6,031 100%
Very interested 470 7.8
Quite interested 1,411 23.4
Not very interested 1,569 26.0
Not interested 2,024 33.6
Don’t know 557 9.2
23. - 22 -
Respondents were asked if they thought they would download more Podcasts if
they could contain full-length music tracks. (Currently, music right holders
greatly limit what music can be used on Podcasts, which leads to music being
removed altogether from the majority of radio programmes made available as a
Podcast.) There was significant interest (66%) in such Podcasts if they were free,
but support slipped away dramatically (down to 10.7%) at the prospect of having
to pay for them. Interestingly, over a quarter of Podcast users didn’t know if they
would pay for such music content or not.
Table 31: If Podcasts could contain music, would you download more?
Sample size = 317 (‘000s) (%)
Base = All Podcast users 6,031 100%
If they were free…
Yes 3,912 64.9
No 1,313 21.8
Don’t know 806 13.4
If you had to pay a fee…
Yes 411 6.8
No 3,878 64.3
Don’t know 1,743 28.9
24. - 23 -
Finally we asked respondents to quantify how much time they had spent last
week on each of the online listening activities.
Of those who listen live to the radio online, 56% spent less than one hour doing
so in the previous week. Taking the mid-point estimate, the average time spent
in the last week is just under 80 minutes.
Table 32a: Duration of use last week - Listen live to radio programme
online
Listen live users
(sample size = 608)
‘000s %
Base: 10,940 100%
Not at all 2,914 26.6%
Less than 30 minutes 1,795 16.4%
30 minutes to an hour 1,452 13.3%
1-2 hours 1,719 15.7%
2-3 hours 940 8.6%
3-5 hours 649 5.9%
More than 5 hours 894 8.2%
Don't know 576 5.3%
Average minutes taking mid point
(without “don’t know”)
78.3 mins
25. - 24 -
Of those who use Listen Again facilities, 48% spent less than thirty minutes doing
so in the previous week and the average time spent in the last week is just over
50 minutes.
Table 32b: Duration of use last week - Listen Again to a radio
programme online
Listen Again users
(sample size = 532)
‘000s %
Base: 9,260 100%
Not at all 3,055 33.0%
Less than 30 minutes 1,422 15.4%
30 minutes to an hour 1,962 21.2%
1-2 hours 1,490 16.1%
2-3 hours 485 5.2%
3-5 hours 176 1.9%
More than 5 hours 335 3.6%
Don't know 335 3.6%
Average minutes taking mid point
(without “don’t know”)
51.5 mins
26. - 25 -
Of those using Personalised Online Radio services, 64% spent less than 30
minutes doing so and the average time spent in the last week is just under 40
minutes.
Table 32c: Duration of use last week – Personalised Online Radio
POR users
(sample size = 106)
‘000s %
Base: 2,070 100%
Not at all 993 48.0%
Less than 30 minutes 331 16.0%
30 minutes to an hour 209 10.1%
1-2 hours 295 14.3%
2-3 hours 82 4.0%
3-5 hours 44 2.1%
More than 5 hours 41 2.0%
Don't know 75 3.6%
Average minutes taking mid point
(without “don’t know”)
38.1 mins
27. - 26 -
Of those using Podcasts, 63% spent less than an hour doing so and the average
time spent in the last week is just over an hour (63.2 minutes).
Table 32d: Duration of use last week – Podcasts
Podcasts users
(sample size = 317)
‘000s %
Base: 6,031 100%
Not at all 1,598 26.5%
Less than 30 minutes 1,042 17.3%
30 minutes to an hour 1,138 18.9%
1-2 hours 1,182 19.6%
2-3 hours 514 8.5%
3-5 hours 236 3.9%
More than 5 hours 227 3.8%
Don't know 94 1.6%
Average minutes taking mid point
(without “don’t know”)
63.2 mins
Extrapolating each of the average minutes on the total adult 15+ population, we
can gauge the relative importance of each of the internet listening activity
covered by this survey. Listen Live is the most popular activity with an average
listening time of 12.5 minutes, and POR is still a marginal activity with only 0.8
minutes spent by UK adults in the last week.
Table 33: Average minutes in the last week for
each type of internet listening activity
All Adults 15+
Base (000s): 50,344
Listen Live
12.5 mins
Listen Again 6.3 mins
POR 0.8 mins
Podcasts 5.6 mins