
Recomendados
Mais conteúdo relacionado
Mais procurados
Mais procurados (20)
Destaque
Destaque (13)
Semelhante a Improving SMT Equipment Utilization
Semelhante a Improving SMT Equipment Utilization (20)
Último
Último (20)
Improving SMT Equipment Utilization
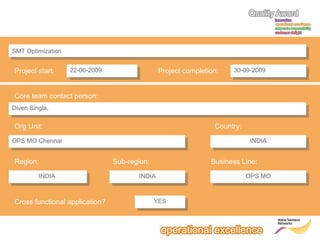
- 1. SMT Optimization SMT Optimization Project start: 22-06-2009 22-06-2009 Project completion: 30-09-2009 30-09-2009 Core team contact person: Diven Singla, Diven Singla, Org Unit: Country: OPS MO Chennai OPS MO Chennai Region: INDIA INDIA Cross functional application? INDIA INDIA Sub-region: Business Line: INDIA INDIA YES YES OPS MO OPS MO
- 2. Team member details List of team members: Vinod Philip, OPS MO MS, Vinod Philip, OPS MO MS, Vasudevan Subramani, OPS MO MS, Vasudevan Subramani, OPS MO MS, Ramani R, OPS MO Planning, Ramani R, OPS MO Planning, Sivaraman B, OPS MO MEX, Sivaraman B, OPS MO MEX, Vivek Lobo, OPS MO MS, Vivek Lobo, OPS MO MS, Mohalingam, OPS MO MS, Mohalingam, OPS MO MS, Revathy K, OPS MO (Operator-Production) Revathy K, OPS MO (Operator-Production) Kokila K, OPS MO (Operator-Production) Kokila K, OPS MO (Operator-Production) Deepika, OPS MO (Operator-Production) Deepika, OPS MO (Operator-Production) Sasikala, Ops MO (Operator-Production) Sasikala, Ops MO (Operator-Production)
- 3. Executive Summary (10%) SMT Optimization OBJECTIVE Improve Capacity Utilization from 35% to >65% on high value (5mill €) SMT Equipment in Chennai Derive clear & tangible sub-objectives & translate into execution roadmap APPROACH Drive Simplicity in process & minimize Non Value Add activities Win Together through involvement of people & enable empowerment at root. RESULTS Equipment Utilization : 35.2% to 84.5% Cost Benefit (2 lines p.a.) : 336K€* Step impact upon process yields : 79.2% to 85.1% Consumable cost saving p.a. : 50K€ SMT component attrition/scrap : 0.9% to 0.08% Improved Health & Safety and morale of SMT Team * Based upon P9 benefit of 28K€ over and above 65% utilization FUTURE IMPACT Horizontal deployment of best practice across future SMT investments. Project enabled effective utilization of 3rd SMT Line(2.2 mill €) from installation Continued cost benefit p.m. across future expansions(through better utilization, reduced component scrap rate & consumable costs)
- 4. Approach (20%) SMT Optimization Project -1 Set up Time Line-1<15 min Line-2<20 min Utilization >65 % Project-4 Eqpt. Breakdown Time Line-1<3% Line-2<3% Vinod, V asu, K annan, Moha, Vivek Common Goal Tangible Objectives Project-2 No. of Setups Line-1<21 Line-2<21 ni am, aling oh la d, M Koki Vino a s u, k, V Vive Line-1<6.3% Line-2<6.3% Project-5 Maintenance Time Line-1 <2.4% Line-2 <2.4% n Project-3 Speed Loss Line-1 <5% Line-2 <5% V in od , D ee S a s p i ka i , M ,D o ive ha, n Main project translated into 6 sub-projects with clear and tangible objectives for cross functional teams u, Di ve ama enthil, R Diven, S il, th su n a Se , V i, d as ino ,S V la a, i ok pik Project-6 K e e Other Stops D Vino d, Va s Team Engagement
- 5. Approach (20%) SMT Optimization Project Constraint Counter Approach Very little / No data available for analysis Constraint Management • Established model to determine target KPI • Implementation of measurement systems • Implement obvious & quick gainers Operator absenteeism in SMTDifficulty in implementation & sustaining improvements • Operator Independent improvements • Reduce operator Inter-dependence • Multi-skilling & empowerment on critical activities Adequate availability of skilled operators • Simplification of processes/activities • Formation of Core team for each project- Agreement on targets • Brainstorming sessions & mind mapping for each project & each stage Project Framework • Standardized templates for communicating actions, tracking progress, recording improvements & effects. • Risk & constraint management through brainstorming & feedbacks from practical implementation activities. • Weekly monitoring & reporting of project milestone results.
- 6. Deployment (20%) SMT Optimization Project 1: Setup Time<15 min Common Setups, Optimised reflow profile PCBs labeling and loading made offline Setup tools moved closer to working area Dedicated stackers for volume products Ergonomic Trolley for stacker loading Operators empowered to verify own work Project 2: No. of Setup Changes < 21 Production sequence optimized Batch size for weekly demands defined Buffer definition/stackers for volume products Project 3: Speed/Efficiency Loss Component attrition rate/scrap reduction Easy to use Splicing Tool Project 4: Eqpt. Breakdown Time < 3% System for tracking breakdown times Work model for effective closure of issues Periodic meetings with all suppliers Training/Multiskilling for all technicians Level-1& 2 spare ordering & management Key service agreements in place Project 5: Preventive Maintenance Time<2.4% Operator involvement in maintenance activities Maintenance during production breaks Some maintenance activities made offline Project 6: Other Stops Optimize cleaning paper size for all products Bigger reel sizes for major components Eliminated Non VA activities -1675 min/wk/line Operator Wait Time reduced by -1043 min/wk/line Online activities taken offline -1162 min/wk/line Consumables Cost Savings - 50K€ p.a.
- 7. Results (50%) SMT Optimization SMT UTILIZATION 125 Avg Line 1 UTILIZATION. 105 Target Line 2 85 65 45 25 P6 P7 P8 P9 P10 P11 Period Line 2: Average Set up Time 50 50 C/O Time 40 Avg. Set Up Time Average Set up Time Line-1: Average Set Up Time 30 20 10 0 27 28 29 30 31 32 33 34 35 36 37 38 39 40 41 Week No. C/O Time 40 30 20 10 0 28 29 30 31 32 33 34 35 36 Week No. 37 38 39 40 41 42
- 8. Results (50%) SMT OPTIMIZATION Component Attrition/Scrap Value 0.8 Rate 0.6 0.4 0.2 0 P7 P8 P9 P10 8000 7000 6000 5000 4000 3000 2000 1000 0 Value(Euros) Rate (%age of components placed) 1 P11 Financial benefits are as summarized in the executive summary Period % Equipm ent Dow ntim e 6 5 4 3 2 1 0 Line 1 P5 P6 P7 P8 Line 2 P9 P10 Target P11
- 9. Best Practice (bonus points) SMT OPTIMIZATION When planning your project, did you utilize previous lessons learnt or other Good Practices from external sources? If yes, how did you locate them? Past experience in the industry was beneficial in implementing some good practice actions. The planning and the mathematical model were developed based upon local constraints. What are the key learning from this project to you and your project team/ unit? What made you different? The team learnt and experienced that ambitious and sustainable results can be achieved only through systematic, structured and focussed team approach. Why do you think that your project could serve as a Good Practice example for others within NSN? This project demonstrates how best results can be achieved. Many manufacturing practices are new and can be adopted across sites to simplify processes. Has your project solution/ approach already been used as inspiration for another project? Or are you aware if a similar approach or solution has been adopted elsewhere in NSN due to your Good Practice communication? Best practices that came out of the project have been successfully implemented on 3rd SMT line enabling quick ramp up. What has been your and/or the team's specific contribution in communicating / sharing and supporting the adoption and usage of this best practice in the other projects? Some key cost saving ideas like consumable cost reduction have been shared with the NSN Board Assembly community.
- 10. Best Practice (bonus points) SMT OPTIMIZATION When planning your project, did you utilize previous lessons learnt or other Good Practices from external sources? If yes, how did you locate them? Past experience in the industry was beneficial in implementing some good practice actions. The planning and the mathematical model were developed based upon local constraints. What are the key learning from this project to you and your project team/ unit? What made you different? The team learnt and experienced that ambitious and sustainable results can be achieved only through systematic, structured and focussed team approach. Why do you think that your project could serve as a Good Practice example for others within NSN? This project demonstrates how best results can be achieved. Many manufacturing practices are new and can be adopted across sites to simplify processes. Has your project solution/ approach already been used as inspiration for another project? Or are you aware if a similar approach or solution has been adopted elsewhere in NSN due to your Good Practice communication? Best practices that came out of the project have been successfully implemented on 3rd SMT line enabling quick ramp up. What has been your and/or the team's specific contribution in communicating / sharing and supporting the adoption and usage of this best practice in the other projects? Some key cost saving ideas like consumable cost reduction have been shared with the NSN Board Assembly community.
Notas do Editor
- Note: Please fill in the complete organization description In case of cross functional teams, fill in the org unit and country of the contact person. Org unit of the other team members, please state it in the team member list.
- Note: Please list all team members who were actively involved in the project. For lager teams, please copy this slide. In case of winning the award, this team size will be considered to share price.
- The Executive Summary is limited to one page. The Executive summary will be assessed along the following questions: How clear are the Objectives / Scope described? How clear is the general Approach described? How clear are the achieved Results described? How clear is the possible Future Impact described? How clear have the key messages been communicated within the targeted organization / outside project? How clear did the executive summary reflect the content of the application? NOTE: In case your project will be selected for the finals, only this executive summary slide will be delivered to the Grand Jury. So please ensure that you present the most relevant accomplishments here.
- The Approach section is limited to two pages. The Approach section will be assessed along the following questions: Evaluate the included financial business case calculation and documented framework (e.g. clear baseline, SMART targets, assumptions,…) Evaluate the set-up of the main Project & Quality Management methods and tools within the project. (e.g. key milestone plan, resource plan, Six Sigma...) How well were the roles & responsibilities of project team and steering group defined and communicated within the involved stakeholder groups? Evaluate how well the project involved the stakeholders/customer in the approach phase? How well has risk management been set up?
- The Approach section is limited to two pages. The Approach section will be assessed along the following questions: Evaluate the included financial business case calculation and documented framework (e.g. clear baseline, SMART targets, assumptions,…) Evaluate the set-up of the main Project & Quality Management methods and tools within the project. (e.g. key milestone plan, resource plan, Six Sigma...) How well were the roles & responsibilities of project team and steering group defined and communicated within the involved stakeholder groups? Evaluate how well the project involved the stakeholders/customer in the approach phase? How well has risk management been set up?
- The Deployment section is limited to one page. The Deployment section will be assessed along the following questions: How well was the project progress tracked, measured and communicated (e.g. business case, milestones,…)? Evaluate, if Results and Deployment are in line with original Approach How well has risk management been performed throughout the project? How well have the stakeholder/customer interfaces (e.g. communication / escalation path, feedback loop) been utilized? How well was the team work approach / plan deployed & acted upon?
- The Results section is limited to two pages. The Results section will be assessed along the following questions: Evaluate the overall impact/ value of the project, for each of the following aspects: Financial impact Customer benefit and/or Stakeholder benefit NSN processes / 'way we work' Corporate responsibility aspects (Environment and/or External community & Society and/or Employees) Innovation New business opportunities How big was the improvement compared to internal and/or external references (competitors, previous performance)? Do the metrics / figures clearly show a positive trend from project start to project end, current status of the project or towards future
- The Results section is limited to two pages. The Results section will be assessed along the following questions: Evaluate the overall impact/ value of the project, for each of the following aspects: Financial impact Customer benefit and/or Stakeholder benefit NSN processes / 'way we work' Corporate responsibility aspects (Environment and/or External community & Society and/or Employees) Innovation New business opportunities How big was the improvement compared to internal and/or external references (competitors, previous performance)? Do the metrics / figures clearly show a positive trend from project start to project end, current status of the project or towards future
- The Best practice section is limited to one page. Please state your answers directly in the respective cells of the table given on the Best Practice page of the application! In this case, a font size of 12pt is permitted!