SlideShare uma empresa Scribd logo
1 de 22
Determinants of Productivity among Senior Citizens in Marikina City
                          Ines Alcantara-de Guzman, PhD

                                    ABSTRACT

        This exploratory study was conducted to identify the variables that are
possible determinants of productivity among senior citizens in Marikina City and to
develop a productivity-scoring instrument. The respondents were 354 male and
female senior citizens aged 60-79 from Barangka and Concepcion Uno/Tumana,
Marikina City. Data gathering was done using a researcher-made survey
questionnaire, which consisted of three parts of combined checklist and fill-in type
questions. Results show that only life activities such as walking, managing money,
shopping for own groceries/personal items, using public transportation, cooking,
home decorating, ironing, caring for infants/children, washing clothes using washing
machine, washing clothes by hand, and washing the dishes are the only specific
indicators based on Havighurst’s paradigm that predict productivity among senior
citizens. Two models of productivity were developed based on the results. The first
model is a 14-Predictor Productivity Model which includes 14 variables such as
employment status, preparation for old age, walking, managing own money, shopping
for groceries/ personal items, riding public transport, washing clothes using washing
machine, washing clothes by hand, washing the dishes, and volunteer work. The
second model is an 11-Predictor Productivity Model, which includes all the variables
in the 14-Predictor Productivity Model except employment status, preparation for old
age, and volunteer work. Productivity-scoring instruments were formulated for these
two models using the questions on the research questionnaire. The focus group
discussion composed of 20 participants validated the findings of the study.

                                 INTRODUCTION

        In the face of changing times and greater emphasis on high productivity, there
seems to be a tendency to regard senior citizens as unproductive and generally as
burden to others. Although it is not obligatory for those under 60 or 65 years old to
leave the work force because of mandatory requirements, they are usually seen as
ineffective or unprepared to handle new tasks brought about by modernization and
technology. They are also victims of outright discrimination when seeking work
because employers prefer younger persons.
        The most serious difficulties from which the senior citizens suffer are
economic in nature. Because of reduced income or lack of it, a high percentage of
senior citizens are living near or below the poverty level. Retirement plans are
generally inadequate and inflation becomes their serious problem. Many of them do
not have access to adequate health services (Ogena, 2006) and once they enter the
retirement age, it is hard for them to get health insurance because of age limit and
prevailing costs (Weller, Wenger, and Gould, 2004).
        This concern over the plight of the senior citizens is an aftermath of the
increasing number of older persons 60 years old and above. Although still a young
population compared with other age groups, the National Statistics Office (NSO) has
reported a notable increase in their number. Based on its March 18, 2005 Special
Release, the total number of senior citizens 60 years old and above has reached 4.6
million, accounting for 5.97 percent of the country’s population of 76.5 million. It
means a 22.18 percent increase from 1995 (3.7 million persons) and an average


                                          1
annual population growth rate of 4.39 percent during the 1995 to 2000 period. If this
growth rate continues, the number of senior citizens is expected to reach seven million
in 2010 and to double in approximately 16 years (NSO, 2005). Such scenario may
result to having the “young old” (60-69 years old) taking care of the “old-old” (70-79
years old).
         Many of the retired senior citizens continue to work in both formal and
informal labor sectors according to their capacities and preferences. Studies
conducted show retirees who are employed fulltime with an average of 40 hours per
week (Cabigon, 1996 and NSO, 2005). These are indications that the senior citizens
are still capable of productive endeavors. Hence, this study focused on accomplishing
the following objectives:
         1. to describe the socio-demographic and health profile of senior citizens in
             Marikina City;
         2. to identify the variables that are possible determinants of productivity
             among senior citizens in Marikina City; and
         3. to develop a productivity scorecard for senior citizens.

                                   METHODOLOGY

         This study is an exploratory research, which made use of a researcher-made
questionnaire as the survey technique combined with face-to-face interview. A
qualitative element in the form of a focus group discussion (FGD) was also used to
complement the quantitative analysis performed on the survey responses.
         The respondents were male and female 60-79 years old senior citizens from
two barangays representing the two districts of Marikina City: Barangka of District 1
and ConcepcionUno/Tumana of District II. These two barangays were the most
populous among the barangays in the two districts and they have the highest number
of senior citizens. Barangka is the first of nine barangays in District 1 with 1,277
registered senior citizens while Concepcion Uno/Tumana is the third of five
barangays in District II, with 2,917 registered senior citizens (Sira, 2006). A Focus
Group Discussion (FGD) was conducted among 20 participants, who were not among
the respondents, to validate the data gathered from the research respondents.
         The data gathered was encoded in MSExcel, processed and analyzed using the
Statistical Package for the Social Sciences (SPSS). Graphical, tabular representations
as well as summary statistics were used in the presentation of the sociographic,
demographic, and health profile of the respondents. Cluster analysis was utilized to
determine the number used to classify the senior citizens into groups such that none in
the same cluster have similar characteristics. The particular criterion used for
clustering was the Ward method. In this method, the clusters that were fused at each
stage in the agglomeration process were such that their merger gave the minimum
possible increase in the within-cluster variation, which was an assurance of
homogeneity within the newly formed cluster. The Dendogram is a graphical
illustration of the groupings. It was used to generate two groups of respondents based
on 25 variables - the “productive” and “non-productive” senior citizens.
         Logistic regression analysis was also used to determine which among the 25
variables were predictors of productivity among the respondents. It was used to
generate the productivity scoring for senior citizens. The score was actually a
probability of being “productive” based on the estimated model as follows:
                                                    1
        P (" Pr oductive" ) =
                                           ˆ + β X + β X + ... + β X )}
                                1 + exp{−( β0  ˆ      ˆ          ˆ
                                                1 1     2 2        25 25


                                           2
The estimated quantities β , β ,..., β were the coefficients of regression. The
                           ˆ
                             0
                               ˆ
                                1
                                      ˆ
                                        25

variables X1, X2,..,X25 were the dichotomous characteristics (1=present, 0=absent)
listed below.
              X1 = Head of the Family
              X2 = Employed
              X3 = Income
              X4 = Prepared for old age
              X5 = Dressing
              X6 = Eating
              X7 = Bathing
              X8 = Walking
              X9 = Light Chores
              X10 = Managing Own Money
              X11 = Preparing Own Meal
              X12 = Shopping for Groceries
              X13 = Riding a Public Transport
              X14 = Cleaning the House
              X15 = Cooking
              X16 = Home Decorating
              X17 = Ironing Clothes
              X18 = Caring for Children
              X19 = Washing Clothes (by washing machine)
              X20 = Washing Clothes (by hand)
              X21 = Washing the Dishes
              X22 = Health Status (Perceived)
              X23 = Organization (Membership)
              X24 = Volunteer Work
              X25 = Productive (Perceived)

        After all 25 variables were fitted, backward deletion of non-significant
variables was performed to arrive at the best subset of characteristics that would most
likely separate “productive” and “non-productive” individuals. Cluster analysis was
used to determine the number used to classify the senior citizens into groups such that
none in the same cluster have similar characteristics. Each cluster thus described, in
terms of the data collected, the class to which its members belonged; and this
description may be abstracted through use from the particular to the general class or
type. The particular criterion used for clustering was the Ward method. Here, the
clusters that were fused at each stage in the agglomeration process were such that
their merger gave the minimum possible increase in the within-cluster variation,
which was an assurance of homogeneity within the newly formed cluster.

                             RESULTS AND DISCUSSIONS

Profile of Respondents

       Majority of the respondents were 60-69 years old, females, married,
elementary level or elementary graduates, laborers, living with spouses and their
children, and heads of families (Table 1).


                                          3
Table 1. Demo-Sociographic Profile of Respondents (N=354)


            Variable          Category                      Frequency   Percentage
                              60-69                             193         54.50
    Age
                              70 and above                      161         46.00
                              Female                            249         70.30
             Gender
                              Male                              105         29.70
                              Married                           184         52.00
                              Widow/Widower                     147         41.50
           Civil Status
                              Single                             17          4.80
                              Separated                           6          1.70
                              Elementary level/Graduate         173         48.90
                              High School Level/Graduate         77         21.80
                              College Units/Graduate             53         15.00
     Educational Attainment
                              Voc Tech/College Level             37         10.50
                              No Formal Schooling                11          3.10
                              Graduate Degree                     3          0.80
                              Living with spouse/children       128         36.20
                              Living with child/children        127         35.90
      Living Arrangement      Living with spouse                 43         12.10
                              Living alone                       28          7.90
                              Living with other relatives        28          7.90
                              Laborer                            46         19.66
                              Shoemaker                          41         17.52
                              Professional                       32         13.68
                              Service Worker                     26         11.11
                              Manager/Supervisor                 21          8.97
                              Clerk                              12          5.13
                              Sales Worker                       11          4.70
                              Machine Operator                    7          2.99
                              Vendor                              6          2.56
                              Technician                          4          1.71
   Occupation Upon Retirement Store Owner/Operator                4          1.71
                              Farmer                              4          1.71
                              Underwriter                         3          1.28
                              Unskilled Worker                    1          0.43
                              Shop Worker                         1          0.43
                              Fisherman                           1          0.43
                              Corporate Executive                 1          0.43
                              Carinderia                          1          0.43
                              Corporate Executive                 1          0.43
                              Unskilled Worker                    6          2.56
                              No Data                             5         14.71
                              Living with Spouse/Children       128         36.20
                              Living with Child/Children        127         35.90
      Living Arrangement      Living with Spouse                 43         12.10
                              Living alone                       28          7.90
                              Living with Other Relatives        28          7.90
                              Yes, Head of the Family           190         53.70
       Head of the Family
                              No, Not Head of the Family        164         46.30
Health Status and Physical Well-Being


                                            4
Majority of the respondents were non-smokers and non-drinkers of alcoholic
beverages; have poor vision; went to the city’s government hospital for medical
attention; assessed their health condition as good to excellent; and spent their leisure
time watching television and listening to music (Table 2).

     Table 2. Health Status and Physical Well-Being of Respondents (N=354)

          Variable           Category                                Frequency   Percentage
                             No, I don't smoke                           313         88.40
       Smoking Patterns
                             Yes, I smoke                                 41         11.60
                             No, I don't drink alcoholic beverages       317         89.50
      Drinking Patterns
                             Yes, I drink alcoholic beverages             37         10.50
                             Poor Vision                                 199         56.21
                             Poor Hearing                                 51         43.80
                             Arthritis                                   106         30.00
                             Hypertension                                 84         23.90
                             Cataract                                     51         14.41
                             Heart Disease                                37         10.45
        Health Status*       Asthma                                       20          5.65
                             Kidney Problem                               18          5.08
                             Osteoporosis                                 17          4.80
                             Pulmonary Disease                            11          3.11
                             Ulcer                                        10          2.82
                             Emphysema                                     3          0.85
                             Glaucoma                                      2          0.56
                             Government Hospital                         141         39.80
                             Health Center                               130         36.70
    Medical Facility Used*   Private Clinic                               65         18.40
                             Private Hospital                             41         11.60
                             Home                                         41         11.60
                             Good to Excellent                           264         74.60
 Perceived Health Assessment
                             Poor to Fair                                 90         25.40
                             Watching Television                         300         84.70
                             Listening to Music                          224         63.30
                             Needlework                                   53         15.00
                             Ballroom Dancing                             23          6.50
      Leisure Activities*    Playing Board Games                          14          4.00
                             Fishing                                       9          2.50
                             Handicrafts                                   8          2.30
                             Painting                                      4          1.10
                             Collecting items                              1          0.30
                                         *Multiple Responses

Economic Activities

        Most of the respondents were retirees and were receiving a monthly pension of
Php 4,000.00 and below. A small percentage of the respondents were employed and
were working in private companies and receiving an income of Php 4,000.00 and
below. Majority of them claimed that the monthly income they received was
insufficient for their daily needs. Most of the unemployed and non-retirees have plans
of looking for a fulltime but home-based jobs. The unemployed and non-retirees
identified several sources of income such as children, other relatives, friends, and
colleagues; rentals; farmland; financial investment; spouse’s pension; and spouse’s


                                               5
income. Most of the respondents also claimed that they prepared for their old age by
sending their children to school, a typical Filipino family value giving importance to
education as a poverty-liberating factor. Those who claimed they did not prepare for
old age pointed out some reasons such as: no extra income; it was not seen as a need;
and they were too busy to think of saving for their old age (Table 3).

                  Table 3. Economic Activities of Respondents (N=354)

            Variable                            Category               Frequency   Percentage
                                  Retired                                 174        49.20
       Employment Status          Otherwise (Unemployed/Non-retiree)      120        33.90
                                  Employed                                 60        16.90
                                  Private                                 144        62.30
      Type of Employment          Self-employed                            55        23.80
                                  Government                               32        13.90
                                  Below P4, 000                            38        63.33
                                  4,001-8,000                              13        21.67
                                  8,001-15,000                              4          6.67
  Monthly Income of Employed      15,001-30,000                             1         1.67
                                  30,001-50,000                             1         1.67
                                  50,001 and above                          1         1.67
                                  No data                                   2         3.33
                                  Below P4, 000                            97        55.75
                                  4,001-8,000                              21        12.00
                                  8,001-15,000                             10          5.75
   Monthly Pension of Retirees    15,001-30,000                             2          1.15
                                  30,001-50,000                             1          0.57
                                  50,001 and above                          0             0
                                  No pension                               43        29.71
                                  Have plans to look for work             136        46.25
                                  Fulltime                                136        46.25
                                  Part-time                               106        36.05
  Work Plans and Preferences of
                                  Undecided                                52        17.69
   Unemployed and Retirees
                                  Home-based                               88        29.93
                                  Out-of-home                              43        14.68
                                  Undecided                               163        55.44

Life Activities

        Most of the respondents could perform activities of daily life (ADLs) without
any help from other people such as: dressing up or putting on clothes, eating, taking a
bath, and walking around the house. Among the respondents, 1.4 percent expressed
difficulty in walking around the house, 13.1 percent have difficulty dressing up and
eating, while 2.5 percent have difficulty taking a bath. This could be attributed to the
fact that there are more 60 to 69 years old (young old) than the 70 years old and above
(old-old), thus younger and stronger respondents. Majority can also perform
instrumental activities of daily life (IADLs) such as doing light household chores,
managing own money, preparing own meal, shopping for own groceries/personal
items, and using public transportation.
Results also show that majority of the respondents were involved in household chores
in their own homes. In fact, they considered these household chores as their
contributions in their families (Figure 1).


                                               6
Figure 1. Engagement in Activities of Daily Living (ADL), Instrumental
                   Activities in Daily Living (IADL), and Household Chores.


        ENGAGEMENT IN ADLs                     ENGAGEMENT IN IADLs                         HOUSEHOLD ACTIVITIES


                                         Doing light                                  Cleaning the
  Walking                                                                                                              80.5
                                         household                          92.1         house
  around                       98.6
                                           w ork
the house                                                                                 Cooking                      78.0

                                         Managing                                     Washing the
                                                                     73.2
                                        ow n money                                                                 68.6
  Taking a                                                                              dishes
                        97.5
    bath
                                                                                    Ironing clothes             54.8
                                          Preparing
                                                                            92.9
                                          ow n meal                                    Washing
                                                                                                                54.8
                                                                                   clothes by hand
    Eating       96.9                 Shopping for
                                          ow n                                      Taking care of
                                                                     76.3                                  46.6
                                      groceries or                                 infants/children
                                      personal item
                                                                                          Home
 Dressing                                                                                                37.0
                                                                                        decorating
up/Putting       96.9                   Using public
                                                                       81.6
on clothes                            transportation                                     Washing
                                                                                                         36.7
                                                                                        clothes by


    Volunteer Work

            Volunteer work is a valuable and productive way for older people to stay
    engaged in society, to use their expertise, maintain, and nourish their sense of
    purpose, their innate value and their self-respect, which results in greater
    independence, health and well-being for older people (WHO, 2002). The results of
    this study show that most of the respondents (55.9%) were not involved in volunteer
    work due to poor health (28.8%). Other reasons given were lack of time (18.1%); they
    did not know how and where (12.1%); and they lacked funds to do volunteer work
    (1.4%). Those who were involved in volunteer work joined barangay activities;
    Homeowners’ Association activities; parish activities (church choir, lector, acolyte,
    catechist, lay minister, and mother butler); feeding programs; Gawad Kalinga
    projects; livelihood programs; family counseling; and traffic enforcer volunteer
    (Figure 2).


                                Figure 2. Involvement in Volunteer Work


                                                           7
VOLUNTEER WORK PARTICIPATED IN                       REASONS FOR NO VOLUNTEER WORK

   Barangay
                                       28.2
   Activities
Homeowners'                                             Health
                             10.2                                                      28.8
 Association                                           reasons
Church choir           5.6

 Lay Minister         4.8                               Lack of
                                                                               18.1
                                                         time
      Lector      3.7
    Feeding
                 2.3
   programs
                                                       Don't
   Catechist     1.7                                 know how              12.1
   Livelihood                                        and where
                 1.7
   programs
    Family
                 1.7                                  Lack of
  counseling
      Mother                                         necessary      2.8
                1.1
       Butler                                          skills
      Gawad
                0.8
      Kalinga
      Traffic
                0.8                                     Lack of
    Enforcer                                                       1.4
                                                         funds
     Acolyte    0.6


 Membership in Organizations

          Havighurst (1964) noted that establishing an explicit affiliation with one’s age
 group is one task of the elderly. It involves accepting one’s status in the community
 and becoming an active participant in one’s age group. Ageing slows down a person,
 such that it is now quite impossible for senior citizens to keep up with activities done
 in their younger years, thus they resort to giving up these activities. In this study, most
 of the respondents (63.3%) were members of organizations such as: church
 organizations, Homeowners/Neighborhood Association, Kababaihan, Civic Clubs,
 Samahang Caretakers, Senior Choir, Marikina Riverpark Runners, Loyola Civic
 Organizations, Senior Citizens’ Association, and Women’s Clubs. The senior citizens
 looked at membership in organizations as their chance to relate with other people
 especially those of their own age.

 Community Involvement

         Havighurst (1964) also added that one task of later maturity is meeting social
 and civic obligations. He said that older people are involved in the conduct of civic
 and political affairs both as citizens and office holders. In this study, the senior
 citizens were asked to identify top five problems in their respective communities. The
 results show that majority (66.6%) of the respondents considered unemployment
 problems as the number one problem followed by security (41.4%), substance abuse
 (33.1%), pollution (30.6%) and illiteracy (21.5%). They also identified some personal


                                              8
contributions to lessen these problems such as reporting incidents to authorities
(63.2%), participating actively in community affairs (49.9%), becoming a more
vigilant community member (34.3%), and conducting skills development programs
(23.7%). Their knowledge about societal problems and what they could do to help
solve these problems were clear indications of their desire to take part in community
affairs (Table 4).

            Table 4. Community Involvement of the Respondents (N=354)

Variable                     Category                                      Frequency   Percentage
                             Unemployment                                      235         66.6
                             Security                                          146         41.4
                             Substance abuse                                   117         33.1
                             Pollution                                         100         30.6
    Community Problems*      Crime and Violence                                 76         21.5
                             Illiteracy                                         76         21.5
                             Juvenile delinquency                               57         16.1
                             Child Abuse                                        36         10.2
                             Immorality                                         35          9.9
                             Report incidents immediately to authorities       223         63.2
    Possible Contributions   Participate actively in community affairs         176         49.9
       of Respondents*       Become a more vigilant community member           121         34.3
                             Conduct skills development program                 73         23.7
                                      Multiple Responses*

Perceived Productivity

        Majority of the respondents (85.9%) claimed that they are productive. This
personal assessment supports the argument that senior citizens are still at the height of
their productivity and their desire to continue being a resource for their families and in
the community where they belong.

“Productive” and “Non-Productive” Respondents

        Using Cluster Analysis, 25 variables were chosen from the questionnaire and
were tested using Statistical Package for the Social Sciences (SPSS). The objective
was to group the respondents into “productive” and “non-productive” based on the
chosen variables. The Dendogram showed two major clusters of respondents: the
“productive” and the “non-productive” clusters. Results also show that almost an
equal number of respondents were labeled as “productive” and “non-productive”
(Figure 3), which did not cohere to the respondents’ actual perception of themselves.
Thus, the results of the Cluster Analysis was only one way of classifying the senior
citizens based on the variables chosen. However, the perceived productivity of the
respondents based on their own personal assessment, which includes their capabilities
cannot be ignored as another way of grouping them.


           Figure 3. “Productive” and “Non-Productive” Respondents Based
                                  on the 25 Variables


                                              9
Variables                             PRODUCTIVE VS NON-PRODUCTIVE


       Head of the family                                     46%   62%
       Employed                                               21%   13%
       Income                                                 38%   38%
       Prepared for old age                                   78%   65%
       Dressing                                              100%   94%
       Eating                                                100%   94%
       Bathing                                                99%   95%
       Walking                                                99%   98%
       Light Chores                                           98%   86%
       Managing Own Money                                     89%   57%
       Preparing Own Meal                                     99%   86%
       Shopping for Groceries                                 94%   57%
       Riding a Public Transport                              94%   68%
       Cleaning the House                                     98%   62%
       Cooking                                                96%   59%
       Home Decorating                                        60%   13%
       Ironing Clothes                                        89%   19%
       Caring for Children                                    66%   26%
       Washing Clothes (by machine)                           50%   23%
       Washing Clothes (by hand)                              73%   36%
       Washing the Dishes                                     93%   43%
       Healthy (Perceived)                                    76%   73%
       Organization (Membership)                              71%   56%
       Volunteer                                              50%   38%
       Productive (Perceived)                                 91%   81%


        The groupings generated by the Cluster Analysis may lead to stereotyping the
senior citizens so that other people may see them as “non-productive”. This
stereotyping could be one of the reasons why after retirement the average senior
citizen could hardly get a second employment or if unemployed, such stereotype
makes it harder for him or her to participate in paid labor as evidenced by the
respondent’s disclosure below.

               “Dapat pantay-pantay ang pagtingin ng mga employers sa mga naghahanap ng
       trabaho matanda man o bata. Sa mga panahong ito, para bang wala nang kuwenta ang tao
       pag matanda na kasi ayaw ng tanggapin sa trabaho.”

                 (Employers should give equal chances to people looking for jobs, young or old. At
       present, it seems like senior citizens are useless because employers do not want to hire them
       anymore.)

        The results could also be supported in terms of what the Johari Window by
Joseph Luft and Harry Ingham (Yen, 1999) posits. It is one of the most useful models
describing the process of human interaction. The four-paned window divides personal
awareness into four different types represented by its four quadrants: open, hidden,
blind, and unknown. The lines dividing the four are like window shades, which can
move as an interaction progresses. The open quadrant is known to self and to others;
the blind quadrant is not known to self but known to others; the hidden quadrant is
known to self but not known to others; the unknown quadrant is not known to self and
not known to others. Hence, the perceived productivity of the respondents could be
compared to the hidden quadrant where information is known only to the self, while
the result of the Cluster Analysis could be compared to the blind quadrant where
information is unknown to the self but known to others. The Johari Window (Figure


                                               10
4) aims at increasing the open area while reducing the blind, the hidden, and the
unknown areas through feedback, disclosure, and self-discovery and mutual
enlightenment respectively. Similarly, feedback, disclosure, self-discovery, and
mutual enlightenment can be beneficial for the senior citizens and those working for
their welfare.

                   Figure 4. Productivity and the Johari Window

                                                KNOWN TO       UNKNOWN
                                                  SELF          TO SELF


                                                  OPEN           BLIND
                                                               Cluster
                  KNOWN TO OTHERS                              Analysis’
                                                               Result on
                                                               Productivity

                                                 HIDDEN        UNKNOWN
                                                 Perceived
                 UNKNOWN TO OTHERS              Productivity
                                                    of
                                                Respondents


Predictors of Productivity

        Logistic regression analysis was used to determine which among the 25
variables were predictors of productivity among the respondents. It was also used to
generate the productivity scorecard for senior citizens. The Full Model (Table 5)
shows all 25 clustering variables entering the model. Though some variables were not
significant on their own, logistic regression combined their predictive powers. From
the Full Model, deletion was done starting with health, as most geriatric studies seem
to point that this bears the least significance to the senior citizen’s productivity
followed by eating with .999 significance. From here on, deletion continued
beginning with the least significant predictor. The Full Model shows that 93.1 percent
of “non-productive” are concordantly classified by the Logistic Model and 95 percent
of “productive” are concordantly classified by the same model. The overall
classification efficiency is 94.1 percent. Thus, 94.1 percent of the respondents were
correctly identified into their respective clusters. The Classification Table a (Table 6)
with 14 variables has an effective p-value of alpha = 0.20, with 94 percent accuracy


                                           11
and a good mixture of predictors such as: employment status, preparation for old age,
walking, managing own money, shopping for own groceries, using public
transportation, cooking family meals, home decorating, ironing clothes, caring for
infants/children, washing clothes using washing machine, washing clothes by hand,
dishwashing, and doing volunteer work. The Classification Table b (Table 7) with 11
predictors was a result of further deletion of the least significant variable. As a result,
three other variables were deleted: employment status, preparation for old age, and
volunteer work, leaving only life activities as predictors of productivity.


               Table 5. Full Model Showing the 25 Clustering Variables


  Classification Table                            Logistic-Predicted
                                                                          Percentage
                                                 Productivity Group        Correct
                                              NonProductive Productive
  Productivity Cluster          NonProductive           161          12       93.0636
                                Productive                9         172       95.0276
          Overall
  Percentage                                                                  94.0678

  The cut value is .500
Variables in the
Equation
                                      B            S.E.        Wald           df        Sig.          Exp(B)
  Head of family                     -0.07360        0.55719    0.01745       1.00000    0.89491           0.92904
  Employment status                   1.63568        0.81396    4.03823       1.00000    0.04448           5.13293
  Income                              0.56825        0.60100    0.89399       1.00000    0.34440           1.76517
  Preparation for old age             1.20478        0.59663    4.07757       1.00000    0.04346           3.33604
  Dressing-up                        19.85974    7202.85698     0.00001       1.00000    0.99780   421673546.89229
  Eating                              9.32784    7202.85853     0.00000       1.00000    0.99897       11246.82413
  Bathing                            -2.03175      41.71401     0.00237       1.00000    0.96115           0.13111
  Walking                             0.98608      41.69646     0.00056       1.00000    0.98113           2.68072
  Light household chores              0.22836        1.86287    0.01503       1.00000    0.90243           1.25654
  Managing                            1.87337        0.72819    6.61851       1.00000    0.01009           6.51020
  Preparing for old age              -3.21565        1.56648    4.21391       1.00000    0.04009           0.04013
  Shopping groceries                  3.08804        0.87897   12.34281       1.00000    0.00044          21.93399
  Using public
  transportation                      1.65616       0.84654     3.82744       1.00000   0.05042            5.23916
  Cleaning the house                  0.72461       1.19682     0.36656       1.00000   0.54488            2.06392
  Cooking meals                       3.20908       0.94830    11.45183       1.00000   0.00071           24.75642
  Home Decorating                     1.11888       0.64857     2.97615       1.00000   0.08450            3.06142
  Ironing                             4.27764       0.73252    34.10116       1.00000   0.00000           72.06987
  Caring for infants/children         2.26907       0.57065    15.81079       1.00000   0.00007            9.67039
  Washing Clothes-washing
  machine                              1.51751      0.60944     6.20012       1.00000   0.01277            4.56087
  Washing clothes by hand              1.63393      0.60584     7.27355       1.00000   0.00700            5.12397
  Washing the dishes                   1.83901      0.74201     6.14251       1.00000   0.01320            6.29030
  Perceived Health                    -2.09528      0.73078     8.22071       1.00000   0.00414            0.12304
  Membership in
  organization                        0.66267       0.56741     1.36396       1.00000   0.24285            1.93997
  Volunteer work                      0.94411       0.58968     2.56341       1.00000   0.10936            2.57052
  Perceived Productivity              0.11467       0.81185     0.01995       1.00000   0.88767            1.12150


                                                  12
Constant                         -42.25201   10158.07219       0.00002         1.00000     0.99668           0.00000

                       Table 6. Classification Table with 14 Variables


Classification Table                             Logistic-Predicted
                                                                               Percentage
                                               Productivity Group               Correct
                                          NonProductive    Productive
Productivity Cluster        NonProductive               160           13              92.5
                            Productive                    9         172               95.0
Overall Percentage                                                                    93.8
The cut value is .500
Variables in the Equation
                                  B              S.E.            Wald              df        Sig.       Exp(B)
Employment Status                     1.4243            0.6753    4.4486            1.0000     0.0349       4.1549
Prepared for Old Age                  0.7588            0.5313    2.0396            1.0000     0.1532       2.1358
Walking                               4.5917            1.8519    6.1479            1.0000     0.0132     98.6625
Managing own Money                    1.9924            0.6743    8.7317            1.0000     0.0031       7.3331
Shopping for Groceries                2.4659            0.8014    9.4679            1.0000     0.0021     11.7740
Using Public
Transportation                        1.7397            0.7491      5.3938         1.0000      0.0202      5.6956
Cooking family meals                  2.4571            0.7743     10.0704         1.0000      0.0015     11.6707
Home Decorating                       1.0608            0.5535      3.6738         1.0000      0.0553      2.8888
Ironing Clothes                       3.6348            0.5710     40.5192         1.0000      0.0000     37.8941
Caring for
Infant/Children                       1.9034            0.5034     14.2962         1.0000      0.0002      6.7090
Washing Clothes by
Washing Machine                       1.2632            0.5375        5.5227       1.0000      0.0188      3.5366
Washing Clothes by
Hand                                 1.5427             0.5202      8.7955         1.0000      0.0030      4.6773
Washing the Dishes                   1.9588             0.6619      8.7569         1.0000      0.0031      7.0906
Healthy-Perceived                    0.6943             0.5054      1.8869         1.0000      0.1696      2.0022
Constant                           -19.5457             3.2775     35.5637         1.0000      0.0000      0.0000


                                                 13
Table 7. Classification Table with 11 Variables


Classification Table
Observed                                     Predicted
                                             Productivity                Percentage
                                             Group                       Correct
                                             NonProductive Productive
Productivity Cluster           NonProductive             157          16          90.8
                               Productive                  9        172           95.0
Overall Percentage                                                                92.9
The cut value is .500


Variables in the Equation
                                     B             S.E.         Wald          df         Sig.       Exp(B)
Walking                                  4.1218       1.7404      5.6088       1.0000      0.0179      61.6693
Managing Own Money                       2.0202       0.6503      9.6514       1.0000      0.0019       7.5401
Shopping for Groceries                   2.2135       0.7406      8.9321       1.0000      0.0028       9.1481
Using Public Transportation              1.8509       0.7410      6.2391       1.0000      0.0125       6.3659
Cooking Family Meals                     2.2796       0.7473      9.3051       1.0000      0.0023       9.7730
Home Decorating                          1.0704       0.5386      3.9493       1.0000      0.0469       2.9165
Ironing Clothes                          3.4044       0.5350     40.4943       1.0000      0.0000      30.0950
Caring for Infant/Children               1.9376       0.4875     15.7968       1.0000      0.0001       6.9422
Washing Clothes Using
Washing Machine                        1.1254          0.5167     4.7440       1.0000     0.0294        3.0814
Washing Clothes by Hand                1.5623          0.5111     9.3439       1.0000     0.0022        4.7696
Washing the Dishes                     1.5934          0.5923     7.2377       1.0000     0.0071        4.9204
Constant                             -16.5552          2.6274    39.7021       1.0000     0.0000        0.0000


        Based on the results of the study, two productivity-scoring instruments for
senior citizens in Marikina City were proposed.

         1. A 14-Predictor Productivity Model Scoring Instrument. This productivity-
            scoring instrument contains 14 variables. These are:

                            1. Employment status
                            2. Preparation for old age
                            3. Walking around the house
                            4. Managing own money
                            5. Shopping for own groceries
                            6. Using public transportation
                            7. Cooking family meals
                            8. Home decorating
                            9. Ironing clothes
                            10. Caring for infant/children
                            11. Washing clothes using washing machine
                            12. Washing clothes by hand
                            13. Washing the dishes
                            14. Volunteer work.


                                                  14
This Productivity Model could be used if there is a need for more data to
   determine the productivity among senior citizens. Though it still contains
   three least significant predictors, it has a good mixture of various
   predictors that could give a more comprehensive productivity assessment.
   Moreover, the variables encompassed various contexts in which the elderly
   may find themselves engaged in. It consists of 14 questions based on the
   14 variables with 94 percent accuracy level (Figure 5).

2. The 11-Predictor Productivity Model Scoring Instrument. This scoring
    instrument contains 11 significant predictors, which are all life activities.
   It is recommended for Marikina senior citizens with similar profile as the
   respondents of this study. These are:

               1. Walking around the house
               2. Managing own money
               3. Shopping for own groceries
               4. Using public transportation
               5. Cooking
               6. Home decorating
               7. Ironing clothes
               8. Caring for infant/children
               9. Washing clothes using washing machine
               10. Washing clothes by hand
               11. Washing the dishes

This productivity-scoring instrument has 93 percent accuracy. This is more
preferred especially for the respondents of this study because it has only 11
questions representing the 11 highly significant variables that could be easily
answered by the senior citizens. It is also easier when computing for the scores
or results (Figure 6).


                                   15
Figure 5. Scoring instrument for the 14-Predictor Productivity Model

                                            PRODUCTIVITY SCORING INSTRUMENT
                                               For Marikina City Senior Citizens


                           A. NAME: _________________________

                                Below are questions related to your ability to perform basic life and household
                            activities. Read the questions carefully then put an x on the column that
                            corresponds to your answer.

                           B. SCORECARD

                                                     Questions                              Yes      No   Score (1 if
                                                                                                           yes, 0 if
                                                                                                             no)
                    1. Are you employed?                                                      x               1
                    2. Did you prepare for your old age when you were younger?                        x       0
                    3. Do you walk around the house everyday?                                 x               1
                    4. Do you manage your own money?                                          x               1
                    5. Do you shop for your own groceries or personal items?                  x               1
                    6. Do you use public transportation without help from others?             x               1
                    7. Do you cook meals for the family?                                      x               1
                    8. Do you like decorating your home?                                              x       0
                    9. Do you iron clothes for the family?                                    x               1
                    10. Do you take care of infants or children/grandchildren?                        x       0
                    11. Do you wash your clothes using a washing machine?                     x               1
                    12. Do you wash clothes by hand?                                                  x       0
                    13. Do you wash the dishes?                                                       x       0
                    14. Are you currently involved in volunteer work?                         x               1

                          Equation:
                                                                     1
P (" Pr oductive" ) =                                                                                                 = 0.6721 = 67.21%
                        1 + exp{−(−19.5457 +1.4243(1) + 0.7588(0) + 4.5917(1) +1.9924(1) + 2.4659(1) +.. + 0.6943(1)}


                          C. SCORE:

                                      PRODUCTIVE                                          NON-PRODUCTIVE
                                       (If score is >.50)                                 (If score <.50)


                               Figure 6. Scoring instrument for the 11-Predictor Productivity Model


                                                                      16
PRODUCTIVITY SCORING INSTRUMENT
                       For Marikina City Senior Citizens


   A. NAME: _________________________

       Below are questions related to your ability to perform basic life and household
   activities. Read the questions carefully then put an x the column that corresponds
   to your answer.

   B. SCORECARD

                                  Questions                               Yes     No   Score (1 if
                                                                                        yes, 0 if
                                                                                          not)
   1. Do you walk around the house everyday?                               x               1
   2. Do you manage your own money?                                               x        0
   3. Do you shop for your own groceries or personal items?                x               1
   4. Do you use public transportation without help from others?           x               1
   5. Do you cook meals for the family?                                    x               1
   6. Do you like decorating your home?                                    x               1
   7. Do you iron clothes for the family?                                  x               1
   8. Do you take care of infants or children/grandchildren?                      x        0
   9. Do you wash your clothes using a washing machine?                    x               1
   10. Do you wash clothes by hand?                                               x        0
   11. Do you wash the dishes?                                             x               1

  Equation:

                                                                       1
P (" Pr oductive" ) =
                        1 + exp{−( −16.552 + 4.1218(1) + 2.0202(1) + 2.2135(1) +1.8509(1) + 2.2796(0) +

   C. SCORE


         PRODUCTIVE                                                NON PRODUCTIVE
         (If score is >.50)                                         (If score <.50)


                    CONCLUSION AND RECOMMENDATIONS

       At this age and time when senior citizens are increasing in number, plans on
how to effectively address their needs are also underway. These plans include varied
opportunities to sustain and improve further their productivity and maintain their
contributions for their own welfare and those of others. They are aimed at
encouraging them to strengthen their independence, prolong their spirit of
productivity as they enjoy life to the fullest. The need for these programs has become


                                                17
more urgent because of the dramatic changes in family structures, roles and labor
patterns, and migration, especially in the rapidly changing global environment.
        The movement of young people to urban areas, the shift from extended to
nuclear families, and the increasing number of women joining the workforce are all
developments that brought about new adjustments especially on the senior citizens
caring for themselves. Globally, the senior citizens are now regarded as beneficiaries
and active participants and contributors of developments (WHO, 2002). In fact, they
are authentic sources of information, tested family values, beautiful traditions, and
actual experiences.
        The senior citizens have fulfilled their part in creating the kind of life we are
now enjoying. It is but just and fair to make them feel that we appreciate them for
their own contributions through the programs designed to empower them even in their
old age. No less than Pope John Paul II (Martino, 1999) in one of his celebrated
prayers on July 25, 1999, calls us to always remember that:

        “By their very presence, older people remind everyone, especially the young that life
    on earth is a ‘parable’ with its own beginning and end: to find its fulfillment, life must be
   based on values that are not transient and superficial, but solid and profound. The so called
   ‘third age’ is …a value in itself by the very fact that life is prolonged and life itself is a
   gift of God.”

       Based on the findings of this study, the following recommendations are
presented:

   1. Using the results of this study, the Office of the Senior Citizens’ Affairs
      (OSCA) that works for the welfare of Marikina City senior citizens, could plan
      and conduct skills and personality development programs (healthy lifestyle, art
      appreciation, and creative leisure activities) to increase the senior citizens’
      capabilities, empower, and build-up further their self-confidence. The senior
      citizens in their desire to participate in economic and other worthwhile
      activities can also utilize such skills.
   2. Through the findings and analyses being offered in this research, the Marikina
      City government and its private institutions could put their acts together to
      formulate public policy, maintenance, monitoring, and evaluation for the sake
      of sustaining the democratic and productive participation of the senior citizens
      in community and nation building.
   3. The study aimed at providing continued avenues where the senior citizens
      could remain as productive members of society. Therefore, the results of this
      study could be used as bases for developing better working conditions, health,
      and retirement benefits or schemes. Also, by recognizing the potential
      contributions of senior citizens, labor and business sectors in the city could
      look into the possibility of adjusting existing labor practices and policies that
      apply to ageing workers like adopting a much later retirement age or making
      retirement optional at age 65, so that they continue to actively participate in
      community development as they prepare themselves for a more economically
      sound retirement.
   4. To sustain a beautiful Filipino tradition of respect for old age and increase
      appreciation for their contributions, topics on the elderly or later maturity
      should be incorporated in the basic and tertiary education Home Economics
      curriculum. Hopefully, such inclusion of topics will enable the young to
      develop a better consciousness for the welfare of the senior citizens. In


                                                 18
addition, this will enable them to adopt a more informed consciousness about
         ageing.
    5.   Using the productivity-scoring instrument, being the major contribution of this
         research, a pilot test could be conducted among Marikina senior citizens to
         ensure its validity and reliability for self-assessment or self-evaluation.
    6.   The Marikina City government may utilize the Productivity-Scoring
         Instruments to assess the senior citizens’ capabilities and preparedness to
         undergo programs designed to provide them with sustained stimulating
         external environment in which they may function at high levels of
         attentiveness and productivity. By using these for profiling purposes, policies,
         practices, and provisions for the elderly may better be designed and
         implemented.
    7.   Considering the limitations of this research, a more in-depth study using a
         larger and more varied sample should be conducted to get a better picture of
         possible predictors of productivity among senior citizens not only in Marikina
         City but also all over the Philippines. This may become the basis of further
         transnational and cross-cultural analysis of productivity among the elderly.
    8.   The 14-Predictor Productivity Model maybe studied further in terms of its
         applicability and comprehensiveness because it covers not just the daily life
         activities but also economic activities and community work of the senior citizens.

                                         REFERENCES

Cabigon, Josefina V. (1999). Idle, tired, and retired elderly– A myth the Filipino elderly: Towards a
         society for all ages. Rapid demographic change and the welfare of the elderly project, the
         1996 Philippine elderly and near elderly survey. Demographic Research and Development
         Foundation (DRDF), Quezon City. Philippines.
Havighurst, Robert J. (1964). Developmental tasks and education. New York: David McKay Company,
         Inc. pp. 92-100.
Martino, Archbishop Renato R., Apostolic Nuncio (1999). Permanent Observer of the Holy See to the
         United Nations Before the Plenary of the General Assembly in its 54th session on the
         “Follow-Up to the international year of older persons.” New York, (October 5).
         http:/www.vatican.va/romancuria secretariatstate/documents/ rc seg-st doc 05101999 older-
         person en.html.
National Statistics Office (2005). Senior citizens comprised six percent of the population: A special
         release based on the results of census 2000. Special Release No. 151, Date Released: March
         18, 2005. http://www.census.gov.ph/data press release/2006/pr0620tx.html
Ogena, Nimfa B. ( 2006). The low and slow ageing in the Philippines: Auspicious or challenging?.
         University of the Philippines Population Institute (UPPI).
Sira, Warren (2006). Data on the registered senior citizens per barangay. Office for Senior Citizens
         Affairs, Marikina City Hall, Marikina City.

Weller, Christian E., Wenger, Jeffrey, and Elise Gould (2004).         Health insurance
coverage in
     retirement: The erosion of retiree income security.
       http://www.epinet.org/content.cfm/books_health_ins_ret
World Health Organization Brasilia (2002). Older people new power for development. UN 2002
       http://www.who.int/hpr/ageing/international_day_en.html
Yen, Duen His (1999). Johari Window.
       http:www.noogenesis.com/game_theory/johari/johari_window.html


                                                 19
About the Author

Ines Alcantara-de Guzman is the current Assistant Principal for Student Affairs of
MCHS, where she has been serving in the last 29 years. She obtained her bachelor’s,
master’s, and doctoral degrees in Home Economics from the College of Home
Economics of the University of the Philippines. She has written several textbooks in
Home Economics and Livelihood Education (HELE) Grades 4-6, Technology and
Home Economics (THE) Years I-IV, and Technology and Livelihood Education
(TLE) Years I-II. She writes a quarterly journal for TLE Years I-IV entitled Vitality
Journal published by Innovative Educational Materials, Inc., She has conducted
various seminars and workshops for HELE, THE/TLE teachers.


                                         20

Mais conteúdo relacionado

Semelhante a Determinants of Productivity among Senior Citizens...

The Growth of Charitable Estate Planning
The Growth of Charitable Estate PlanningThe Growth of Charitable Estate Planning
The Growth of Charitable Estate PlanningRussell James
 
How Gender Biased are Female-Headed-Households Transfers in Egypt?
How Gender Biased are Female-Headed-Households Transfers in Egypt?How Gender Biased are Female-Headed-Households Transfers in Egypt?
How Gender Biased are Female-Headed-Households Transfers in Egypt?Mohamed Ramadan
 
Estimating the magnitude and correlates of poverty using consumption approach...
Estimating the magnitude and correlates of poverty using consumption approach...Estimating the magnitude and correlates of poverty using consumption approach...
Estimating the magnitude and correlates of poverty using consumption approach...Alexander Decker
 
Lesson-4Chapter-Three-of-Your-Thesis.pdf
Lesson-4Chapter-Three-of-Your-Thesis.pdfLesson-4Chapter-Three-of-Your-Thesis.pdf
Lesson-4Chapter-Three-of-Your-Thesis.pdfShaneWesleyCardenas
 
11.quality of life of slum women a case study of mangalore city
11.quality of life of slum women a case study of mangalore city11.quality of life of slum women a case study of mangalore city
11.quality of life of slum women a case study of mangalore cityAlexander Decker
 
Quality of life of slum women a case study of mangalore city
Quality of life of slum women a case study of mangalore cityQuality of life of slum women a case study of mangalore city
Quality of life of slum women a case study of mangalore cityAlexander Decker
 
P1833 Sustainable Rural Livelihoods Ids Paper72
P1833 Sustainable Rural Livelihoods Ids Paper72P1833 Sustainable Rural Livelihoods Ids Paper72
P1833 Sustainable Rural Livelihoods Ids Paper72guest833725e7
 
Plenary session 5 6. gao et al, 14,08,28a
Plenary session 5 6. gao et al, 14,08,28aPlenary session 5 6. gao et al, 14,08,28a
Plenary session 5 6. gao et al, 14,08,28aIARIW 2014
 
Understanding The Environment Of Demographics
Understanding The Environment Of DemographicsUnderstanding The Environment Of Demographics
Understanding The Environment Of DemographicsChristina Valadez
 
Povertymappingmalawitoddbenson 091211011812-phpapp01
Povertymappingmalawitoddbenson 091211011812-phpapp01Povertymappingmalawitoddbenson 091211011812-phpapp01
Povertymappingmalawitoddbenson 091211011812-phpapp01Elton Plaatjes
 
V2 Makenzie QoL Poster Final Version (1)
V2 Makenzie QoL Poster Final Version (1)V2 Makenzie QoL Poster Final Version (1)
V2 Makenzie QoL Poster Final Version (1)Makenzie Zidek
 
A03660105
A03660105A03660105
A03660105theijes
 
1 Graduation as Resilence BRAC - IDS Martin Greeley
1 Graduation as Resilence BRAC - IDS Martin Greeley1 Graduation as Resilence BRAC - IDS Martin Greeley
1 Graduation as Resilence BRAC - IDS Martin GreeleyThe Impact Initiative
 
Beyond GDP: Measuring well-being and progress of Nations
Beyond GDP: Measuring well-being and progress of NationsBeyond GDP: Measuring well-being and progress of Nations
Beyond GDP: Measuring well-being and progress of NationsKübra Bayram
 
Government Unconditional Transfers and Safe Transitions into Adulthood - Lamb...
Government Unconditional Transfers and Safe Transitions into Adulthood - Lamb...Government Unconditional Transfers and Safe Transitions into Adulthood - Lamb...
Government Unconditional Transfers and Safe Transitions into Adulthood - Lamb...The Transfer Project
 

Semelhante a Determinants of Productivity among Senior Citizens... (20)

The Growth of Charitable Estate Planning
The Growth of Charitable Estate PlanningThe Growth of Charitable Estate Planning
The Growth of Charitable Estate Planning
 
C0323015018
C0323015018C0323015018
C0323015018
 
How Gender Biased are Female-Headed-Households Transfers in Egypt?
How Gender Biased are Female-Headed-Households Transfers in Egypt?How Gender Biased are Female-Headed-Households Transfers in Egypt?
How Gender Biased are Female-Headed-Households Transfers in Egypt?
 
Estimating the magnitude and correlates of poverty using consumption approach...
Estimating the magnitude and correlates of poverty using consumption approach...Estimating the magnitude and correlates of poverty using consumption approach...
Estimating the magnitude and correlates of poverty using consumption approach...
 
Lesson-4Chapter-Three-of-Your-Thesis.pdf
Lesson-4Chapter-Three-of-Your-Thesis.pdfLesson-4Chapter-Three-of-Your-Thesis.pdf
Lesson-4Chapter-Three-of-Your-Thesis.pdf
 
11.quality of life of slum women a case study of mangalore city
11.quality of life of slum women a case study of mangalore city11.quality of life of slum women a case study of mangalore city
11.quality of life of slum women a case study of mangalore city
 
Quality of life of slum women a case study of mangalore city
Quality of life of slum women a case study of mangalore cityQuality of life of slum women a case study of mangalore city
Quality of life of slum women a case study of mangalore city
 
P1833 Sustainable Rural Livelihoods Ids Paper72
P1833 Sustainable Rural Livelihoods Ids Paper72P1833 Sustainable Rural Livelihoods Ids Paper72
P1833 Sustainable Rural Livelihoods Ids Paper72
 
Foust Mead DISSA Part 1
Foust Mead DISSA  Part 1Foust Mead DISSA  Part 1
Foust Mead DISSA Part 1
 
Plenary session 5 6. gao et al, 14,08,28a
Plenary session 5 6. gao et al, 14,08,28aPlenary session 5 6. gao et al, 14,08,28a
Plenary session 5 6. gao et al, 14,08,28a
 
Understanding The Environment Of Demographics
Understanding The Environment Of DemographicsUnderstanding The Environment Of Demographics
Understanding The Environment Of Demographics
 
Povertymappingmalawitoddbenson 091211011812-phpapp01
Povertymappingmalawitoddbenson 091211011812-phpapp01Povertymappingmalawitoddbenson 091211011812-phpapp01
Povertymappingmalawitoddbenson 091211011812-phpapp01
 
Micro zone data
Micro zone dataMicro zone data
Micro zone data
 
V2 Makenzie QoL Poster Final Version (1)
V2 Makenzie QoL Poster Final Version (1)V2 Makenzie QoL Poster Final Version (1)
V2 Makenzie QoL Poster Final Version (1)
 
A03660105
A03660105A03660105
A03660105
 
1 Graduation as Resilence BRAC - IDS Martin Greeley
1 Graduation as Resilence BRAC - IDS Martin Greeley1 Graduation as Resilence BRAC - IDS Martin Greeley
1 Graduation as Resilence BRAC - IDS Martin Greeley
 
WP904
WP904WP904
WP904
 
02 population perspective
02 population perspective02 population perspective
02 population perspective
 
Beyond GDP: Measuring well-being and progress of Nations
Beyond GDP: Measuring well-being and progress of NationsBeyond GDP: Measuring well-being and progress of Nations
Beyond GDP: Measuring well-being and progress of Nations
 
Government Unconditional Transfers and Safe Transitions into Adulthood - Lamb...
Government Unconditional Transfers and Safe Transitions into Adulthood - Lamb...Government Unconditional Transfers and Safe Transitions into Adulthood - Lamb...
Government Unconditional Transfers and Safe Transitions into Adulthood - Lamb...
 

Último

mini mental status format.docx
mini    mental       status     format.docxmini    mental       status     format.docx
mini mental status format.docxPoojaSen20
 
Grant Readiness 101 TechSoup and Remy Consulting
Grant Readiness 101 TechSoup and Remy ConsultingGrant Readiness 101 TechSoup and Remy Consulting
Grant Readiness 101 TechSoup and Remy ConsultingTechSoup
 
Introduction to Nonprofit Accounting: The Basics
Introduction to Nonprofit Accounting: The BasicsIntroduction to Nonprofit Accounting: The Basics
Introduction to Nonprofit Accounting: The BasicsTechSoup
 
Z Score,T Score, Percential Rank and Box Plot Graph
Z Score,T Score, Percential Rank and Box Plot GraphZ Score,T Score, Percential Rank and Box Plot Graph
Z Score,T Score, Percential Rank and Box Plot GraphThiyagu K
 
Measures of Dispersion and Variability: Range, QD, AD and SD
Measures of Dispersion and Variability: Range, QD, AD and SDMeasures of Dispersion and Variability: Range, QD, AD and SD
Measures of Dispersion and Variability: Range, QD, AD and SDThiyagu K
 
Paris 2024 Olympic Geographies - an activity
Paris 2024 Olympic Geographies - an activityParis 2024 Olympic Geographies - an activity
Paris 2024 Olympic Geographies - an activityGeoBlogs
 
Sanyam Choudhary Chemistry practical.pdf
Sanyam Choudhary Chemistry practical.pdfSanyam Choudhary Chemistry practical.pdf
Sanyam Choudhary Chemistry practical.pdfsanyamsingh5019
 
Sports & Fitness Value Added Course FY..
Sports & Fitness Value Added Course FY..Sports & Fitness Value Added Course FY..
Sports & Fitness Value Added Course FY..Disha Kariya
 
1029 - Danh muc Sach Giao Khoa 10 . pdf
1029 -  Danh muc Sach Giao Khoa 10 . pdf1029 -  Danh muc Sach Giao Khoa 10 . pdf
1029 - Danh muc Sach Giao Khoa 10 . pdfQucHHunhnh
 
Disha NEET Physics Guide for classes 11 and 12.pdf
Disha NEET Physics Guide for classes 11 and 12.pdfDisha NEET Physics Guide for classes 11 and 12.pdf
Disha NEET Physics Guide for classes 11 and 12.pdfchloefrazer622
 
Arihant handbook biology for class 11 .pdf
Arihant handbook biology for class 11 .pdfArihant handbook biology for class 11 .pdf
Arihant handbook biology for class 11 .pdfchloefrazer622
 
Student login on Anyboli platform.helpin
Student login on Anyboli platform.helpinStudent login on Anyboli platform.helpin
Student login on Anyboli platform.helpinRaunakKeshri1
 
Accessible design: Minimum effort, maximum impact
Accessible design: Minimum effort, maximum impactAccessible design: Minimum effort, maximum impact
Accessible design: Minimum effort, maximum impactdawncurless
 
A Critique of the Proposed National Education Policy Reform
A Critique of the Proposed National Education Policy ReformA Critique of the Proposed National Education Policy Reform
A Critique of the Proposed National Education Policy ReformChameera Dedduwage
 
Russian Call Girls in Andheri Airport Mumbai WhatsApp 9167673311 💞 Full Nigh...
Russian Call Girls in Andheri Airport Mumbai WhatsApp  9167673311 💞 Full Nigh...Russian Call Girls in Andheri Airport Mumbai WhatsApp  9167673311 💞 Full Nigh...
Russian Call Girls in Andheri Airport Mumbai WhatsApp 9167673311 💞 Full Nigh...Pooja Nehwal
 
Interactive Powerpoint_How to Master effective communication
Interactive Powerpoint_How to Master effective communicationInteractive Powerpoint_How to Master effective communication
Interactive Powerpoint_How to Master effective communicationnomboosow
 
Activity 01 - Artificial Culture (1).pdf
Activity 01 - Artificial Culture (1).pdfActivity 01 - Artificial Culture (1).pdf
Activity 01 - Artificial Culture (1).pdfciinovamais
 
Kisan Call Centre - To harness potential of ICT in Agriculture by answer farm...
Kisan Call Centre - To harness potential of ICT in Agriculture by answer farm...Kisan Call Centre - To harness potential of ICT in Agriculture by answer farm...
Kisan Call Centre - To harness potential of ICT in Agriculture by answer farm...Krashi Coaching
 
BASLIQ CURRENT LOOKBOOK LOOKBOOK(1) (1).pdf
BASLIQ CURRENT LOOKBOOK  LOOKBOOK(1) (1).pdfBASLIQ CURRENT LOOKBOOK  LOOKBOOK(1) (1).pdf
BASLIQ CURRENT LOOKBOOK LOOKBOOK(1) (1).pdfSoniaTolstoy
 

Último (20)

mini mental status format.docx
mini    mental       status     format.docxmini    mental       status     format.docx
mini mental status format.docx
 
Grant Readiness 101 TechSoup and Remy Consulting
Grant Readiness 101 TechSoup and Remy ConsultingGrant Readiness 101 TechSoup and Remy Consulting
Grant Readiness 101 TechSoup and Remy Consulting
 
Mattingly "AI & Prompt Design: The Basics of Prompt Design"
Mattingly "AI & Prompt Design: The Basics of Prompt Design"Mattingly "AI & Prompt Design: The Basics of Prompt Design"
Mattingly "AI & Prompt Design: The Basics of Prompt Design"
 
Introduction to Nonprofit Accounting: The Basics
Introduction to Nonprofit Accounting: The BasicsIntroduction to Nonprofit Accounting: The Basics
Introduction to Nonprofit Accounting: The Basics
 
Z Score,T Score, Percential Rank and Box Plot Graph
Z Score,T Score, Percential Rank and Box Plot GraphZ Score,T Score, Percential Rank and Box Plot Graph
Z Score,T Score, Percential Rank and Box Plot Graph
 
Measures of Dispersion and Variability: Range, QD, AD and SD
Measures of Dispersion and Variability: Range, QD, AD and SDMeasures of Dispersion and Variability: Range, QD, AD and SD
Measures of Dispersion and Variability: Range, QD, AD and SD
 
Paris 2024 Olympic Geographies - an activity
Paris 2024 Olympic Geographies - an activityParis 2024 Olympic Geographies - an activity
Paris 2024 Olympic Geographies - an activity
 
Sanyam Choudhary Chemistry practical.pdf
Sanyam Choudhary Chemistry practical.pdfSanyam Choudhary Chemistry practical.pdf
Sanyam Choudhary Chemistry practical.pdf
 
Sports & Fitness Value Added Course FY..
Sports & Fitness Value Added Course FY..Sports & Fitness Value Added Course FY..
Sports & Fitness Value Added Course FY..
 
1029 - Danh muc Sach Giao Khoa 10 . pdf
1029 -  Danh muc Sach Giao Khoa 10 . pdf1029 -  Danh muc Sach Giao Khoa 10 . pdf
1029 - Danh muc Sach Giao Khoa 10 . pdf
 
Disha NEET Physics Guide for classes 11 and 12.pdf
Disha NEET Physics Guide for classes 11 and 12.pdfDisha NEET Physics Guide for classes 11 and 12.pdf
Disha NEET Physics Guide for classes 11 and 12.pdf
 
Arihant handbook biology for class 11 .pdf
Arihant handbook biology for class 11 .pdfArihant handbook biology for class 11 .pdf
Arihant handbook biology for class 11 .pdf
 
Student login on Anyboli platform.helpin
Student login on Anyboli platform.helpinStudent login on Anyboli platform.helpin
Student login on Anyboli platform.helpin
 
Accessible design: Minimum effort, maximum impact
Accessible design: Minimum effort, maximum impactAccessible design: Minimum effort, maximum impact
Accessible design: Minimum effort, maximum impact
 
A Critique of the Proposed National Education Policy Reform
A Critique of the Proposed National Education Policy ReformA Critique of the Proposed National Education Policy Reform
A Critique of the Proposed National Education Policy Reform
 
Russian Call Girls in Andheri Airport Mumbai WhatsApp 9167673311 💞 Full Nigh...
Russian Call Girls in Andheri Airport Mumbai WhatsApp  9167673311 💞 Full Nigh...Russian Call Girls in Andheri Airport Mumbai WhatsApp  9167673311 💞 Full Nigh...
Russian Call Girls in Andheri Airport Mumbai WhatsApp 9167673311 💞 Full Nigh...
 
Interactive Powerpoint_How to Master effective communication
Interactive Powerpoint_How to Master effective communicationInteractive Powerpoint_How to Master effective communication
Interactive Powerpoint_How to Master effective communication
 
Activity 01 - Artificial Culture (1).pdf
Activity 01 - Artificial Culture (1).pdfActivity 01 - Artificial Culture (1).pdf
Activity 01 - Artificial Culture (1).pdf
 
Kisan Call Centre - To harness potential of ICT in Agriculture by answer farm...
Kisan Call Centre - To harness potential of ICT in Agriculture by answer farm...Kisan Call Centre - To harness potential of ICT in Agriculture by answer farm...
Kisan Call Centre - To harness potential of ICT in Agriculture by answer farm...
 
BASLIQ CURRENT LOOKBOOK LOOKBOOK(1) (1).pdf
BASLIQ CURRENT LOOKBOOK  LOOKBOOK(1) (1).pdfBASLIQ CURRENT LOOKBOOK  LOOKBOOK(1) (1).pdf
BASLIQ CURRENT LOOKBOOK LOOKBOOK(1) (1).pdf
 

Determinants of Productivity among Senior Citizens...

  • 1. Determinants of Productivity among Senior Citizens in Marikina City Ines Alcantara-de Guzman, PhD ABSTRACT This exploratory study was conducted to identify the variables that are possible determinants of productivity among senior citizens in Marikina City and to develop a productivity-scoring instrument. The respondents were 354 male and female senior citizens aged 60-79 from Barangka and Concepcion Uno/Tumana, Marikina City. Data gathering was done using a researcher-made survey questionnaire, which consisted of three parts of combined checklist and fill-in type questions. Results show that only life activities such as walking, managing money, shopping for own groceries/personal items, using public transportation, cooking, home decorating, ironing, caring for infants/children, washing clothes using washing machine, washing clothes by hand, and washing the dishes are the only specific indicators based on Havighurst’s paradigm that predict productivity among senior citizens. Two models of productivity were developed based on the results. The first model is a 14-Predictor Productivity Model which includes 14 variables such as employment status, preparation for old age, walking, managing own money, shopping for groceries/ personal items, riding public transport, washing clothes using washing machine, washing clothes by hand, washing the dishes, and volunteer work. The second model is an 11-Predictor Productivity Model, which includes all the variables in the 14-Predictor Productivity Model except employment status, preparation for old age, and volunteer work. Productivity-scoring instruments were formulated for these two models using the questions on the research questionnaire. The focus group discussion composed of 20 participants validated the findings of the study. INTRODUCTION In the face of changing times and greater emphasis on high productivity, there seems to be a tendency to regard senior citizens as unproductive and generally as burden to others. Although it is not obligatory for those under 60 or 65 years old to leave the work force because of mandatory requirements, they are usually seen as ineffective or unprepared to handle new tasks brought about by modernization and technology. They are also victims of outright discrimination when seeking work because employers prefer younger persons. The most serious difficulties from which the senior citizens suffer are economic in nature. Because of reduced income or lack of it, a high percentage of senior citizens are living near or below the poverty level. Retirement plans are generally inadequate and inflation becomes their serious problem. Many of them do not have access to adequate health services (Ogena, 2006) and once they enter the retirement age, it is hard for them to get health insurance because of age limit and prevailing costs (Weller, Wenger, and Gould, 2004). This concern over the plight of the senior citizens is an aftermath of the increasing number of older persons 60 years old and above. Although still a young population compared with other age groups, the National Statistics Office (NSO) has reported a notable increase in their number. Based on its March 18, 2005 Special Release, the total number of senior citizens 60 years old and above has reached 4.6 million, accounting for 5.97 percent of the country’s population of 76.5 million. It means a 22.18 percent increase from 1995 (3.7 million persons) and an average 1
  • 2. annual population growth rate of 4.39 percent during the 1995 to 2000 period. If this growth rate continues, the number of senior citizens is expected to reach seven million in 2010 and to double in approximately 16 years (NSO, 2005). Such scenario may result to having the “young old” (60-69 years old) taking care of the “old-old” (70-79 years old). Many of the retired senior citizens continue to work in both formal and informal labor sectors according to their capacities and preferences. Studies conducted show retirees who are employed fulltime with an average of 40 hours per week (Cabigon, 1996 and NSO, 2005). These are indications that the senior citizens are still capable of productive endeavors. Hence, this study focused on accomplishing the following objectives: 1. to describe the socio-demographic and health profile of senior citizens in Marikina City; 2. to identify the variables that are possible determinants of productivity among senior citizens in Marikina City; and 3. to develop a productivity scorecard for senior citizens. METHODOLOGY This study is an exploratory research, which made use of a researcher-made questionnaire as the survey technique combined with face-to-face interview. A qualitative element in the form of a focus group discussion (FGD) was also used to complement the quantitative analysis performed on the survey responses. The respondents were male and female 60-79 years old senior citizens from two barangays representing the two districts of Marikina City: Barangka of District 1 and ConcepcionUno/Tumana of District II. These two barangays were the most populous among the barangays in the two districts and they have the highest number of senior citizens. Barangka is the first of nine barangays in District 1 with 1,277 registered senior citizens while Concepcion Uno/Tumana is the third of five barangays in District II, with 2,917 registered senior citizens (Sira, 2006). A Focus Group Discussion (FGD) was conducted among 20 participants, who were not among the respondents, to validate the data gathered from the research respondents. The data gathered was encoded in MSExcel, processed and analyzed using the Statistical Package for the Social Sciences (SPSS). Graphical, tabular representations as well as summary statistics were used in the presentation of the sociographic, demographic, and health profile of the respondents. Cluster analysis was utilized to determine the number used to classify the senior citizens into groups such that none in the same cluster have similar characteristics. The particular criterion used for clustering was the Ward method. In this method, the clusters that were fused at each stage in the agglomeration process were such that their merger gave the minimum possible increase in the within-cluster variation, which was an assurance of homogeneity within the newly formed cluster. The Dendogram is a graphical illustration of the groupings. It was used to generate two groups of respondents based on 25 variables - the “productive” and “non-productive” senior citizens. Logistic regression analysis was also used to determine which among the 25 variables were predictors of productivity among the respondents. It was used to generate the productivity scoring for senior citizens. The score was actually a probability of being “productive” based on the estimated model as follows: 1 P (" Pr oductive" ) = ˆ + β X + β X + ... + β X )} 1 + exp{−( β0 ˆ ˆ ˆ 1 1 2 2 25 25 2
  • 3. The estimated quantities β , β ,..., β were the coefficients of regression. The ˆ 0 ˆ 1 ˆ 25 variables X1, X2,..,X25 were the dichotomous characteristics (1=present, 0=absent) listed below. X1 = Head of the Family X2 = Employed X3 = Income X4 = Prepared for old age X5 = Dressing X6 = Eating X7 = Bathing X8 = Walking X9 = Light Chores X10 = Managing Own Money X11 = Preparing Own Meal X12 = Shopping for Groceries X13 = Riding a Public Transport X14 = Cleaning the House X15 = Cooking X16 = Home Decorating X17 = Ironing Clothes X18 = Caring for Children X19 = Washing Clothes (by washing machine) X20 = Washing Clothes (by hand) X21 = Washing the Dishes X22 = Health Status (Perceived) X23 = Organization (Membership) X24 = Volunteer Work X25 = Productive (Perceived) After all 25 variables were fitted, backward deletion of non-significant variables was performed to arrive at the best subset of characteristics that would most likely separate “productive” and “non-productive” individuals. Cluster analysis was used to determine the number used to classify the senior citizens into groups such that none in the same cluster have similar characteristics. Each cluster thus described, in terms of the data collected, the class to which its members belonged; and this description may be abstracted through use from the particular to the general class or type. The particular criterion used for clustering was the Ward method. Here, the clusters that were fused at each stage in the agglomeration process were such that their merger gave the minimum possible increase in the within-cluster variation, which was an assurance of homogeneity within the newly formed cluster. RESULTS AND DISCUSSIONS Profile of Respondents Majority of the respondents were 60-69 years old, females, married, elementary level or elementary graduates, laborers, living with spouses and their children, and heads of families (Table 1). 3
  • 4. Table 1. Demo-Sociographic Profile of Respondents (N=354) Variable Category Frequency Percentage 60-69 193 54.50 Age 70 and above 161 46.00 Female 249 70.30 Gender Male 105 29.70 Married 184 52.00 Widow/Widower 147 41.50 Civil Status Single 17 4.80 Separated 6 1.70 Elementary level/Graduate 173 48.90 High School Level/Graduate 77 21.80 College Units/Graduate 53 15.00 Educational Attainment Voc Tech/College Level 37 10.50 No Formal Schooling 11 3.10 Graduate Degree 3 0.80 Living with spouse/children 128 36.20 Living with child/children 127 35.90 Living Arrangement Living with spouse 43 12.10 Living alone 28 7.90 Living with other relatives 28 7.90 Laborer 46 19.66 Shoemaker 41 17.52 Professional 32 13.68 Service Worker 26 11.11 Manager/Supervisor 21 8.97 Clerk 12 5.13 Sales Worker 11 4.70 Machine Operator 7 2.99 Vendor 6 2.56 Technician 4 1.71 Occupation Upon Retirement Store Owner/Operator 4 1.71 Farmer 4 1.71 Underwriter 3 1.28 Unskilled Worker 1 0.43 Shop Worker 1 0.43 Fisherman 1 0.43 Corporate Executive 1 0.43 Carinderia 1 0.43 Corporate Executive 1 0.43 Unskilled Worker 6 2.56 No Data 5 14.71 Living with Spouse/Children 128 36.20 Living with Child/Children 127 35.90 Living Arrangement Living with Spouse 43 12.10 Living alone 28 7.90 Living with Other Relatives 28 7.90 Yes, Head of the Family 190 53.70 Head of the Family No, Not Head of the Family 164 46.30 Health Status and Physical Well-Being 4
  • 5. Majority of the respondents were non-smokers and non-drinkers of alcoholic beverages; have poor vision; went to the city’s government hospital for medical attention; assessed their health condition as good to excellent; and spent their leisure time watching television and listening to music (Table 2). Table 2. Health Status and Physical Well-Being of Respondents (N=354) Variable Category Frequency Percentage No, I don't smoke 313 88.40 Smoking Patterns Yes, I smoke 41 11.60 No, I don't drink alcoholic beverages 317 89.50 Drinking Patterns Yes, I drink alcoholic beverages 37 10.50 Poor Vision 199 56.21 Poor Hearing 51 43.80 Arthritis 106 30.00 Hypertension 84 23.90 Cataract 51 14.41 Heart Disease 37 10.45 Health Status* Asthma 20 5.65 Kidney Problem 18 5.08 Osteoporosis 17 4.80 Pulmonary Disease 11 3.11 Ulcer 10 2.82 Emphysema 3 0.85 Glaucoma 2 0.56 Government Hospital 141 39.80 Health Center 130 36.70 Medical Facility Used* Private Clinic 65 18.40 Private Hospital 41 11.60 Home 41 11.60 Good to Excellent 264 74.60 Perceived Health Assessment Poor to Fair 90 25.40 Watching Television 300 84.70 Listening to Music 224 63.30 Needlework 53 15.00 Ballroom Dancing 23 6.50 Leisure Activities* Playing Board Games 14 4.00 Fishing 9 2.50 Handicrafts 8 2.30 Painting 4 1.10 Collecting items 1 0.30 *Multiple Responses Economic Activities Most of the respondents were retirees and were receiving a monthly pension of Php 4,000.00 and below. A small percentage of the respondents were employed and were working in private companies and receiving an income of Php 4,000.00 and below. Majority of them claimed that the monthly income they received was insufficient for their daily needs. Most of the unemployed and non-retirees have plans of looking for a fulltime but home-based jobs. The unemployed and non-retirees identified several sources of income such as children, other relatives, friends, and colleagues; rentals; farmland; financial investment; spouse’s pension; and spouse’s 5
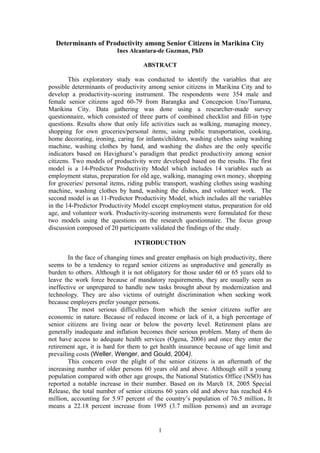
  • 6. income. Most of the respondents also claimed that they prepared for their old age by sending their children to school, a typical Filipino family value giving importance to education as a poverty-liberating factor. Those who claimed they did not prepare for old age pointed out some reasons such as: no extra income; it was not seen as a need; and they were too busy to think of saving for their old age (Table 3). Table 3. Economic Activities of Respondents (N=354) Variable Category Frequency Percentage Retired 174 49.20 Employment Status Otherwise (Unemployed/Non-retiree) 120 33.90 Employed 60 16.90 Private 144 62.30 Type of Employment Self-employed 55 23.80 Government 32 13.90 Below P4, 000 38 63.33 4,001-8,000 13 21.67 8,001-15,000 4 6.67 Monthly Income of Employed 15,001-30,000 1 1.67 30,001-50,000 1 1.67 50,001 and above 1 1.67 No data 2 3.33 Below P4, 000 97 55.75 4,001-8,000 21 12.00 8,001-15,000 10 5.75 Monthly Pension of Retirees 15,001-30,000 2 1.15 30,001-50,000 1 0.57 50,001 and above 0 0 No pension 43 29.71 Have plans to look for work 136 46.25 Fulltime 136 46.25 Part-time 106 36.05 Work Plans and Preferences of Undecided 52 17.69 Unemployed and Retirees Home-based 88 29.93 Out-of-home 43 14.68 Undecided 163 55.44 Life Activities Most of the respondents could perform activities of daily life (ADLs) without any help from other people such as: dressing up or putting on clothes, eating, taking a bath, and walking around the house. Among the respondents, 1.4 percent expressed difficulty in walking around the house, 13.1 percent have difficulty dressing up and eating, while 2.5 percent have difficulty taking a bath. This could be attributed to the fact that there are more 60 to 69 years old (young old) than the 70 years old and above (old-old), thus younger and stronger respondents. Majority can also perform instrumental activities of daily life (IADLs) such as doing light household chores, managing own money, preparing own meal, shopping for own groceries/personal items, and using public transportation. Results also show that majority of the respondents were involved in household chores in their own homes. In fact, they considered these household chores as their contributions in their families (Figure 1). 6
  • 7. Figure 1. Engagement in Activities of Daily Living (ADL), Instrumental Activities in Daily Living (IADL), and Household Chores. ENGAGEMENT IN ADLs ENGAGEMENT IN IADLs HOUSEHOLD ACTIVITIES Doing light Cleaning the Walking 80.5 household 92.1 house around 98.6 w ork the house Cooking 78.0 Managing Washing the 73.2 ow n money 68.6 Taking a dishes 97.5 bath Ironing clothes 54.8 Preparing 92.9 ow n meal Washing 54.8 clothes by hand Eating 96.9 Shopping for ow n Taking care of 76.3 46.6 groceries or infants/children personal item Home Dressing 37.0 decorating up/Putting 96.9 Using public 81.6 on clothes transportation Washing 36.7 clothes by Volunteer Work Volunteer work is a valuable and productive way for older people to stay engaged in society, to use their expertise, maintain, and nourish their sense of purpose, their innate value and their self-respect, which results in greater independence, health and well-being for older people (WHO, 2002). The results of this study show that most of the respondents (55.9%) were not involved in volunteer work due to poor health (28.8%). Other reasons given were lack of time (18.1%); they did not know how and where (12.1%); and they lacked funds to do volunteer work (1.4%). Those who were involved in volunteer work joined barangay activities; Homeowners’ Association activities; parish activities (church choir, lector, acolyte, catechist, lay minister, and mother butler); feeding programs; Gawad Kalinga projects; livelihood programs; family counseling; and traffic enforcer volunteer (Figure 2). Figure 2. Involvement in Volunteer Work 7
  • 8. VOLUNTEER WORK PARTICIPATED IN REASONS FOR NO VOLUNTEER WORK Barangay 28.2 Activities Homeowners' Health 10.2 28.8 Association reasons Church choir 5.6 Lay Minister 4.8 Lack of 18.1 time Lector 3.7 Feeding 2.3 programs Don't Catechist 1.7 know how 12.1 Livelihood and where 1.7 programs Family 1.7 Lack of counseling Mother necessary 2.8 1.1 Butler skills Gawad 0.8 Kalinga Traffic 0.8 Lack of Enforcer 1.4 funds Acolyte 0.6 Membership in Organizations Havighurst (1964) noted that establishing an explicit affiliation with one’s age group is one task of the elderly. It involves accepting one’s status in the community and becoming an active participant in one’s age group. Ageing slows down a person, such that it is now quite impossible for senior citizens to keep up with activities done in their younger years, thus they resort to giving up these activities. In this study, most of the respondents (63.3%) were members of organizations such as: church organizations, Homeowners/Neighborhood Association, Kababaihan, Civic Clubs, Samahang Caretakers, Senior Choir, Marikina Riverpark Runners, Loyola Civic Organizations, Senior Citizens’ Association, and Women’s Clubs. The senior citizens looked at membership in organizations as their chance to relate with other people especially those of their own age. Community Involvement Havighurst (1964) also added that one task of later maturity is meeting social and civic obligations. He said that older people are involved in the conduct of civic and political affairs both as citizens and office holders. In this study, the senior citizens were asked to identify top five problems in their respective communities. The results show that majority (66.6%) of the respondents considered unemployment problems as the number one problem followed by security (41.4%), substance abuse (33.1%), pollution (30.6%) and illiteracy (21.5%). They also identified some personal 8
  • 9. contributions to lessen these problems such as reporting incidents to authorities (63.2%), participating actively in community affairs (49.9%), becoming a more vigilant community member (34.3%), and conducting skills development programs (23.7%). Their knowledge about societal problems and what they could do to help solve these problems were clear indications of their desire to take part in community affairs (Table 4). Table 4. Community Involvement of the Respondents (N=354) Variable Category Frequency Percentage Unemployment 235 66.6 Security 146 41.4 Substance abuse 117 33.1 Pollution 100 30.6 Community Problems* Crime and Violence 76 21.5 Illiteracy 76 21.5 Juvenile delinquency 57 16.1 Child Abuse 36 10.2 Immorality 35 9.9 Report incidents immediately to authorities 223 63.2 Possible Contributions Participate actively in community affairs 176 49.9 of Respondents* Become a more vigilant community member 121 34.3 Conduct skills development program 73 23.7 Multiple Responses* Perceived Productivity Majority of the respondents (85.9%) claimed that they are productive. This personal assessment supports the argument that senior citizens are still at the height of their productivity and their desire to continue being a resource for their families and in the community where they belong. “Productive” and “Non-Productive” Respondents Using Cluster Analysis, 25 variables were chosen from the questionnaire and were tested using Statistical Package for the Social Sciences (SPSS). The objective was to group the respondents into “productive” and “non-productive” based on the chosen variables. The Dendogram showed two major clusters of respondents: the “productive” and the “non-productive” clusters. Results also show that almost an equal number of respondents were labeled as “productive” and “non-productive” (Figure 3), which did not cohere to the respondents’ actual perception of themselves. Thus, the results of the Cluster Analysis was only one way of classifying the senior citizens based on the variables chosen. However, the perceived productivity of the respondents based on their own personal assessment, which includes their capabilities cannot be ignored as another way of grouping them. Figure 3. “Productive” and “Non-Productive” Respondents Based on the 25 Variables 9
  • 10. Variables PRODUCTIVE VS NON-PRODUCTIVE Head of the family 46% 62% Employed 21% 13% Income 38% 38% Prepared for old age 78% 65% Dressing 100% 94% Eating 100% 94% Bathing 99% 95% Walking 99% 98% Light Chores 98% 86% Managing Own Money 89% 57% Preparing Own Meal 99% 86% Shopping for Groceries 94% 57% Riding a Public Transport 94% 68% Cleaning the House 98% 62% Cooking 96% 59% Home Decorating 60% 13% Ironing Clothes 89% 19% Caring for Children 66% 26% Washing Clothes (by machine) 50% 23% Washing Clothes (by hand) 73% 36% Washing the Dishes 93% 43% Healthy (Perceived) 76% 73% Organization (Membership) 71% 56% Volunteer 50% 38% Productive (Perceived) 91% 81% The groupings generated by the Cluster Analysis may lead to stereotyping the senior citizens so that other people may see them as “non-productive”. This stereotyping could be one of the reasons why after retirement the average senior citizen could hardly get a second employment or if unemployed, such stereotype makes it harder for him or her to participate in paid labor as evidenced by the respondent’s disclosure below. “Dapat pantay-pantay ang pagtingin ng mga employers sa mga naghahanap ng trabaho matanda man o bata. Sa mga panahong ito, para bang wala nang kuwenta ang tao pag matanda na kasi ayaw ng tanggapin sa trabaho.” (Employers should give equal chances to people looking for jobs, young or old. At present, it seems like senior citizens are useless because employers do not want to hire them anymore.) The results could also be supported in terms of what the Johari Window by Joseph Luft and Harry Ingham (Yen, 1999) posits. It is one of the most useful models describing the process of human interaction. The four-paned window divides personal awareness into four different types represented by its four quadrants: open, hidden, blind, and unknown. The lines dividing the four are like window shades, which can move as an interaction progresses. The open quadrant is known to self and to others; the blind quadrant is not known to self but known to others; the hidden quadrant is known to self but not known to others; the unknown quadrant is not known to self and not known to others. Hence, the perceived productivity of the respondents could be compared to the hidden quadrant where information is known only to the self, while the result of the Cluster Analysis could be compared to the blind quadrant where information is unknown to the self but known to others. The Johari Window (Figure 10
  • 11. 4) aims at increasing the open area while reducing the blind, the hidden, and the unknown areas through feedback, disclosure, and self-discovery and mutual enlightenment respectively. Similarly, feedback, disclosure, self-discovery, and mutual enlightenment can be beneficial for the senior citizens and those working for their welfare. Figure 4. Productivity and the Johari Window KNOWN TO UNKNOWN SELF TO SELF OPEN BLIND Cluster KNOWN TO OTHERS Analysis’ Result on Productivity HIDDEN UNKNOWN Perceived UNKNOWN TO OTHERS Productivity of Respondents Predictors of Productivity Logistic regression analysis was used to determine which among the 25 variables were predictors of productivity among the respondents. It was also used to generate the productivity scorecard for senior citizens. The Full Model (Table 5) shows all 25 clustering variables entering the model. Though some variables were not significant on their own, logistic regression combined their predictive powers. From the Full Model, deletion was done starting with health, as most geriatric studies seem to point that this bears the least significance to the senior citizen’s productivity followed by eating with .999 significance. From here on, deletion continued beginning with the least significant predictor. The Full Model shows that 93.1 percent of “non-productive” are concordantly classified by the Logistic Model and 95 percent of “productive” are concordantly classified by the same model. The overall classification efficiency is 94.1 percent. Thus, 94.1 percent of the respondents were correctly identified into their respective clusters. The Classification Table a (Table 6) with 14 variables has an effective p-value of alpha = 0.20, with 94 percent accuracy 11
  • 12. and a good mixture of predictors such as: employment status, preparation for old age, walking, managing own money, shopping for own groceries, using public transportation, cooking family meals, home decorating, ironing clothes, caring for infants/children, washing clothes using washing machine, washing clothes by hand, dishwashing, and doing volunteer work. The Classification Table b (Table 7) with 11 predictors was a result of further deletion of the least significant variable. As a result, three other variables were deleted: employment status, preparation for old age, and volunteer work, leaving only life activities as predictors of productivity. Table 5. Full Model Showing the 25 Clustering Variables Classification Table Logistic-Predicted Percentage Productivity Group Correct NonProductive Productive Productivity Cluster NonProductive 161 12 93.0636 Productive 9 172 95.0276 Overall Percentage 94.0678 The cut value is .500 Variables in the Equation B S.E. Wald df Sig. Exp(B) Head of family -0.07360 0.55719 0.01745 1.00000 0.89491 0.92904 Employment status 1.63568 0.81396 4.03823 1.00000 0.04448 5.13293 Income 0.56825 0.60100 0.89399 1.00000 0.34440 1.76517 Preparation for old age 1.20478 0.59663 4.07757 1.00000 0.04346 3.33604 Dressing-up 19.85974 7202.85698 0.00001 1.00000 0.99780 421673546.89229 Eating 9.32784 7202.85853 0.00000 1.00000 0.99897 11246.82413 Bathing -2.03175 41.71401 0.00237 1.00000 0.96115 0.13111 Walking 0.98608 41.69646 0.00056 1.00000 0.98113 2.68072 Light household chores 0.22836 1.86287 0.01503 1.00000 0.90243 1.25654 Managing 1.87337 0.72819 6.61851 1.00000 0.01009 6.51020 Preparing for old age -3.21565 1.56648 4.21391 1.00000 0.04009 0.04013 Shopping groceries 3.08804 0.87897 12.34281 1.00000 0.00044 21.93399 Using public transportation 1.65616 0.84654 3.82744 1.00000 0.05042 5.23916 Cleaning the house 0.72461 1.19682 0.36656 1.00000 0.54488 2.06392 Cooking meals 3.20908 0.94830 11.45183 1.00000 0.00071 24.75642 Home Decorating 1.11888 0.64857 2.97615 1.00000 0.08450 3.06142 Ironing 4.27764 0.73252 34.10116 1.00000 0.00000 72.06987 Caring for infants/children 2.26907 0.57065 15.81079 1.00000 0.00007 9.67039 Washing Clothes-washing machine 1.51751 0.60944 6.20012 1.00000 0.01277 4.56087 Washing clothes by hand 1.63393 0.60584 7.27355 1.00000 0.00700 5.12397 Washing the dishes 1.83901 0.74201 6.14251 1.00000 0.01320 6.29030 Perceived Health -2.09528 0.73078 8.22071 1.00000 0.00414 0.12304 Membership in organization 0.66267 0.56741 1.36396 1.00000 0.24285 1.93997 Volunteer work 0.94411 0.58968 2.56341 1.00000 0.10936 2.57052 Perceived Productivity 0.11467 0.81185 0.01995 1.00000 0.88767 1.12150 12
  • 13. Constant -42.25201 10158.07219 0.00002 1.00000 0.99668 0.00000 Table 6. Classification Table with 14 Variables Classification Table Logistic-Predicted Percentage Productivity Group Correct NonProductive Productive Productivity Cluster NonProductive 160 13 92.5 Productive 9 172 95.0 Overall Percentage 93.8 The cut value is .500 Variables in the Equation B S.E. Wald df Sig. Exp(B) Employment Status 1.4243 0.6753 4.4486 1.0000 0.0349 4.1549 Prepared for Old Age 0.7588 0.5313 2.0396 1.0000 0.1532 2.1358 Walking 4.5917 1.8519 6.1479 1.0000 0.0132 98.6625 Managing own Money 1.9924 0.6743 8.7317 1.0000 0.0031 7.3331 Shopping for Groceries 2.4659 0.8014 9.4679 1.0000 0.0021 11.7740 Using Public Transportation 1.7397 0.7491 5.3938 1.0000 0.0202 5.6956 Cooking family meals 2.4571 0.7743 10.0704 1.0000 0.0015 11.6707 Home Decorating 1.0608 0.5535 3.6738 1.0000 0.0553 2.8888 Ironing Clothes 3.6348 0.5710 40.5192 1.0000 0.0000 37.8941 Caring for Infant/Children 1.9034 0.5034 14.2962 1.0000 0.0002 6.7090 Washing Clothes by Washing Machine 1.2632 0.5375 5.5227 1.0000 0.0188 3.5366 Washing Clothes by Hand 1.5427 0.5202 8.7955 1.0000 0.0030 4.6773 Washing the Dishes 1.9588 0.6619 8.7569 1.0000 0.0031 7.0906 Healthy-Perceived 0.6943 0.5054 1.8869 1.0000 0.1696 2.0022 Constant -19.5457 3.2775 35.5637 1.0000 0.0000 0.0000 13
  • 14. Table 7. Classification Table with 11 Variables Classification Table Observed Predicted Productivity Percentage Group Correct NonProductive Productive Productivity Cluster NonProductive 157 16 90.8 Productive 9 172 95.0 Overall Percentage 92.9 The cut value is .500 Variables in the Equation B S.E. Wald df Sig. Exp(B) Walking 4.1218 1.7404 5.6088 1.0000 0.0179 61.6693 Managing Own Money 2.0202 0.6503 9.6514 1.0000 0.0019 7.5401 Shopping for Groceries 2.2135 0.7406 8.9321 1.0000 0.0028 9.1481 Using Public Transportation 1.8509 0.7410 6.2391 1.0000 0.0125 6.3659 Cooking Family Meals 2.2796 0.7473 9.3051 1.0000 0.0023 9.7730 Home Decorating 1.0704 0.5386 3.9493 1.0000 0.0469 2.9165 Ironing Clothes 3.4044 0.5350 40.4943 1.0000 0.0000 30.0950 Caring for Infant/Children 1.9376 0.4875 15.7968 1.0000 0.0001 6.9422 Washing Clothes Using Washing Machine 1.1254 0.5167 4.7440 1.0000 0.0294 3.0814 Washing Clothes by Hand 1.5623 0.5111 9.3439 1.0000 0.0022 4.7696 Washing the Dishes 1.5934 0.5923 7.2377 1.0000 0.0071 4.9204 Constant -16.5552 2.6274 39.7021 1.0000 0.0000 0.0000 Based on the results of the study, two productivity-scoring instruments for senior citizens in Marikina City were proposed. 1. A 14-Predictor Productivity Model Scoring Instrument. This productivity- scoring instrument contains 14 variables. These are: 1. Employment status 2. Preparation for old age 3. Walking around the house 4. Managing own money 5. Shopping for own groceries 6. Using public transportation 7. Cooking family meals 8. Home decorating 9. Ironing clothes 10. Caring for infant/children 11. Washing clothes using washing machine 12. Washing clothes by hand 13. Washing the dishes 14. Volunteer work. 14
  • 15. This Productivity Model could be used if there is a need for more data to determine the productivity among senior citizens. Though it still contains three least significant predictors, it has a good mixture of various predictors that could give a more comprehensive productivity assessment. Moreover, the variables encompassed various contexts in which the elderly may find themselves engaged in. It consists of 14 questions based on the 14 variables with 94 percent accuracy level (Figure 5). 2. The 11-Predictor Productivity Model Scoring Instrument. This scoring instrument contains 11 significant predictors, which are all life activities. It is recommended for Marikina senior citizens with similar profile as the respondents of this study. These are: 1. Walking around the house 2. Managing own money 3. Shopping for own groceries 4. Using public transportation 5. Cooking 6. Home decorating 7. Ironing clothes 8. Caring for infant/children 9. Washing clothes using washing machine 10. Washing clothes by hand 11. Washing the dishes This productivity-scoring instrument has 93 percent accuracy. This is more preferred especially for the respondents of this study because it has only 11 questions representing the 11 highly significant variables that could be easily answered by the senior citizens. It is also easier when computing for the scores or results (Figure 6). 15
  • 16. Figure 5. Scoring instrument for the 14-Predictor Productivity Model PRODUCTIVITY SCORING INSTRUMENT For Marikina City Senior Citizens A. NAME: _________________________ Below are questions related to your ability to perform basic life and household activities. Read the questions carefully then put an x on the column that corresponds to your answer. B. SCORECARD Questions Yes No Score (1 if yes, 0 if no) 1. Are you employed? x 1 2. Did you prepare for your old age when you were younger? x 0 3. Do you walk around the house everyday? x 1 4. Do you manage your own money? x 1 5. Do you shop for your own groceries or personal items? x 1 6. Do you use public transportation without help from others? x 1 7. Do you cook meals for the family? x 1 8. Do you like decorating your home? x 0 9. Do you iron clothes for the family? x 1 10. Do you take care of infants or children/grandchildren? x 0 11. Do you wash your clothes using a washing machine? x 1 12. Do you wash clothes by hand? x 0 13. Do you wash the dishes? x 0 14. Are you currently involved in volunteer work? x 1 Equation: 1 P (" Pr oductive" ) = = 0.6721 = 67.21% 1 + exp{−(−19.5457 +1.4243(1) + 0.7588(0) + 4.5917(1) +1.9924(1) + 2.4659(1) +.. + 0.6943(1)} C. SCORE: PRODUCTIVE NON-PRODUCTIVE (If score is >.50) (If score <.50) Figure 6. Scoring instrument for the 11-Predictor Productivity Model 16
  • 17. PRODUCTIVITY SCORING INSTRUMENT For Marikina City Senior Citizens A. NAME: _________________________ Below are questions related to your ability to perform basic life and household activities. Read the questions carefully then put an x the column that corresponds to your answer. B. SCORECARD Questions Yes No Score (1 if yes, 0 if not) 1. Do you walk around the house everyday? x 1 2. Do you manage your own money? x 0 3. Do you shop for your own groceries or personal items? x 1 4. Do you use public transportation without help from others? x 1 5. Do you cook meals for the family? x 1 6. Do you like decorating your home? x 1 7. Do you iron clothes for the family? x 1 8. Do you take care of infants or children/grandchildren? x 0 9. Do you wash your clothes using a washing machine? x 1 10. Do you wash clothes by hand? x 0 11. Do you wash the dishes? x 1 Equation: 1 P (" Pr oductive" ) = 1 + exp{−( −16.552 + 4.1218(1) + 2.0202(1) + 2.2135(1) +1.8509(1) + 2.2796(0) + C. SCORE PRODUCTIVE NON PRODUCTIVE (If score is >.50) (If score <.50) CONCLUSION AND RECOMMENDATIONS At this age and time when senior citizens are increasing in number, plans on how to effectively address their needs are also underway. These plans include varied opportunities to sustain and improve further their productivity and maintain their contributions for their own welfare and those of others. They are aimed at encouraging them to strengthen their independence, prolong their spirit of productivity as they enjoy life to the fullest. The need for these programs has become 17
  • 18. more urgent because of the dramatic changes in family structures, roles and labor patterns, and migration, especially in the rapidly changing global environment. The movement of young people to urban areas, the shift from extended to nuclear families, and the increasing number of women joining the workforce are all developments that brought about new adjustments especially on the senior citizens caring for themselves. Globally, the senior citizens are now regarded as beneficiaries and active participants and contributors of developments (WHO, 2002). In fact, they are authentic sources of information, tested family values, beautiful traditions, and actual experiences. The senior citizens have fulfilled their part in creating the kind of life we are now enjoying. It is but just and fair to make them feel that we appreciate them for their own contributions through the programs designed to empower them even in their old age. No less than Pope John Paul II (Martino, 1999) in one of his celebrated prayers on July 25, 1999, calls us to always remember that: “By their very presence, older people remind everyone, especially the young that life on earth is a ‘parable’ with its own beginning and end: to find its fulfillment, life must be based on values that are not transient and superficial, but solid and profound. The so called ‘third age’ is …a value in itself by the very fact that life is prolonged and life itself is a gift of God.” Based on the findings of this study, the following recommendations are presented: 1. Using the results of this study, the Office of the Senior Citizens’ Affairs (OSCA) that works for the welfare of Marikina City senior citizens, could plan and conduct skills and personality development programs (healthy lifestyle, art appreciation, and creative leisure activities) to increase the senior citizens’ capabilities, empower, and build-up further their self-confidence. The senior citizens in their desire to participate in economic and other worthwhile activities can also utilize such skills. 2. Through the findings and analyses being offered in this research, the Marikina City government and its private institutions could put their acts together to formulate public policy, maintenance, monitoring, and evaluation for the sake of sustaining the democratic and productive participation of the senior citizens in community and nation building. 3. The study aimed at providing continued avenues where the senior citizens could remain as productive members of society. Therefore, the results of this study could be used as bases for developing better working conditions, health, and retirement benefits or schemes. Also, by recognizing the potential contributions of senior citizens, labor and business sectors in the city could look into the possibility of adjusting existing labor practices and policies that apply to ageing workers like adopting a much later retirement age or making retirement optional at age 65, so that they continue to actively participate in community development as they prepare themselves for a more economically sound retirement. 4. To sustain a beautiful Filipino tradition of respect for old age and increase appreciation for their contributions, topics on the elderly or later maturity should be incorporated in the basic and tertiary education Home Economics curriculum. Hopefully, such inclusion of topics will enable the young to develop a better consciousness for the welfare of the senior citizens. In 18
  • 19. addition, this will enable them to adopt a more informed consciousness about ageing. 5. Using the productivity-scoring instrument, being the major contribution of this research, a pilot test could be conducted among Marikina senior citizens to ensure its validity and reliability for self-assessment or self-evaluation. 6. The Marikina City government may utilize the Productivity-Scoring Instruments to assess the senior citizens’ capabilities and preparedness to undergo programs designed to provide them with sustained stimulating external environment in which they may function at high levels of attentiveness and productivity. By using these for profiling purposes, policies, practices, and provisions for the elderly may better be designed and implemented. 7. Considering the limitations of this research, a more in-depth study using a larger and more varied sample should be conducted to get a better picture of possible predictors of productivity among senior citizens not only in Marikina City but also all over the Philippines. This may become the basis of further transnational and cross-cultural analysis of productivity among the elderly. 8. The 14-Predictor Productivity Model maybe studied further in terms of its applicability and comprehensiveness because it covers not just the daily life activities but also economic activities and community work of the senior citizens. REFERENCES Cabigon, Josefina V. (1999). Idle, tired, and retired elderly– A myth the Filipino elderly: Towards a society for all ages. Rapid demographic change and the welfare of the elderly project, the 1996 Philippine elderly and near elderly survey. Demographic Research and Development Foundation (DRDF), Quezon City. Philippines. Havighurst, Robert J. (1964). Developmental tasks and education. New York: David McKay Company, Inc. pp. 92-100. Martino, Archbishop Renato R., Apostolic Nuncio (1999). Permanent Observer of the Holy See to the United Nations Before the Plenary of the General Assembly in its 54th session on the “Follow-Up to the international year of older persons.” New York, (October 5). http:/www.vatican.va/romancuria secretariatstate/documents/ rc seg-st doc 05101999 older- person en.html. National Statistics Office (2005). Senior citizens comprised six percent of the population: A special release based on the results of census 2000. Special Release No. 151, Date Released: March 18, 2005. http://www.census.gov.ph/data press release/2006/pr0620tx.html Ogena, Nimfa B. ( 2006). The low and slow ageing in the Philippines: Auspicious or challenging?. University of the Philippines Population Institute (UPPI). Sira, Warren (2006). Data on the registered senior citizens per barangay. Office for Senior Citizens Affairs, Marikina City Hall, Marikina City. Weller, Christian E., Wenger, Jeffrey, and Elise Gould (2004). Health insurance coverage in retirement: The erosion of retiree income security. http://www.epinet.org/content.cfm/books_health_ins_ret World Health Organization Brasilia (2002). Older people new power for development. UN 2002 http://www.who.int/hpr/ageing/international_day_en.html Yen, Duen His (1999). Johari Window. http:www.noogenesis.com/game_theory/johari/johari_window.html 19
  • 20. About the Author Ines Alcantara-de Guzman is the current Assistant Principal for Student Affairs of MCHS, where she has been serving in the last 29 years. She obtained her bachelor’s, master’s, and doctoral degrees in Home Economics from the College of Home Economics of the University of the Philippines. She has written several textbooks in Home Economics and Livelihood Education (HELE) Grades 4-6, Technology and Home Economics (THE) Years I-IV, and Technology and Livelihood Education (TLE) Years I-II. She writes a quarterly journal for TLE Years I-IV entitled Vitality Journal published by Innovative Educational Materials, Inc., She has conducted various seminars and workshops for HELE, THE/TLE teachers. 20
  • 21. About the Author Ines Alcantara-de Guzman is the current Assistant Principal for Student Affairs of MCHS, where she has been serving in the last 29 years. She obtained her bachelor’s, master’s, and doctoral degrees in Home Economics from the College of Home Economics of the University of the Philippines. She has written several textbooks in Home Economics and Livelihood Education (HELE) Grades 4-6, Technology and Home Economics (THE) Years I-IV, and Technology and Livelihood Education (TLE) Years I-II. She writes a quarterly journal for TLE Years I-IV entitled Vitality Journal published by Innovative Educational Materials, Inc., She has conducted various seminars and workshops for HELE, THE/TLE teachers. 20
  • 22. About the Author Ines Alcantara-de Guzman is the current Assistant Principal for Student Affairs of MCHS, where she has been serving in the last 29 years. She obtained her bachelor’s, master’s, and doctoral degrees in Home Economics from the College of Home Economics of the University of the Philippines. She has written several textbooks in Home Economics and Livelihood Education (HELE) Grades 4-6, Technology and Home Economics (THE) Years I-IV, and Technology and Livelihood Education (TLE) Years I-II. She writes a quarterly journal for TLE Years I-IV entitled Vitality Journal published by Innovative Educational Materials, Inc., She has conducted various seminars and workshops for HELE, THE/TLE teachers. 20