Division Competency Analyis (Compliation)
•Transferir como XLS, PDF•
0 gostou•238 visualizações


Recomendados
Mais conteúdo relacionado
Mais de Laurence Yap M.A. (UM) CHRM
Mais de Laurence Yap M.A. (UM) CHRM (20)
Último
Último (20)
Division Competency Analyis (Compliation)
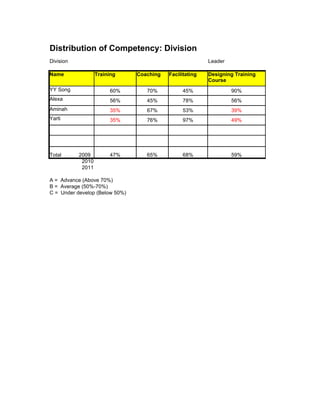
- 1. Distribution of Competency: Division Division Leader Name Training Coaching Facilitating Designing Training Course YY Song 60% 70% 45% 90% Alexa 56% 45% 78% 56% Aminah 35% 67% 53% 39% Yarti 35% 76% 97% 49% Total 2009 47% 65% 68% 59% 2010 2011 A = Advance (Above 70%) B = Average (50%-70%) C = Under develop (Below 50%)
- 2. Coordinating Total 2010 2011 78% 69% 69% 61% 58% 50% 56% 63% 65% 61%
- 3. Distribution of Competency: Division Division Leader Name Training Coaching Facilitating Designing Training Course YY Song 60% 70% 45% 90% Alexa 56% 45% 78% 56% Aminah 35% 67% 53% 39% Yarti 35% 76% 97% 49% Total 47% 65% 68% 59% A = Advance (Above 70%) B = Average (50%-70%) C = Under develop (Below 50%)
- 4. Coordinating Total 78% 69% 69% 61% 58% 50% 56% 63% 65% 61%
- 5. Distribution of Competency: Division Division Leader Name Training Coaching Facilitating Designing Training Course YY Song 60% 70% 45% 90% Alexa 56% 45% 78% 56% Aminah 35% 67% 53% 39% Yarti 35% 76% 97% 49% Total 47% 65% 68% 59% A = Advance (Above 70%) B = Average (50%-70%) C = Under develop (Below 50%)
- 6. Coordinating Total 78% 69% 69% 61% 58% 50% 56% 63% 65% 61%
- 7. Distribution of Competency: Division Division Leader Name Training Coaching Facilitating Designing Training Course YY Song 60% 70% 45% 90% Alexa 56% 45% 78% 56% Aminah 35% 67% 53% 39% Yarti 35% 76% 97% 49% Total 47% 65% 68% 59% A = Advance (Above 70%) B = Average (50%-70%) C = Under develop (Below 50%)
- 8. Coordinating Total 78% 69% 69% 61% 58% 50% 56% 63% 65% 61%
- 9. Distribution of Competency: Division Division Leader Name Training Coaching Facilitating Designing Training Course YY Song 60% 70% 45% 90% Alexa 56% 45% 78% 56% Aminah 35% 67% 53% 39% Yarti 35% 76% 97% 49% Total 47% 65% 68% 59% A = Advance (Above 70%) B = Average (50%-70%) C = Under develop (Below 50%)
- 10. Coordinating Total 78% 69% 69% 61% 58% 50% 56% 63% 65% 61%
- 11. Distribution of Competency: Division Division Name Total 2009 Total 2010 Total 2011 YY Song 69% 75% 82% Alexa 61% 67% 72% Aminah 50% 58% 63% Yarti 63% 69% 78% Total 2009 65% 67% 74% A = Advance (Above 70%) B = Average (50%-70%) C = Under develop (Below 50%)
- 13. Distribution of Competency: Division Division Leader Name Training Coaching Facilitating Designing Training Course YY Song 60% 70% 45% 90% Alexa 56% 45% 78% 56% Aminah 35% 67% 53% 39% Yarti 35% 76% 97% 49% Total 47% 65% 68% 59% A = Advance (Above 70%) B = Average (50%-70%) C = Under develop (Below 50%)
- 14. Coordinating Total 78% 69% 69% 61% 58% 50% 56% 63% 65% 61%
- 15. Distribution of Competency: Division Department: HRD Competency Planning Organizing Staffing Budgeting Project Management KW Cheah Peter Chew Malar Ramond Chin Ros Salbiah Kalimuddin A = Advance (Above 70%) B = Average (50%-70%) C = Under develop (Below 50%)
- 17. Competency Analysis Division: Lean Office Competency Analysis Area Need to Improve (C) Area that Perform Averagely (B) Planning Organizing Staffing Budgeting Project Management Internal Consutling Note A Project Opportiunities to improve skills, Conference, Benchmarking B Opprtunities to apply the skills C Attend Training courses or coaching A = Advance (Above 70%) B = Average (50%-70%) C = Under develop (Below 50%)
- 18. Area that doing well (A)