SlideShare uma empresa Scribd logo
1 de 4
Baixar para ler offline
Layers of the Atmosphere
By Jack Fearing, Lincoln Junior High School, Hibbing, Minnesota

Teacher’s Page
Objective: To discover how the atmosphere can be divided into layers based on
temperature changes at different heights, by making a graph. Students must read the
background material, plot data points, and determine where layers begin and end from
their comprehension of the reading material.

Grade Level: 6-10

Time Required: 35 - 45 minutes

Materials: No additional materials are needed.

Background: Students should know how to plot data on a graph with negative numbers.
Go over the instructions carefully, reading the background paragraph aloud. Watch them
carefully during the activity, making sure graphing is correct. They may need help
understanding that they find the layer divisions based on what they read in the text.

Evaluation: Students should be graded on the correct plotting of the points in the table
onto the graph. They should also label eight items on the graph: troposphere, tropopause,
stratosphere, stratopause, mesosphere, mesopause, thermosphere and ozone layer.
Questions:
1. The variations in temperature changes.
2.      troposphere: decrease
        stratosphere: increase
        mesosphere: decrease
        thermosphere: increase
3.      tropopause: about 12-18 km              about –60
        stratopause: about 46-54 km             about –2 to 0
        mesopause: about 85-90 km               about –90
4. The temperature increases in the stratosphere due to ozone layer capturing ultraviolet
radiation. The temperature decreases in the mesosphere since there is no ozone and the
amount of air is decreasing.
5. As solar energy hits the earth’s surface, it is converted into heat. That heat radiates
upward from the earth’s surface. The farther away from the warm earth’s surface we go,
the less heat we feel until we hit the ozone layer in the stratosphere. The temperature of
the troposphere therefore decreases steadily until the stratosphere.

By Jack Fearing, Lincoln Junior High School, Hibbing, Minnesota

Edited by Christine McLelland, Subaru Distinguished Earth Science Educator, 2002-
2003, Geological Society of America, 3300 Penrose Place, Boulder, CO 80301
Student’s Pages follow:
Name ________________________

                    Layers of the Atmosphere
By Jack Fearing, Lincoln Junior High School, Hibbing, Minnesota

OBJECTIVE: To discover how the atmosphere can be divided into layers based on
temperature changes at different heights, by making a graph.

BACKGROUND:
The atmosphere can be divided into four layers based on temperature variations. The
layer closest to the Earth is called the troposphere. Above this layer is the stratosphere,
followed by the mesosphere, then the thermosphere. The upper boundaries between these
layers are known as the tropopause, the stratopause, and the mesopause, respectively.

Temperature variations in the four layers are due to the way solar energy is absorbed as it
moves downward through the atmosphere. The Earth’s surface is the primary absorber of
solar energy. Some of this energy is reradiated by the Earth as heat, which warms the
overlying troposphere. The global average temperature in the troposphere rapidly
decreases with altitude until the tropopause, the boundary between the troposphere and
the stratosphere.

The temperature begins to increase with altitude in the stratosphere. This warming is
caused by a form of oxygen called ozone (O 3 ) absorbing ultraviolet radiation from the
sun. Ozone protects us from most of the sun’s ultraviolet radiation, which can cause
cancer, genetic mutations, and sunburn. Scientists are concerned that human activity is
contributing to a decrease in stratospheric ozone. Nitric oxide, which is the exhaust of
high- flying jets, and chlorofluorocarbons (CFCs), which are used as refrigerants, may
contribute to ozone depletion.

At the stratopause, the temperature stops increasing with altitude. The overlying
mesosphere does not absorb solar radiation, so the temperature decreases with altitude.
At the mesopause, the temperature begins to increase with altitude, and this trend
continues in the thermosphere. Here solar radiation first hits the Earth’s atmosphere and
heats it. Because the atmosphere is so thin, a thermometer cannot measure the
temperature accurately and special instruments are needed.

DIRECTIONS:
1. Table 1 contains the average temperature readings at various altitudes in the Earth’s
atmosphere. Plot this data on the graph on the worksheet, and connect adjacent points
with a smooth curve. Be careful to plot the negative temperature numbers correctly.
This profile provides a general picture of temperature at any given time and place;
however, the actual temperature may deviate from the average values, particularly in the
lower atmosphere.
TABLE 1
                  Average Temperature Readings at Various Altitudes

        Altitude (km)     Temp (o C)         Altitude (km)      Temp (o C)
        0                 15                 52                 -2
        5                 -18                55                 -7
        10                -49                60                 -17
        12                -56                65                 -33
        20                -56                70                 -54
        25                -51                75                 -65
        30                -46                80                 -79
        35                -37                84                 -86
        40                -22                92                 -86
        45                -8                 95                 -81
        48                -2                 100                -72

2. Label the different layers of the atmosphere and the separating boundaries between
each layer.

3. Mark the general location of the ozone layer. You should place eight words on your
graph in the correct locations: troposphere, tropopause, stratosphere, stratopause,
mesosphere, mesopause, thermosphere and ozone layer.

QUESTIONS:
1. What is the basis for dividing the atmosphere into four layers?


2. Does the temperature increase or decrease with altitude in the:

       troposphere? _____________                    stratosphere? ________________

       mesosphere? _____________                     thermosphere? _______________

3. What is the approximate height and temperature of the:

       tropopause: _______________           _____________

       stratopause: _______________          _____________

       mesopause: _______________            _____________

4. What causes the temperature to increase with height through the stratosphere, and
decrease with height through the mesosphere?


5. What causes the temperature to decrease with height in the troposphere?
Graph of Temperature at Various Altitudes

ALTITUDE (km above sea level – Y-axis)
 100


  95


  90


  85


  80


  75


  70


  65


  60


  55


  50


  45


  40


  35


  30


  25


  20


  15


  10


   5


   0
   -100   -90     -80    -70   -60       -50   -40   -30     -20   -10   -5   0   10   20
                                         Temperature (o C)

Mais conteúdo relacionado

Mais procurados

Seventh Grade Science Curriculum Map
Seventh Grade Science Curriculum MapSeventh Grade Science Curriculum Map
Seventh Grade Science Curriculum Map
Isaac_Schools_5
 
Distinguishing between useful and harmful materials
Distinguishing between useful and harmful materialsDistinguishing between useful and harmful materials
Distinguishing between useful and harmful materials
YhanzieCapilitan
 

Mais procurados (20)

Third Grading Module 5 Heat
Third Grading Module 5 HeatThird Grading Module 5 Heat
Third Grading Module 5 Heat
 
SCIENCE7: Components of Scientific Investigation
SCIENCE7: Components of Scientific InvestigationSCIENCE7: Components of Scientific Investigation
SCIENCE7: Components of Scientific Investigation
 
ELECTRICITY grade 8 DEMO CO
ELECTRICITY grade 8 DEMO COELECTRICITY grade 8 DEMO CO
ELECTRICITY grade 8 DEMO CO
 
Force and its effects
Force and its effectsForce and its effects
Force and its effects
 
Earthquakes and Fault Grade 8
Earthquakes and Fault Grade 8Earthquakes and Fault Grade 8
Earthquakes and Fault Grade 8
 
Lesson 3 materials that undergo decay
Lesson 3   materials that undergo decayLesson 3   materials that undergo decay
Lesson 3 materials that undergo decay
 
Science 8_3rd Q_DLL.docx
Science 8_3rd Q_DLL.docxScience 8_3rd Q_DLL.docx
Science 8_3rd Q_DLL.docx
 
01 how does light travel
01 how does light travel01 how does light travel
01 how does light travel
 
Transfer of heat: Conduction & Convection - Class 7
Transfer of heat: Conduction & Convection - Class 7Transfer of heat: Conduction & Convection - Class 7
Transfer of heat: Conduction & Convection - Class 7
 
States of matter (Worksheet 8)
States of matter   (Worksheet 8)States of matter   (Worksheet 8)
States of matter (Worksheet 8)
 
contextualized powerpoint ptresentation in Science 8 first quarter WORK
contextualized powerpoint ptresentation in Science 8 first quarter WORKcontextualized powerpoint ptresentation in Science 8 first quarter WORK
contextualized powerpoint ptresentation in Science 8 first quarter WORK
 
MIXTURES(APPEARANCE AND USES)
MIXTURES(APPEARANCE AND USES)MIXTURES(APPEARANCE AND USES)
MIXTURES(APPEARANCE AND USES)
 
SCIENCE7:Types of Solutions
SCIENCE7:Types of SolutionsSCIENCE7:Types of Solutions
SCIENCE7:Types of Solutions
 
Seventh Grade Science Curriculum Map
Seventh Grade Science Curriculum MapSeventh Grade Science Curriculum Map
Seventh Grade Science Curriculum Map
 
SEPARATION OF MIXTURES FOR CLASS VI
SEPARATION OF MIXTURES FOR CLASS VISEPARATION OF MIXTURES FOR CLASS VI
SEPARATION OF MIXTURES FOR CLASS VI
 
Module 1 Scientific Method Ppt
Module 1 Scientific Method PptModule 1 Scientific Method Ppt
Module 1 Scientific Method Ppt
 
Sources of Light
Sources of LightSources of Light
Sources of Light
 
Distinguishing between useful and harmful materials
Distinguishing between useful and harmful materialsDistinguishing between useful and harmful materials
Distinguishing between useful and harmful materials
 
Process skills in Science
Process skills in ScienceProcess skills in Science
Process skills in Science
 
Grade 7, Quarter 4.pdf
Grade 7, Quarter 4.pdfGrade 7, Quarter 4.pdf
Grade 7, Quarter 4.pdf
 

Destaque

Atmosphere Activity
Atmosphere ActivityAtmosphere Activity
Atmosphere Activity
David Genis
 
Earth’s atmosphere
Earth’s  atmosphereEarth’s  atmosphere
Earth’s atmosphere
itutor
 
Course Organizer
Course OrganizerCourse Organizer
Course Organizer
april_lamb
 
Layers of the Atmosphere
Layers of the AtmosphereLayers of the Atmosphere
Layers of the Atmosphere
Jan Parker
 
Latitude And Longitude
Latitude And LongitudeLatitude And Longitude
Latitude And Longitude
guestfeb483d0
 
Presentation watershed
Presentation watershedPresentation watershed
Presentation watershed
akshitakohli
 
Greenhouse Effect.
Greenhouse Effect.Greenhouse Effect.
Greenhouse Effect.
SabaAnwar11
 
Detailed lesson plan science
Detailed lesson plan   scienceDetailed lesson plan   science
Detailed lesson plan science
Eric Cayetano
 

Destaque (20)

Atmosphere Activity
Atmosphere ActivityAtmosphere Activity
Atmosphere Activity
 
Lesson plan 1
Lesson plan 1Lesson plan 1
Lesson plan 1
 
Layers of the atmosphere
Layers of the atmosphereLayers of the atmosphere
Layers of the atmosphere
 
Layers of the atmosphere
Layers of the atmosphereLayers of the atmosphere
Layers of the atmosphere
 
Earth’s atmosphere
Earth’s  atmosphereEarth’s  atmosphere
Earth’s atmosphere
 
Layers of the atmosphere
Layers of the atmosphereLayers of the atmosphere
Layers of the atmosphere
 
Course Organizer
Course OrganizerCourse Organizer
Course Organizer
 
Watershed management
Watershed  managementWatershed  management
Watershed management
 
Layers of the Atmosphere
Layers of the AtmosphereLayers of the Atmosphere
Layers of the Atmosphere
 
The Atmosphere
The AtmosphereThe Atmosphere
The Atmosphere
 
Latitude And Longitude
Latitude And LongitudeLatitude And Longitude
Latitude And Longitude
 
Green house effect
Green house effectGreen house effect
Green house effect
 
Lesson plan 9th grade junior high school
Lesson plan 9th grade junior high schoolLesson plan 9th grade junior high school
Lesson plan 9th grade junior high school
 
Presentation watershed
Presentation watershedPresentation watershed
Presentation watershed
 
Watershed management
Watershed managementWatershed management
Watershed management
 
Detailed Lesson Plan in Science and Health grade 3
Detailed Lesson Plan in Science and Health grade 3Detailed Lesson Plan in Science and Health grade 3
Detailed Lesson Plan in Science and Health grade 3
 
Greenhouse Effect.
Greenhouse Effect.Greenhouse Effect.
Greenhouse Effect.
 
Lesson plan in biology
Lesson plan in biologyLesson plan in biology
Lesson plan in biology
 
Detailed lesson plan science
Detailed lesson plan   scienceDetailed lesson plan   science
Detailed lesson plan science
 
Detailed Lesson Plan in Science and Health Grade 3 Sense Organ
Detailed Lesson Plan in Science and Health Grade 3 Sense OrganDetailed Lesson Plan in Science and Health Grade 3 Sense Organ
Detailed Lesson Plan in Science and Health Grade 3 Sense Organ
 

Semelhante a Layers Of Atmosphere

The Atmosphere (R)
The Atmosphere (R)The Atmosphere (R)
The Atmosphere (R)
llalma
 
Weather Part 2
Weather Part 2Weather Part 2
Weather Part 2
parrc
 
1 LAB MODULE 5 GLOBAL TEMPERATURE PATTERNS Note P
1  LAB MODULE 5 GLOBAL TEMPERATURE PATTERNS Note P1  LAB MODULE 5 GLOBAL TEMPERATURE PATTERNS Note P
1 LAB MODULE 5 GLOBAL TEMPERATURE PATTERNS Note P
MartineMccracken314
 
1 LAB MODULE 5 GLOBAL TEMPERATURE PATTERNS Note P
1  LAB MODULE 5 GLOBAL TEMPERATURE PATTERNS Note P1  LAB MODULE 5 GLOBAL TEMPERATURE PATTERNS Note P
1 LAB MODULE 5 GLOBAL TEMPERATURE PATTERNS Note P
SilvaGraf83
 

Semelhante a Layers Of Atmosphere (20)

Layers of Atmosphere WS Graph.pdf
Layers of Atmosphere WS Graph.pdfLayers of Atmosphere WS Graph.pdf
Layers of Atmosphere WS Graph.pdf
 
Earth's Atmosphere.docx
Earth's Atmosphere.docxEarth's Atmosphere.docx
Earth's Atmosphere.docx
 
The Atmosphere
The AtmosphereThe Atmosphere
The Atmosphere
 
The Atmosphere (R)
The Atmosphere (R)The Atmosphere (R)
The Atmosphere (R)
 
Detailed Lesson Plan - Earth's Atmosphere
Detailed Lesson Plan - Earth's AtmosphereDetailed Lesson Plan - Earth's Atmosphere
Detailed Lesson Plan - Earth's Atmosphere
 
my demo for grade 7 final ppt super final.pptx
my demo for grade 7 final ppt super final.pptxmy demo for grade 7 final ppt super final.pptx
my demo for grade 7 final ppt super final.pptx
 
Weather Part 2
Weather Part 2Weather Part 2
Weather Part 2
 
layers of the atmosphere.pptx
layers of the atmosphere.pptxlayers of the atmosphere.pptx
layers of the atmosphere.pptx
 
UNIT 05.- LA ATMOFERA _Worksheet_
UNIT 05.- LA ATMOFERA _Worksheet_UNIT 05.- LA ATMOFERA _Worksheet_
UNIT 05.- LA ATMOFERA _Worksheet_
 
Atmosphere & Pollution
Atmosphere & PollutionAtmosphere & Pollution
Atmosphere & Pollution
 
3. Atmospheric circulation
3. Atmospheric circulation3. Atmospheric circulation
3. Atmospheric circulation
 
The layers of the Atmosphere
The layers of the AtmosphereThe layers of the Atmosphere
The layers of the Atmosphere
 
Lesson-10 (1).pptx
Lesson-10 (1).pptxLesson-10 (1).pptx
Lesson-10 (1).pptx
 
1 LAB MODULE 5 GLOBAL TEMPERATURE PATTERNS Note P
1  LAB MODULE 5 GLOBAL TEMPERATURE PATTERNS Note P1  LAB MODULE 5 GLOBAL TEMPERATURE PATTERNS Note P
1 LAB MODULE 5 GLOBAL TEMPERATURE PATTERNS Note P
 
1 LAB MODULE 5 GLOBAL TEMPERATURE PATTERNS Note P
1  LAB MODULE 5 GLOBAL TEMPERATURE PATTERNS Note P1  LAB MODULE 5 GLOBAL TEMPERATURE PATTERNS Note P
1 LAB MODULE 5 GLOBAL TEMPERATURE PATTERNS Note P
 
ATMOSPHERE PPT.pptx
ATMOSPHERE PPT.pptxATMOSPHERE PPT.pptx
ATMOSPHERE PPT.pptx
 
AGR 102 lec2.ppt
AGR 102 lec2.pptAGR 102 lec2.ppt
AGR 102 lec2.ppt
 
Unit 4. Landscape of the world
Unit 4. Landscape of the world Unit 4. Landscape of the world
Unit 4. Landscape of the world
 
The International Journal of Engineering and Science (The IJES)
The International Journal of Engineering and Science (The IJES)The International Journal of Engineering and Science (The IJES)
The International Journal of Engineering and Science (The IJES)
 
Layers of_atmosphere
Layers of_atmosphereLayers of_atmosphere
Layers of_atmosphere
 

Mais de David Genis (20)

WCRage Handbook
WCRage HandbookWCRage Handbook
WCRage Handbook
 
Wc rage handbook
Wc rage handbookWc rage handbook
Wc rage handbook
 
Metric conversion house
Metric conversion houseMetric conversion house
Metric conversion house
 
The everyday metric system
The everyday metric systemThe everyday metric system
The everyday metric system
 
Experimental Design
Experimental DesignExperimental Design
Experimental Design
 
Class policies and procedures
Class policies and proceduresClass policies and procedures
Class policies and procedures
 
Class policies and procedures
Class policies and proceduresClass policies and procedures
Class policies and procedures
 
Class policies and procedures
Class policies and proceduresClass policies and procedures
Class policies and procedures
 
Class policies and procedures
Class policies and proceduresClass policies and procedures
Class policies and procedures
 
Work
WorkWork
Work
 
Electricity
ElectricityElectricity
Electricity
 
Energy forms and_changes
Energy forms and_changesEnergy forms and_changes
Energy forms and_changes
 
0708 types of_energy
0708 types of_energy0708 types of_energy
0708 types of_energy
 
Work
WorkWork
Work
 
Work
WorkWork
Work
 
Cub simple lesson01_presentation
Cub simple lesson01_presentationCub simple lesson01_presentation
Cub simple lesson01_presentation
 
Ttl7 09
Ttl7 09Ttl7 09
Ttl7 09
 
Lightning noaa
Lightning noaaLightning noaa
Lightning noaa
 
Presentation3
Presentation3Presentation3
Presentation3
 
Humidity
HumidityHumidity
Humidity
 

Layers Of Atmosphere

  • 1. Layers of the Atmosphere By Jack Fearing, Lincoln Junior High School, Hibbing, Minnesota Teacher’s Page Objective: To discover how the atmosphere can be divided into layers based on temperature changes at different heights, by making a graph. Students must read the background material, plot data points, and determine where layers begin and end from their comprehension of the reading material. Grade Level: 6-10 Time Required: 35 - 45 minutes Materials: No additional materials are needed. Background: Students should know how to plot data on a graph with negative numbers. Go over the instructions carefully, reading the background paragraph aloud. Watch them carefully during the activity, making sure graphing is correct. They may need help understanding that they find the layer divisions based on what they read in the text. Evaluation: Students should be graded on the correct plotting of the points in the table onto the graph. They should also label eight items on the graph: troposphere, tropopause, stratosphere, stratopause, mesosphere, mesopause, thermosphere and ozone layer. Questions: 1. The variations in temperature changes. 2. troposphere: decrease stratosphere: increase mesosphere: decrease thermosphere: increase 3. tropopause: about 12-18 km about –60 stratopause: about 46-54 km about –2 to 0 mesopause: about 85-90 km about –90 4. The temperature increases in the stratosphere due to ozone layer capturing ultraviolet radiation. The temperature decreases in the mesosphere since there is no ozone and the amount of air is decreasing. 5. As solar energy hits the earth’s surface, it is converted into heat. That heat radiates upward from the earth’s surface. The farther away from the warm earth’s surface we go, the less heat we feel until we hit the ozone layer in the stratosphere. The temperature of the troposphere therefore decreases steadily until the stratosphere. By Jack Fearing, Lincoln Junior High School, Hibbing, Minnesota Edited by Christine McLelland, Subaru Distinguished Earth Science Educator, 2002- 2003, Geological Society of America, 3300 Penrose Place, Boulder, CO 80301 Student’s Pages follow:
  • 2. Name ________________________ Layers of the Atmosphere By Jack Fearing, Lincoln Junior High School, Hibbing, Minnesota OBJECTIVE: To discover how the atmosphere can be divided into layers based on temperature changes at different heights, by making a graph. BACKGROUND: The atmosphere can be divided into four layers based on temperature variations. The layer closest to the Earth is called the troposphere. Above this layer is the stratosphere, followed by the mesosphere, then the thermosphere. The upper boundaries between these layers are known as the tropopause, the stratopause, and the mesopause, respectively. Temperature variations in the four layers are due to the way solar energy is absorbed as it moves downward through the atmosphere. The Earth’s surface is the primary absorber of solar energy. Some of this energy is reradiated by the Earth as heat, which warms the overlying troposphere. The global average temperature in the troposphere rapidly decreases with altitude until the tropopause, the boundary between the troposphere and the stratosphere. The temperature begins to increase with altitude in the stratosphere. This warming is caused by a form of oxygen called ozone (O 3 ) absorbing ultraviolet radiation from the sun. Ozone protects us from most of the sun’s ultraviolet radiation, which can cause cancer, genetic mutations, and sunburn. Scientists are concerned that human activity is contributing to a decrease in stratospheric ozone. Nitric oxide, which is the exhaust of high- flying jets, and chlorofluorocarbons (CFCs), which are used as refrigerants, may contribute to ozone depletion. At the stratopause, the temperature stops increasing with altitude. The overlying mesosphere does not absorb solar radiation, so the temperature decreases with altitude. At the mesopause, the temperature begins to increase with altitude, and this trend continues in the thermosphere. Here solar radiation first hits the Earth’s atmosphere and heats it. Because the atmosphere is so thin, a thermometer cannot measure the temperature accurately and special instruments are needed. DIRECTIONS: 1. Table 1 contains the average temperature readings at various altitudes in the Earth’s atmosphere. Plot this data on the graph on the worksheet, and connect adjacent points with a smooth curve. Be careful to plot the negative temperature numbers correctly. This profile provides a general picture of temperature at any given time and place; however, the actual temperature may deviate from the average values, particularly in the lower atmosphere.
  • 3. TABLE 1 Average Temperature Readings at Various Altitudes Altitude (km) Temp (o C) Altitude (km) Temp (o C) 0 15 52 -2 5 -18 55 -7 10 -49 60 -17 12 -56 65 -33 20 -56 70 -54 25 -51 75 -65 30 -46 80 -79 35 -37 84 -86 40 -22 92 -86 45 -8 95 -81 48 -2 100 -72 2. Label the different layers of the atmosphere and the separating boundaries between each layer. 3. Mark the general location of the ozone layer. You should place eight words on your graph in the correct locations: troposphere, tropopause, stratosphere, stratopause, mesosphere, mesopause, thermosphere and ozone layer. QUESTIONS: 1. What is the basis for dividing the atmosphere into four layers? 2. Does the temperature increase or decrease with altitude in the: troposphere? _____________ stratosphere? ________________ mesosphere? _____________ thermosphere? _______________ 3. What is the approximate height and temperature of the: tropopause: _______________ _____________ stratopause: _______________ _____________ mesopause: _______________ _____________ 4. What causes the temperature to increase with height through the stratosphere, and decrease with height through the mesosphere? 5. What causes the temperature to decrease with height in the troposphere?
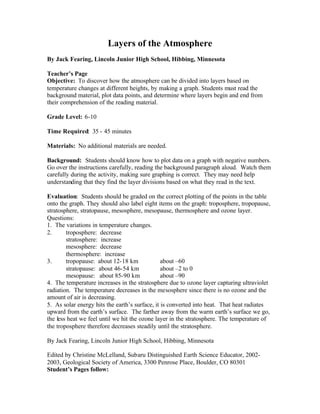
  • 4. Graph of Temperature at Various Altitudes ALTITUDE (km above sea level – Y-axis) 100 95 90 85 80 75 70 65 60 55 50 45 40 35 30 25 20 15 10 5 0 -100 -90 -80 -70 -60 -50 -40 -30 -20 -10 -5 0 10 20 Temperature (o C)