1. Canadian Update
Last Updated: July 2010 Liability
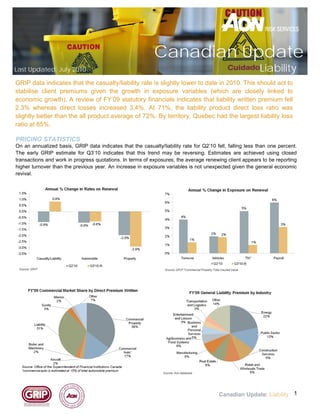
GRIP data indicates that the casualty/liability rate is slightly lower to date in 2010. This should act to
stabilise client premiums given the growth in exposure variables (which are closely linked to
economic growth). A review of FY’09 statutory financials indicates that liability written premium fell
2.3% whereas direct losses increased 3.4%. At 71%, the liability product direct loss ratio was
slightly better than the all product average of 72%. By territory, Quebec had the largest liability loss
ratio at 85%.
PRICING STATISTICS
On an annualized basis, GRIP data indicates that the casualty/liability rate for Q2’10 fell, falling less than one percent.
The early GRIP estimate for Q3’10 indicates that this trend may be reversing. Estimates are achieved using closed
transactions and work in progress quotations. In terms of exposures, the average renewing client appears to be reporting
higher turnover than the previous year. An increase in exposure variables is not unexpected given the general economic
revival.
Canadian Update: Liability 1
2. STATISTICS and FINANCIALS
Liability exposure variables are closely correlated with the general economic performance. As such, the recent
return to economic growth should increase the total liability insurance premium written, provided there are no
large rate decreases. As shown below, share prices, listed company revenue, and national employment have
all experienced annualized growth in Q1’10.
Quarterly Update
Liability written premium fell 2.3% in FY'09, in line with the general commercial market. Relative to other
Q3/09 Construction
insurance lines, the liability market has not expanded much, growing only 3% since 2005 compared to 9% for
the general commercial market. The Lloyd's market was the largest writer of both liability lines and all
commercial premium at a national level.
The FY’09 Canadian direct loss ratio for liability of 71% was only slightly below the all product average of 72%.
However the two largest markets, Ontario and Quebec, had a direct loss ratio significantly above average, at
79% and 85% respectively.
LEGAL FEES: HOURLY RATES ($ Average)
Year of Call 2009 2005 2000
National 185 250 317
Atlantic-Quebec Region 170 224 271
Ontario 203 258 333
Western Region 178 263 327
1-4 lawyers in firm 201 239 294
5-25 lawyers in firm 173 250 328
26+ lawyers in firm 186 263 359
Source: Canadian Lawyer Magazine, Canadian Lawyer's
2010 Legal fees survey
Consumer Price Inflation Indices
Cost of Living Cost of Goods Cost of Services Health Care
Index Percent Change Index Percent Change Index Percent Change Index Percent Change
Q1'05 106.3 2% 105.2 3% 107.4 2% 105 3%
Q1'06 108.6 2% 107.2 2% 109.9 2% 107.6 2%
Q1'07 111.1 2% 108.8 1% 113.4 3% 109.6 2%
Q1'08 112.6 1% 108.1 -1% 117.1 3% 111.6 2%
Q1'09 114 1% 107.6 0% 120.4 3% 113.6 2%
Q1'10 115.6 1% 109 1% 122.2 1% 116.8 3%
2007-2010 % Change 4% 0% 8% 7%
2005-2010 % Change 9% 4% 14% 11%
Source: Statistics Canada
Canadian update: Liability 2
3. Quarterly Update
Q3/09 Construction
Canada FY'09 $Mn
Top 5 Underwriters by DPW GROUP DPW DCI DLR APLR FSR
Lloyd's Underwriters Lloyd's 671 253 38% 52% A
Chartis Ins Co (CAN) AIG 359 290 72% 66% A
Aviva Ins Co (CAN) Aviva 318 316 102% 70% A-
Intact Ins Co ING Grp 272 165 62% 67% A+
Zurich Ins Co Zurich 251 129 49% 59% A
Total 4,450 2,734 71% 72%
Source: The Office of the Superintendent of Financial Institutions Canada (OSFI)
Alberta FY'09 $Mn British Columbia FY'09 $Mn
Top 5 Underwriters by DPW GROUP DPW DCI DLR APLR FSR Top 5 Underwriters by DPW GROUP DPW DCI DLR APLR FSR
Lloyd's Underwriters Lloyd's 120 56 47% 40% A Lloyd's Underwriters Lloyd's 134 63 47% 59% A
Chartis Ins Co (CAN) AIG 66 n/m n/a 26% A American Bankers Ins Co of Florida Assurant Inc 51 12 25% 20% A
Zurich Ins Co Zurich 52 23 41% 50% A AXA Pacific Ins Co AXA 45 23 50% 54% A
Chubb Ins Co (CAN) Chubb 44 26 58% 53% A++ Chartis Ins Co (CAN) AIG 36 43 101% 82% A
AXA Pacific Ins Co AXA 42 26 60% 51% A Aviva Ins Co (CAN) Aviva 34 17 50% 57% A-
Alberta Total 723 257 42% 60% British Columbia Total 646 375 71% 60%
Manitoba FY'09 $Mn New Brunswick FY'09 $Mn
Top 5 Underwriters by DPW GROUP DPW DCI DLR APLR FSR Top 5 Underwriters by DPW GROUP DPW DCI DLR APLR FSR
Lloyd's Underwriters Lloyd's 14 2 16% 46% A Lloyd's Underwriters Lloyd's 8 2 20% 44% A
Aviva Ins Co (CAN) Aviva 11 5 44% 80% A- Aviva Ins Co (CAN) Aviva 5 2 38% 62% A-
Intact Ins Co ING Grp 7 6 91% 79% A+ Chartis Ins Co (CAN) AIG 5 10 155% 66% A
Continental Casualty Co CNA Financial 6 6 103% 101% A Lombard General Ins Co (CAN) Fairfax Financial Grp 4 0.3 8% 29% A
Chartis Ins Co (CAN) AIG 5 12 198% 115% A RSA Ins Co (CAN) RSA 4 2 44% 57% A
Manitoba Total 103 57 61% 67% New Brunswick Total 65 34 60% 69%
Newfoundland & Labrador FY'09 $Mn Northwest Territories FY'09 $Mn
Top 5 Underwriters by DPW GROUP DPW DCI DLR APLR FSR Top 5 Underwriters by DPW GROUP DPW DCI DLR APLR FSR
Aviva Ins Co (CAN) Aviva 6 1 20% 44% A- Scottish & York Ins Co. Limited Aviva 2 n/m n/a n/a NR
Lombard General Ins Co (CAN) Fairfax Financial Grp 5 3 63% 38% A Aviva Ins Co (CAN) Aviva 1 1 92% 56% A-
Lloyd's Underwriters Lloyd's 4 n/m n/a 19% A Lloyd's Underwriters Lloyd's 1 0.1 6% n/a A
Co-operators General Ins Co The Co-operators Grp Ltd 3 1 42% 54% A- Chartis Ins Co (CAN) AIG 1 0.4 39% 26% A
RSA Ins Co (CAN) RSA 2 1 26% 67% A St. Paul Fire and Marine Ins Co Travelers 1 n/m n/a n/a A+
Newfoundland & Labrador Total 38 15 44% 61% Northwest Territories Total 9 6 70% 58%
Nova Scotia FY'09 $Mn Nunavut FY'09 $Mn
Top 5 Underwriters by DPW GROUP DPW DCI DLR APLR FSR Top 5 Underwriters by DPW GROUP DPW DCI DLR APLR FSR
Lloyd's Underwriters Lloyd's 9 4 42% 39% A Lloyd's Underwriters Lloyd's 1 1 111% 196% A
Intact Ins Co ING Grp 7 5 71% 62% A+ St. Paul Fire and Marine Ins Co Travelers 0.5 0.1 18% 11% A+
RSA Ins Co (CAN) RSA 6 1 18% 52% A Sovereign General Ins Co The Co-operators Grp Ltd 0.1 n/a n/a n/a B++
Lombard General Ins Co (CAN) Fairfax Financial Grp 6 3 48% 44% A Continental Casualty Co CNA Financial 0.1 0.1 125% 80% A
Chartis Ins Co (CAN) AIG 6 n/m n/a n/a A Chartis Ins Co (CAN) AIG 0.1 n/m n/a n/a A
Nova Scotia Total 88 48 62% 53% Nunavut Total 2 1 69% 79%
Ontario FY'09 $Mn Out of Canada FY'09 $Mn
Top 5 Underwriters by DPW GROUP DPW DCI DLR APLR FSR Top 5 Underwriters by DPW GROUP DPW DCI DLR APLR FSR
Lloyd's Underwriters Lloyd's 260 93 36% 55% A ACE INA Ins ACE 7 3 36% 20% A+
Aviva Ins Co (CAN) Aviva 164 250 158% 92% A- Commonwealth Ins Co Fairfax Financial Grp 7 1 9% n/a A
Chartis Ins Co (CAN) AIG 155 99 58% 57% A Chubb Ins Co (CAN) Chubb 6 1 13% n/a A++
Intact Ins Co ING Grp 129 82 65% 76% A+ Lombard General Ins Co (CAN) Fairfax Financial Grp 4 0.5 9% 11% A
Zurich Ins Co Zurich 123 50 40% 67% A RSA Ins Co (CAN) RSA 4 0.2 4% 3% A
Ontario Total 2,034 1,427 79% 82% Out of Canada Total 33 43 121% 34%
Prince Edward Island FY'09 $Mn Quebec FY'09 $Mn
Top 5 Underwriters by DPW GROUP DPW DCI DLR APLR FSR Top 5 Underwriters by DPW GROUP DPW DCI DLR APLR FSR
Lloyd's Underwriters Lloyd's 2 n/m n/a 15% A Lloyd's Underwriters Lloyd's 109 31 29% 56% A
Co-operators General Ins Co The Co-operators Grp Ltd 1 n/m n/a 45% A- Chartis Ins Co (CAN) AIG 72 120 155% 114% A
Lombard General Ins Co (CAN) Fairfax Financial Grp 1 1 47% 74% A Intact Ins Co ING Grp 56 34 64% 61% A+
Aviva Ins Co (CAN) Aviva 1 0.4 43% 65% A- Chubb Ins Co (CAN) Chubb 46 30 62% 54% A++
Intact Ins Co ING Grp 1 1 74% 53% A+ Lombard General Ins Co (CAN) Fairfax Financial Grp 44 70 147% 85% A
Prince Edward Island Total 13 2 20% 48% Quebec Total 612 446 85% 66%
Saskatchewan FY'09 $Mn Yukon FY'09 $Mn
Top 5 Underwriters by DPW GROUP DPW DCI DLR DLR FSR Top 5 Underwriters by DPW GROUP DPW DCI DLR APLR FSR
Aviva Ins Co (CAN) Aviva 10 4 41% 63% A- Lloyd's Underwriters Lloyd's 1 1 88% 53% A
Lloyd's Underwriters Lloyd's 9 n/m n/a 26% A Aviva Ins Co (CAN) Aviva 1 0.3 44% 41% A-
Chartis Ins Co (CAN) AIG 6 3 46% 51% A AXA Pacific Ins Co AXA 0.4 n/m n/a n/a A
Co-operators General Ins Co The Co-operators Grp Ltd 5 4 75% 62% A- Co-operators General Ins Co The Co-operators Grp Ltd 0.3 n/m n/a 27% A-
St. Paul Fire and Marine Ins Co Travelers 4 0.3 10% 17% A+ ACE INA Ins ACE 0.2 0.0 25% 12% A+
Saskatchewan Total 79 26 37% 41% Yukon Total 5 n/m n/a 31%
Canadian update: Liability 3
4. Quarterly Update
Aon Global Risk Insight Platform (Aon GRIPTM) is the world’s leading global repository of global risk and
insurance placement information. By providing fact-based insights into Aon’s USD $54 billion in global premium
flow, Aon GRIP helps identify the best placement option regardless of size, industry, coverage line or geography.
Q3/09 Construction
The Web-accessible data produced by Aon GRIP helps Aon brokers evaluate which markets to approach with a
placement and which carriers may provide the best value for clients. It also gives Aon brokers a leg up when it
comes to negotiations, making sure every conversation is based on the most complete, most current set of facts.
GLOSSARY
• DPW: Direct Premiums Written in the period for the specific line of business without taking into account
premiums ceded or premiums assumed under reinsurance.
• DPE: Direct Premiums Earned is the portion of direct premiums written attributable to the risks borne by
the insurer during the accounting year.
• DCI: Direct Claims Incurred in the period (including prior year development and forward estimates of
losses) for the specific line of business without taking into account losses ceded or losses assumed
under reinsurance.
• DLR: Direct Loss Ratio is a primary component of underwriting profitability. It is calculated as Direct
Claims Incurred / Direct Premiums Earned. The ratio excludes any impact from reinsurance.
• APLR: All Products Loss Ratio (as direct loss ratio but for all non-life products).
• FSR: Financial Strength Rating by A.M. Best.
• Commercial P&C market is estimated by subtracting the following insurance lines from the aggregate
P&C market: Personal property, accident and sickness, and 85% of auto premium and losses.
This report has been compiled for you on behalf of
Christine Lithgow
Executive Vice President
National Client Service - Market Relations
T: 1 416 868 5638
e: christine.lithgow@aon.ca
CONTACTS
Nicholas Keye, CFA Susie Crawford
The Aon Centre for Innovation and Analytics The Aon Centre for Innovation and Analytics
T: +353 1 266 6419 T: +353 1 266 6512
e: nick_keye@aon.ie e: susie_crawford@aon.ie
DISCLAIMER
Aon does not provide or express an opinion or recommendation regarding any company or matter mentioned
herein. The recipient understands that Aon has endeavoured to include information known to it which it believes
to be relevant to the recipient. The recipient further understands that neither Aon nor its employees shall make
any representation or warranty as to the accuracy or completeness of this information. Aon shall not have any
liability to the recipient or any other party resulting from the use of this information by the recipient or such other
party.
Copyright 2010 Aon Commercial Services and Operations Ireland Limited. For use only by an Aon employee for
client purposes. May not be reproduced in any way or disseminated to an insurance company or to any other
party without the prior written consent of Aon Commercial Services and Operations Ireland Limited.
Canadian update: Liability 4