
Recomendados
Recomendados
Mais conteúdo relacionado
Mais procurados
Mais procurados (20)
Semelhante a TEGMA Reports 43.5% Growth in 1Q08 Net Revenue
Semelhante a TEGMA Reports 43.5% Growth in 1Q08 Net Revenue (20)
Mais de TegmaRI
Mais de TegmaRI (20)
Último
Último (20)
TEGMA Reports 43.5% Growth in 1Q08 Net Revenue
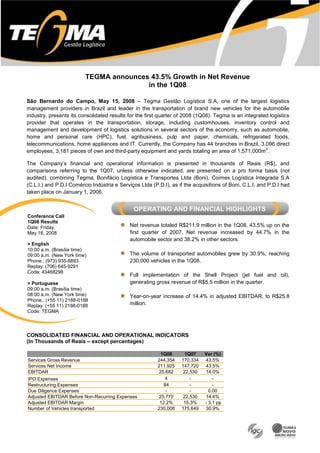
- 1. TEGMA announces 43.5% Growth in Net Revenue in the 1Q08 São Bernardo do Campo, May 15, 2008 – Tegma Gestão Logística S.A, one of the largest logistics management providers in Brazil and leader in the transportation of brand new vehicles for the automobile industry, presents its consolidated results for the first quarter of 2008 (1Q08). Tegma is an integrated logistics provider that operates in the transportation, storage, including customhouses, inventory control and management and development of logistics solutions in several sectors of the economy, such as automobile, home and personal care (HPC), fuel, agribusiness, pulp and paper, chemicals, refrigerated foods, telecommunications, home appliances and IT. Currently, the Company has 44 branches in Brazil, 3,096 direct employees, 3,181 pieces of own and third-party equipment and yards totaling an area of 1,571,000m 2 . The Company’s financial and operational information is presented in thousands of Reais (R$), and comparisons referring to the 1Q07, unless otherwise indicated, are presented on a pro forma basis (not audited), combining Tegma, Bonifácio Logística e Transportes Ltda (Boni), Coimex Logística Integrada S.A (C.L.I.) and P.D.I Comércio Indústria e Serviços Ltda (P.D.I), as if the acquisitions of Boni, C.L.I, and P.D.I had taken place on January 1, 2006. Net revenue totaled R$211.9 million in the 1Q08, 43.5% up on the first quarter of 2007. Net revenue increased by 44.7% in the automobile sector and 38.2% in other sectors. The volume of transported automobiles grew by 30.9%, reaching 230,000 vehicles in the 1Q08. Full implementation of the Shell Project (jet fuel and oil), generating gross revenue of R$5.5 million in the quarter. Year-on-year increase of 14.4% in adjusted EBITDAR, to R$25.8 million. CONSOLIDATED FINANCIAL AND OPERATIONAL INDICATORS (In Thousands of Reais – except percentages) 1Q08 1Q07 Var (%) Services Gross Revenue 244,354 170,334 43.5% Services Net Income 211,925 147,720 43.5% EBITDAR 25,682 22,530 14.0% IPO Expenses 4 - - Restructuring Expenses 84 - - Due Diligence Expenses - - 0.00 Adjusted EBITDAR Before Non-Recurring Expenses 25,770 22,530 14.4% Adjusted EBITDAR Margin 12.2% 15.3% - 3.1 pp Number of Vehicles transported 230,008 175,649 30.9% Conference Call 1Q08 Results Date: Friday, May 16, 2008 > English 10:00 a.m. (Brasília time) 09:00 a.m. (New York time) Phone.: (973) 935-8893 Replay: (706) 645-9291 Code: 43468298 > Portuguese 09:00 a.m. (Brasília time) 08:00 a.m. (New York time) Phone.: (+55 11) 2188-0188 Replay: (+55 11) 2188-0188 Code: TEGMA OPERATING AND FINANCIAL HIGHLIGHTS
- 2. 2 It is with great satisfaction that we announce the results for the first quarter of 2008 (1Q08). Consolidated gross revenue rose by 43.5% compared to the 1Q07, fueled by the growth in revenue from both transportation services (43.9% upturn) and logistics services (40.6% upturn). The automotive industry continues growing at a hefty pace. According to ANFAVEA (Brazilian Automobile Manufacturers Association), new vehicles sales in 2008 should be 17.5% higher than in the previous year. This performance has been boosted by credit availability and economic stability, conditions we believe should hold in the short and medium term. Recent events, such as the increase in the IOF tax in January 2008, did not have a significant impact over vehicles sales, which recorded year-on-year growth of 30%. Regarding gross revenue per sector, we obtained significant results in all the segments we operate. In the automobile sector, gross revenue climbed by 44.3% year-on-year, reaching R$196.9 million. In addition to the transportation of vehicles, we highlight the 176.9% growth in auto parts transportation, which amounted to R$34.8 million in the period. Gross revenue from other sectors stood at R$47.5 million in the 1Q08, 39.9% up on the same period last year, chiefly thanks to fuel, pulp and paper transportation, the project with Shell (jet fuel and oil) and the new agreements with VCP. Our adjusted EBITDAR came to 14.4%, totaling R$25.8 million in the 1Q08, while the EBITDAR margin stood at 12.2%, 3.1 p.p. down on the 1Q07. In the automobile sector, auto parts transportation, logistics services and Catlog, which have lower margins, increased their share of the revenue. In addition, the decline of 15.3% in the volume of automobiles transported compared to the 4Q07, led to a lower dilution of fixed costs (personnel and operational bases). Despite the negative impact of the orange inter-harvest period, adjusted EBITDAR from other sectors rose by 45.5% over the 1Q07, accompanied by an EBITDAR margin 0.6 p.p. higher. Despite these impacts that pressured 1Q08 margins, we believe that with the increase in the volume of vehicles transported and the completion of the productivity project of the HPC (Home Personal Care) sector, we will resume the growth trajectory of our margins in the coming quarters. We thus maintain our guidance for 2008. MANAGEMENT COMMENTS ABOUT 1Q08 RESULTS
- 3. 3 The table below shows 1Q08 consolidated results by Business Division: AUTOMOBILE SECTOR 1Q08 1Q07 Var (%) Transport Services 185,572 129,072 43.8% Transport Services (Automobiles) 150,760 116,500 29.4% Transport Services (Auto parts) 34,812 12,572 176.9% Logistic Services 11,306 7,322 54.4% Total Gross Revenue 196,878 136,394 44.3% Total Net Revenues 171,814 118,701 44.7% EBITDAR 20,798 19,113 8.8% Adjusted EBITDAR Margin 12.1% 16.1% - 4.0 pp Depreciation and Amortization 2,775 874 217.5% Leasing Expenses 559 167 234.7% Number of vehicles transported 230,008 175,649 30.9% Average Km per vehicle transported 815 803 1.5% Gross revenue from the automobile sector grew by 44.3% compared to 1Q07, reaching R$196.9 million in the 1Q08. The highlights are: Automobile Transportation: gross revenue from automobile transportation increased 29.4% compared to 1Q07, reaching R$150.8 million, due to: (i) the increase of 30.9% in the number of vehicles transported, reflecting the growth of automobile sales in the domestic market; and (ii) the increase of 1.5% in average distance, reaching 815 km per vehicle in the 1Q08. Auto parts Transportation: gross revenue from auto parts transportation jumped 176.9%, to R$34.8 million, due to new contracts with clients such as CNH, Fiat, GM and Rieter. Logistics Services: revenue from logistics services rose 54.4% in the 1Q08, reaching R$11.3 million. This increase is due to the upturn in the storage service revenue, yard management, packaging and automotive auction. Adjusted EBITDAR of the automobile sector moved up by 8.8% on the 1Q07, reaching R$ 20.8 million in the 1Q08. As a percentage of net revenue, Adjusted EBITDAR came to 12.1% in the 1Q08, versus 16.1% in the 1Q07. This decrease in margin is due to an increase in the share of auto parts transportation, logistics services and the Catlog division (which have lower margins) of revenue and the reduction in the volume of vehicles transported compared to the 4Q07, leading to a lower dilution of fixed costs (personnel and operational bases). OPERATING PERFORMANCE AND BUSINESS DIVISIONS
- 4. 4 OTHER SECTORS 1Q08 1Q07 Var (%) Transport Services (Sector) 28,382 19,648 44.5% HPC (Home Personal Care) 11,087 10,308 7.6% Orange Juice 2,842 3,516 -19.2% Pulp and Paper 8,521 5,193 64.1% Fuel 5,573 534 943.6% Others 358 97 269.1% Logistic Services 19,094 14,292 33.6% Total Gross Revenue 47,476 33,940 39.9% Total Net Revenue 40,111 29,019 38.2% EBITDAR 4,972 3,417 45.5% Adjusted EBITDAR Margin 12.4% 11.8% + 0.6 pp Depreciation and Amortization 1,402 1,339 4.7% Leasing Expenses 5,253 4,481 17.2% Gross revenue from other sectors grew by 39.9%, reaching R$47.5 million in the 1Q08. The highlights are: (i) fuel transportation – growth of R$5.0 million compared to 1Q07, due to the full implementation of agreements with Shell (jet fuel and oil); (ii) increase of 64.1% in gross revenue from pulp and paper transportation due to the new agreements with VCP and (iii) upturn of 33.6% in gross revenue from logistics services, totaling R$19.1 million in the 1Q08. Adjusted EBITDAR from other sectors rose by 45.5%, to R$5.0 million in the 1Q08. The adjusted EBITDAR margin came to 12.4% in the 1Q08, 0.6 p.p. up on the 1Q07.
- 5. 5 CONSOLIDATED GROSS REVENUE In the 1Q08, consolidated gross revenue totaled R$244.4 million, 43.5% up year on year. The data contained in the table below, except percentages, is denominated in thousand R$: 1Q08 1Q07 Var (%) Transport Services 213,954 148,720 43.9% Logistic Services 30,400 21,614 40.6% Gross Revenue 244,354 170,334 43.5% This growth is chiefly due to: (i) upturn of 30.9% in automobile transportation services (230,000 in the 1Q08 versus 175,600 in the 1Q07), (ii) increase of 1.5% in average distance, to 815 km per vehicle in the 1Q08 (iii) jump of 176.9% in auto parts transportation operations, with gross revenue totaling R$34.8 million in the 1Q08 and (iv) increase of 44.5% in gross revenue from other transportation segments, especially fuel, pulp and paper. DEDUCTIONS FROM CONSOLIDATED GROSS REVENUE Deductions from gross revenue increased 43.4%, reaching R$32.4 million in the 1Q08. As a percentage of gross revenue, deductions totaled 13.3% in the 1Q08, stable in relation to the 1Q07. CONSOLIDATED NET REVENUE As a result of the above, consolidated net revenue stood at R$211.9 million in the 1Q08, 43.5% up year on year. CONSOLIDATED COST OF SERVICES Cost of services rose 49.3%, from R$124.7 million in the 1Q07 to R$186.2 million in the 1Q08. This increase was chiefly due to: (i) a 65.9% upturn in personnel expenses due to the hiring of drivers for new operations, especially in other sectors, and the increase in yard and branch management staff to meet the growth in cargo volume in the automobile sector; (ii) an increase of 46.0% in third-party expenses due to the increase in the vehicle and auto parts transport bills; the increase in expenses relating to ancillary services was higher than the growth in revenue from transportation services due to the growth in operations such as parts and Catlog, where their share is higher; and (iii) an upturn of 50.3% in other costs due to higher expenses with own fleet and costs with operational bases following the increase in the volume of operations. CONSOLIDATED RESULTS
- 6. 6 These cost increases reflect staff hiring and the investments made to meet the strong demand in the 4Q07, as well as part of the funds necessary to keep up with the higher volumes expected in the other quarters of the year. The data presented in the table below, except percentages, is denominated in thousand R$: 1Q08 1Q07 Var (%) with personnel 24,335 14,669 65.9% Third Party 120,319 82,391 46.0% Others 41,539 27,644 50.3% Total 186,193 124,704 49.3% GROSS PROFIT In the 1Q08, the Company’s gross profit reached R$25.7 million, 11.8% up on the 1Q07. OPERATING EXPENSES AND REVENUES 1Q08 1Q07 Var (%) Sales 1,072 576 86.1% General and Administrative 7,793 7,059 10.4% Management fees 612 230 166.1% Financial Revenue/Expense -4,410 1,495 n.a. IPO Expenses 4 - n.a. Other Operational Revenue/Expenses 558 -518 n.a. Goodwill Amortization 143 232 -38.4% Total 5,772 9,074 -36.4% GENERAL AND ADMINISTRATIVE EXPENSES General and administrative expenses totaled R$ 7.8 million in the 1Q08, 10.4% higher than in the 1Q07. FINANCIAL RESULT The Company’s financial revenue totaled R$4.4 million in the 1Q08, chiefly due to the return on the proceeds from the IPO. In the 1Q07, the company recorded financial expenses of R$ 1.5 million. OPERATING PROFIT Operating profit grew 43.2% in the 1Q08 year on year, reaching R$20.0 million INCOME TAX The table below shows the effective income tax and social contribution rate due in the period: 1Q08 1Q07 Var (%) Income before Taxes 20,174 13,942 44.7% Loss in the subsidiary companies 2,928 3,726 -21.4% Others 2,159 546 295.3% Adjusted taxable basis 25,261 18,214 38.7% Income Tax and Social Distribution 8,582 6,186 38.7% Effective rate 34% 34% 0.0%
- 7. 7 NET INCOME Our consolidated net income totaled R$11.6 million in the 1Q08, 49.5% up on the R$7.8 million recorded in the 1Q07. The net margin came to 5.5%. CAPEX Capex totaled R$ 20.3 million in the 1Q08. These investments were mainly related to the acquisition of equipment, tractor and trailer for the new operations and to the substitution of existing equipment. SHARE BUY-BACK PROGRAM On April 25, 2008, we completed our share buy-back program. The Company bought back 825,000 common shares, continuing with the goal of demonstrating the management trust on the Company’s plans. On May 8, 2008, we renewed our share buy-back program for the acquisition of up to 1,722,145 (one million, seven hundred and twenty-two thousand, one hundred and forty-five) common shares, representing 6.99% of outstanding common shares. FIRE – COIMEX LOGÍSTICA INTEGRADA S.A. (C.L.I.) On March 6, 2008, a fire of as yet unknown origin occurred in our subsidiary C.L.I.’s warehouse complex, and operations have already been fully resumed. The Company has already completed a full survey of damaged goods and products and is waiting for the assessment of clients and insurers. Based on the results recorded in the 1Q08, we are maintaining our guidance for 2008, as shown in the table below (in millions of Reais): Min Max Net Revenue 900 1,050 Adjusted EBITDAR 155 195 CAPEX 70 110 RECENT EVENTS GUIDANCE
- 8. 8 1Q08 RESULTS CONFERENCE CALLS |ENGLISH| Friday, May 16, 2008 10:00 a.m. (09:00 a.m. US EDT) Phone.:+1 (973) 935-8893 Replay:+1 (706) 645-9291 Code: 43468298 PORTUGUESE| Friday, May 16, 2008 09:00 a.m. (08:00 a.m. US EDT) Phone.: +55 (11) 2188-0188 Replay: +55 (11) 2188-0188 Code: TEGMA For more information, visit our website www.tegma.com.br/ir or contact our Investor Relations Department: Gennaro Oddone, +55 (11) 4346-2678, gennaro.oddone@tegma.com.br Alexandre Brandão, +55 (11) 4346-2532, alexandre.brandao@tegma.com.br The forward-looking statements contained in this report are subject to risks and uncertainties. They are based on the Management’s beliefs and assumptions and information currently available to the Company. Such statements include information about our current plans, beliefs or expectations, as well as those of the Board of Directors and Board of Executive Officers. These reservations concerning forward-looking statements also apply to information on our possible or presumed operating results, as well as declarations preceded by, including or followed by such words as "believe", "may", "will", "continue", "expect", "foresee", "intend", "plan", "estimate" and other similar expressions. Forward-looking statements do not constitute a guarantee of performance. Since they refer to the future, they depend on circumstances that may or may not occur and are therefore subject to risks, uncertainties and assumptions. Future results and the creation of value for shareholders may differ substantially from those expressed or suggested by the forward-looking statements. These results and values depend on many factors beyond TEGMA’s control or expectations. UPCOMING EVENTS
- 9. 9 Pro-forma (In Thousands of R$) 1Q08 1Q07 Var. % Transport Services 213,954 148,720 43.9% Logistics Services and other services 30,400 21,614 40.6% Gross Operating Revenue 244,354 170,334 43.5% Taxes and Deductions (32,429) (22,614) 43.4% Net operating revenue 211,925 147,720 43.5% Cost of Services Personnel (24,335) (14,669) 65.9% Third parties (120,319) (82,391) 46.0% Other (41,539) (27,644) 50.3% Gross Profit 25,732 23,016 11.8% Operating income (expenses) General and administrative (7,793) (7,059) 10.4% Management Fees (612) (230) 166.1% Commercial expenses (1,072) (576) 86.1% IPO expenses (4) - - Financial expenses (1,685) (1,891) -10.9% Financial income 6,095 396 1439.1% Equity income - - - Goodwill Amortization (143) (232) -38.4% Other operating income (expenses), net (558) 518 -207.7% Operating Profit 19,960 13,942 43.2% Non-operating income, net 214 - - Income before income tax and social contribution 20,174 13,942 44.7% Income Tax and Social Distribution Current (5,867) (3,976) 47.6% Deferred (2,715) (2,210) 22.9% Income before minority interest 11,592 7,755 49.5% Minority interest 2 - - Net income for the period 11,594 7,755 49.5% 1Q08 - INCOME STATEMENTS
- 10. 10 (In Thousand of R$) 1Q08 1Q07 Var. % Transport Services 213,954 129,072 65.8% Logistics Services and other services 30,400 7,322 315.2% Gross Operating Revenue 244,354 136,394 79.2% Taxes on revenues (32,429) (17,693) 83.3% Net Operating Revenue 211,925 118,701 78.5% Cost of Services Personnel (24,335) (8,972) 171.2% Third parties (120,319) (77,432) 55.4% Other (41,539) (10,339) 301.8% Gross Profit 25,732 21,958 17.2% Operating income (expenses) General and administrative (7,793) (3,630) 114.7% Management Fees (612) (230) 166.1% Commercial expenses (1,072) - - IPO expenses (4) - - Financial expenses (1,685) (821) 105.2% Financial income 6,095 382 1495.5% Equity income - - 0.0% Goodwill Amortization (143) (232) -38.4% Other operating income (expenses), net (557) 274 -303.6% Operating Profit 19,960 17,701 12.8% Non-operating income, net 214 - - Income before income tax and social contribution 20,174 17,701 14.0% Income Tax and Social Distribution Current (5,867) (3,812) 53.9% Deferred (2,715) (2,210) 22.9% Income before minority interest 11,592 11,679 -0.7% Minority interest 2 1 100.0% Net income for the period 11,594 11,680 -0.7% (In Thousand of R$) 1Q08 1Q07 Net Operating Revenue 211,925 147,720 Operating Profit 19,960 13,942 (+) Financial Expenses 1,685 1,891 (-) Financial Income (6,095) (396) (+) Amortization of goodwill 143 232 (+) Depreciation 4,178 2,213 (+) Leasing expenses 5,811 4,648 EBITDAR 25,681 22,530 EBITDAR Margin 12.1% 15.3% (+) Due Diligence expenses 84 - (+) Non-recurring expenses - Due Diligence - - (+) Non-recurring expenses - IPO 4 - Adjusted EBITDAR 25,770 22,530 Adjusted EBITDAR Margin 12.2% 15.3% 1Q08 - INCOME STATEMENTS EBITDAR RECONCILIATION
- 11. 11 (In Thousand of Reais) Assets 31/03/2008 31/03/2007 Liabilities and Shareholders' equity 31/03/2008 31/03/2007 Current Assets 347,318 105,786 Current Liabilities 93,020 86,992 Cash and banks 8,534 5,014 Loans and financing 11,255 34,516 Financial Investments 194,811 6,103 Suppliers and freight payable 21,786 18,491 Accounts Receivable 109,947 68,066 Related parties 627 1,067 Related Parties - 1,302 Taxes payable 5,751 10,383 Warehouse 1,758 543 Taxes payable in installments 2,002 2,604 Taxes recoverable 15,833 10,904 Salaries and social charges 13,020 8,087 Deferred income tax and social contribution 6,520 8,694 Insurance and rents payable 3,823 2,597 Dividends receivable - - Dividends payable 6,060 - Other accounts receivable 7,570 3,527 Income Tax and Social Contribution 3,342 3,812 Prepaid expenses 2,345 1,633 Other accounts payable 25,354 5,435 Non-current assets 145,504 105,089 Non-current liabilities 399,802 123,883 Long-Term Assets 10,959 13,562 Long-Term Liabilities 43,215 36,333 Deferred income tax and social contribution 7,907 12,242 Loans and financing 25,429 18,328 Long-term income tax - - Provision for contingencies and other liabilities 2,153 1,605 Related Parties 1,438 127 Taxes payable in installments 12,966 13,800 Judicial deposits 1,314 1,193 Deferred income tax and social contribution 2,600 2,600 Other assets 300 - Other accounts payable 67 - Fixed Assets 134,545 91,527 Minority interest - 6 Investments - Cost - 1,860 Shareholders' equity 356,587 87,544 Investments - Others 45,705 - Capital stock 144,469 58,857 Property and equipment 83,230 36,323 Capital reserve 206,861 2,245 Deferred - - Cummulative Profits 11,594 26,442 Intangible assets 5,610 53,344 Profit reserve 2,214 - Shares held in Treasury (8,551) - Total Assets 492,822 210,875 Total Liabilities and Shareholders' Equity 492,822 210,875 BALANCE SHEET