5, east austin metrics
•
0 gostou•309 visualizações

- The document compares real estate data from December 2009 to December 2011 for the Austin, TX area. - It shows that the median sold price decreased 17% from $150,455 to $125,500 over that period. Additionally, the number of sold properties decreased 19% from 26 to 21. - The median price of properties for sale also decreased, falling 5% from $199,000 to $189,900, while the median price of properties sold dropped 17%.

Recomendados
Mais conteúdo relacionado
Mais procurados
Mais procurados (20)
Destaque
Destaque (13)
Semelhante a 5, east austin metrics
Semelhante a 5, east austin metrics (8)
5, east austin metrics
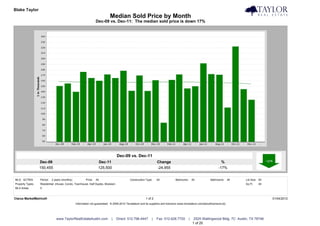
- 1. Blake Taylor Taylor Real Estate Median Sold Price by Month Dec-09 vs. Dec-11: The median sold price is down 17% Dec-09 vs. Dec-11 Dec-09 Dec-11 Change % 150,455 125,500 -24,955 -17% MLS: ACTRIS Period: 2 years (monthly) Price: All Construction Type: All Bedrooms: All Bathrooms: All Lot Size: All Property Types: Residential: (House, Condo, Townhouse, Half Duplex, Modular) Sq Ft: All MLS Areas: 5 Clarus MarketMetrics® 1 of 2 01/04/2012 Information not guaranteed. © 2009-2010 Terradatum and its suppliers and licensors (www.terradatum.com/about/licensors.td). www.TaylorRealEstateAustin.com | Direct: 512.796.4447 | Fax: 512.628.7720 | 2525 Wallingwood Bldg. 7C Austin, TX 78746 1 of 20
- 2. Blake Taylor Taylor Real Estate Median Sold Price by Month Dec-09 vs. Dec-11: The median sold price is down 17% Time Period Median Price # Units Average DOM Dec-11 125,500 21 92 Nov-11 144,750 18 102 Oct-11 222,000 21 62 Sep-11 111,500 15 92 Aug-11 170,850 24 63 Jul-11 172,000 31 95 Jun-11 191,500 35 65 May-11 150,000 36 115 Apr-11 146,000 32 64 Mar-11 171,400 28 112 Feb-11 161,500 23 67 Jan-11 84,000 7 124 Dec-10 161,000 19 83 Nov-10 141,500 16 96 Oct-10 169,500 13 129 Sep-10 141,750 18 103 Aug-10 178,000 21 87 Jul-10 164,950 25 123 Jun-10 171,400 32 85 May-10 160,000 35 36 Apr-10 165,000 29 96 Mar-10 176,000 42 66 Feb-10 139,950 22 82 Jan-10 155,000 19 68 Dec-09 150,455 26 88 Clarus MarketMetrics® 2 of 2 01/04/2012 Information not guaranteed. © 2009-2010 Terradatum and its suppliers and licensors (www.terradatum.com/about/licensors.td). www.TaylorRealEstateAustin.com | Direct: 512.796.4447 | Fax: 512.628.7720 | 2525 Wallingwood Bldg. 7C Austin, TX 78746 2 of 20
- 3. Blake Taylor Taylor Real Estate Median For Sale vs. Median Sold Dec-09 vs. Dec-11: The median price of for sale properties is down 5% and the median price of sold properties is down 17% Dec-09 vs. Dec-11 Dec-09 vs. Dec-11 Dec-09 Dec-11 Change % Dec-09 Dec-11 Change % 199,000 189,900 -9,100 -5% 150,455 125,500 -24,955 -17% MLS: ACTRIS Period: 2 years (monthly) Price: All Construction Type: All Bedrooms: All Bathrooms: All Lot Size: All Property Types: Residential: (House, Condo, Townhouse, Half Duplex, Modular) Sq Ft: All MLS Areas: 5 Clarus MarketMetrics® 1 of 2 01/04/2012 Information not guaranteed. © 2009-2010 Terradatum and its suppliers and licensors (www.terradatum.com/about/licensors.td). www.TaylorRealEstateAustin.com | Direct: 512.796.4447 | Fax: 512.628.7720 | 2525 Wallingwood Bldg. 7C Austin, TX 78746 3 of 20
- 4. Blake Taylor Taylor Real Estate Median For Sale vs. Median Sold Dec-09 vs. Dec-11: The median price of for sale properties is down 5% and the median price of sold properties is down 17% For Sale # Properties Sold # Properties Price Time Period Median For Sale Median Sold Difference Dec-11 189,900 160 125,500 21 -64,400 Nov-11 178,900 179 144,750 18 -34,150 Oct-11 185,500 182 222,000 21 36,500 Sep-11 185,500 206 111,500 15 -74,000 Aug-11 179,950 216 170,850 24 -9,100 Jul-11 185,500 206 172,000 31 -13,500 Jun-11 179,900 207 191,500 35 11,600 May-11 179,900 224 150,000 36 -29,900 Apr-11 179,900 245 146,000 32 -33,900 Mar-11 175,000 253 171,400 28 -3,600 Feb-11 172,500 238 161,500 23 -11,000 Jan-11 170,000 253 84,000 7 -86,000 Dec-10 179,900 247 161,000 19 -18,900 Nov-10 179,500 271 141,500 16 -38,000 Oct-10 179,950 283 169,500 13 -10,450 Sep-10 188,500 276 141,750 18 -46,750 Aug-10 186,500 288 178,000 21 -8,500 Jul-10 188,000 305 164,950 25 -23,050 Jun-10 186,250 314 171,400 32 -14,850 May-10 180,000 308 160,000 35 -20,000 Apr-10 189,500 330 165,000 29 -24,500 Mar-10 189,700 294 176,000 42 -13,700 Feb-10 189,250 278 139,950 22 -49,300 Jan-10 199,900 275 155,000 19 -44,900 Dec-09 199,000 269 150,455 26 -48,545 Clarus MarketMetrics® 2 of 2 01/04/2012 Information not guaranteed. © 2009-2010 Terradatum and its suppliers and licensors (www.terradatum.com/about/licensors.td). www.TaylorRealEstateAustin.com | Direct: 512.796.4447 | Fax: 512.628.7720 | 2525 Wallingwood Bldg. 7C Austin, TX 78746 4 of 20
- 5. Blake Taylor Taylor Real Estate Sold Properties by Month Dec-09 vs. Dec-11: The number of Sold properties is down 19% Dec-09 vs. Dec-11 Dec-09 Dec-11 Change % 26 21 -5 -19% MLS: ACTRIS Period: 2 years (monthly) Price: All Construction Type: All Bedrooms: All Bathrooms: All Lot Size: All Property Types: Residential: (House, Condo, Townhouse, Half Duplex, Modular) Sq Ft: All MLS Areas: 5 Clarus MarketMetrics® 1 of 2 01/04/2012 Information not guaranteed. © 2009-2010 Terradatum and its suppliers and licensors (www.terradatum.com/about/licensors.td). www.TaylorRealEstateAustin.com | Direct: 512.796.4447 | Fax: 512.628.7720 | 2525 Wallingwood Bldg. 7C Austin, TX 78746 5 of 20
- 6. Blake Taylor Taylor Real Estate Sold Properties by Month Dec-09 vs. Dec-11: The number of Sold properties is down 19% Full Market Bank Properties Non-Bank Properties Time Period # Properties Median Price Average DOM # Properties % Bank Median Price # Properties % Non-Bank Median Price Dec-11 21 125,500 92 3 14.3 95,199 18 85.7 138,500 Nov-11 18 144,750 102 2 11.1 73,500 16 88.9 162,250 Oct-11 21 222,000 62 2 9.5 110,042 19 90.5 224,600 Sep-11 15 111,500 92 2 13.3 109,938 13 86.7 111,500 Aug-11 24 170,850 63 4 16.7 132,750 20 83.3 170,850 Jul-11 31 172,000 95 4 12.9 131,950 27 87.1 179,000 Jun-11 35 191,500 65 5 14.3 125,000 30 85.7 210,000 May-11 36 150,000 115 3 8.3 138,000 33 91.7 150,000 Apr-11 32 146,000 64 10 31.2 140,000 22 68.8 157,000 Mar-11 28 171,400 112 4 14.3 92,450 24 85.7 183,500 Feb-11 23 161,500 67 8 34.8 84,020 15 65.2 163,050 Jan-11 7 84,000 124 4 57.1 82,000 3 42.9 143,000 Dec-10 19 161,000 83 5 26.3 152,000 14 73.7 164,500 Nov-10 16 141,500 96 3 18.8 105,000 13 81.2 199,000 Oct-10 13 169,500 129 1 7.7 77,777 12 92.3 179,750 Sep-10 18 141,750 103 2 11.1 92,375 16 88.9 148,000 Aug-10 21 178,000 87 3 14.3 157,000 18 85.7 193,000 Jul-10 25 164,950 123 4 16.0 94,125 21 84.0 179,000 Jun-10 32 171,400 85 2 6.2 118,700 30 93.8 174,950 May-10 35 160,000 36 3 8.6 135,000 32 91.4 160,000 Apr-10 29 165,000 96 1 3.5 170,000 28 96.5 165,000 Mar-10 42 176,000 66 7 16.7 65,000 35 83.3 185,000 Feb-10 22 139,950 82 3 13.6 72,500 19 86.4 154,500 Jan-10 19 155,000 68 0 19 100.0 155,000 Dec-09 26 150,455 88 7 26.9 103,000 19 73.1 167,500 Clarus MarketMetrics® 2 of 2 01/04/2012 Information not guaranteed. © 2009-2010 Terradatum and its suppliers and licensors (www.terradatum.com/about/licensors.td). www.TaylorRealEstateAustin.com | Direct: 512.796.4447 | Fax: 512.628.7720 | 2525 Wallingwood Bldg. 7C Austin, TX 78746 6 of 20
- 7. Blake Taylor Taylor Real Estate Under Contract Properties by Month Dec-09 vs. Dec-11: The number of Under Contract properties is up 71% Dec-09 vs. Dec-11 Dec-09 Dec-11 Change % 17 29 12 +71% MLS: ACTRIS Period: 2 years (monthly) Price: All Construction Type: All Bedrooms: All Bathrooms: All Lot Size: All Property Types: Residential: (House, Condo, Townhouse, Half Duplex, Modular) Sq Ft: All MLS Areas: 5 Clarus MarketMetrics® 1 of 2 01/04/2012 Information not guaranteed. © 2009-2010 Terradatum and its suppliers and licensors (www.terradatum.com/about/licensors.td). www.TaylorRealEstateAustin.com | Direct: 512.796.4447 | Fax: 512.628.7720 | 2525 Wallingwood Bldg. 7C Austin, TX 78746 7 of 20
- 8. Blake Taylor Taylor Real Estate Under Contract Properties by Month Dec-09 vs. Dec-11: The number of Under Contract properties is up 71% Full Market Bank Properties Non-Bank Properties Time Period # Properties Median Price Average DOM # Properties % Bank Median Price # Properties % Non-Bank Median Price Dec-11 29 186,000 106 1 3.5 99,900 28 96.5 187,500 Nov-11 19 121,000 105 2 10.5 57,450 17 89.5 124,900 Oct-11 16 168,950 90 3 18.8 102,900 13 81.2 214,500 Sep-11 30 204,500 105 4 13.3 113,500 26 86.7 214,950 Aug-11 22 126,492 88 3 13.6 42,000 19 86.4 130,000 Jul-11 17 227,000 57 2 11.8 238,000 15 88.2 194,196 Jun-11 29 175,000 81 1 3.5 145,000 28 96.5 177,250 May-11 41 180,000 60 8 19.5 107,200 33 80.5 199,500 Apr-11 34 177,450 124 6 17.6 172,500 28 82.3 180,950 Mar-11 32 139,000 81 6 18.8 136,950 26 81.2 146,600 Feb-11 28 182,450 98 3 10.7 114,900 25 89.3 188,000 Jan-11 25 150,000 83 11 44.0 85,140 14 56.0 171,400 Dec-10 7 165,000 86 3 42.9 205,500 4 57.1 158,450 Nov-10 16 129,450 80 2 12.5 134,900 14 87.5 129,450 Oct-10 16 182,000 96 6 37.5 133,000 10 62.5 228,700 Sep-10 16 192,400 125 0 16 100.0 192,400 Aug-10 15 150,000 90 3 20.0 89,900 12 80.0 169,500 Jul-10 25 169,000 106 5 20.0 149,000 20 80.0 174,450 Jun-10 20 168,475 92 1 5.0 110,000 19 95.0 169,000 May-10 23 175,000 77 3 13.0 82,170 20 87.0 179,250 Apr-10 41 178,000 74 3 7.3 145,900 38 92.7 181,500 Mar-10 34 167,450 64 4 11.8 67,075 30 88.2 169,950 Feb-10 40 175,000 70 4 10.0 83,750 36 90.0 184,950 Jan-10 27 179,600 78 3 11.1 84,500 24 88.9 179,750 Dec-09 17 155,000 79 0 17 100.0 155,000 Clarus MarketMetrics® 2 of 2 01/04/2012 Information not guaranteed. © 2009-2010 Terradatum and its suppliers and licensors (www.terradatum.com/about/licensors.td). www.TaylorRealEstateAustin.com | Direct: 512.796.4447 | Fax: 512.628.7720 | 2525 Wallingwood Bldg. 7C Austin, TX 78746 8 of 20
- 9. Blake Taylor Taylor Real Estate New Properties by Month Dec-09 vs. Dec-11: The number of New properties is down 53% Dec-09 vs. Dec-11 Dec-09 Dec-11 Change % 38 18 -20 -53% MLS: ACTRIS Period: 2 years (monthly) Price: All Construction Type: All Bedrooms: All Bathrooms: All Lot Size: All Property Types: Residential: (House, Condo, Townhouse, Half Duplex, Modular) Sq Ft: All MLS Areas: 5 Clarus MarketMetrics® 1 of 2 01/04/2012 Information not guaranteed. © 2009-2010 Terradatum and its suppliers and licensors (www.terradatum.com/about/licensors.td). www.TaylorRealEstateAustin.com | Direct: 512.796.4447 | Fax: 512.628.7720 | 2525 Wallingwood Bldg. 7C Austin, TX 78746 9 of 20
- 10. Blake Taylor Taylor Real Estate New Properties by Month Dec-09 vs. Dec-11: The number of New properties is down 53% Full Market Bank Properties Non-Bank Properties Time Period # Properties Median Price # Properties % Bank Median Price # Properties % Non-Bank Median Price Dec-11 18 212,500 0 18 100.0 212,500 Nov-11 37 129,900 2 5.4 77,400 35 94.6 135,000 Oct-11 26 227,400 1 3.9 165,000 25 96.2 234,900 Sep-11 40 174,950 3 7.5 94,900 37 92.5 185,000 Aug-11 47 179,500 2 4.3 122,450 45 95.7 180,000 Jul-11 46 179,925 4 8.7 73,950 42 91.3 187,098 Jun-11 43 164,000 6 13.9 91,400 37 86.0 179,000 May-11 38 182,450 3 7.9 114,900 35 92.1 189,000 Apr-11 53 199,900 8 15.1 97,200 45 84.9 213,500 Mar-11 66 175,500 12 18.2 129,500 54 81.8 192,250 Feb-11 43 177,000 6 13.9 109,700 37 86.0 183,400 Jan-11 55 150,000 4 7.3 110,020 51 92.7 155,000 Dec-10 32 164,950 5 15.6 89,900 27 84.4 179,900 Nov-10 44 177,450 10 22.7 127,450 34 77.3 189,500 Oct-10 47 169,111 7 14.9 130,500 40 85.1 171,200 Sep-10 38 189,950 3 7.9 156,500 35 92.1 195,000 Aug-10 50 169,400 3 6.0 149,900 47 94.0 169,900 Jul-10 46 176,950 3 6.5 199,900 43 93.5 159,900 Jun-10 53 169,900 4 7.5 224,250 49 92.5 165,000 May-10 46 156,950 3 6.5 82,170 43 93.5 165,000 Apr-10 104 178,950 9 8.7 164,000 95 91.3 179,900 Mar-10 77 189,900 8 10.4 101,750 69 89.6 199,000 Feb-10 62 160,000 4 6.5 177,500 58 93.5 154,950 Jan-10 62 197,000 6 9.7 112,950 56 90.3 199,450 Dec-09 38 172,400 4 10.5 132,750 34 89.5 172,400 Clarus MarketMetrics® 2 of 2 01/04/2012 Information not guaranteed. © 2009-2010 Terradatum and its suppliers and licensors (www.terradatum.com/about/licensors.td). www.TaylorRealEstateAustin.com | Direct: 512.796.4447 | Fax: 512.628.7720 | 2525 Wallingwood Bldg. 7C Austin, TX 78746 10 of 20
- 11. Blake Taylor Taylor Real Estate For Sale Properties by Month Dec-09 vs. Dec-11: The number of For Sale properties is down 41% Dec-09 vs. Dec-11 Dec-09 Dec-11 Change % 269 160 -109 -41% MLS: ACTRIS Period: 2 years (monthly) Price: All Construction Type: All Bedrooms: All Bathrooms: All Lot Size: All Property Types: Residential: (House, Condo, Townhouse, Half Duplex, Modular) Sq Ft: All MLS Areas: 5 Clarus MarketMetrics® 1 of 2 01/04/2012 Information not guaranteed. © 2009-2010 Terradatum and its suppliers and licensors (www.terradatum.com/about/licensors.td). www.TaylorRealEstateAustin.com | Direct: 512.796.4447 | Fax: 512.628.7720 | 2525 Wallingwood Bldg. 7C Austin, TX 78746 11 of 20
- 12. Blake Taylor Taylor Real Estate For Sale Properties by Month Dec-09 vs. Dec-11: The number of For Sale properties is down 41% Full Market Bank Properties Non-Bank Properties Time Period # Properties Median Price Average DOM # Properties % Bank Median Price # Properties % Non-Bank Median Price Dec-11 160 189,900 155 3 1.9 94,900 157 98.1 189,900 Nov-11 179 178,900 143 5 2.8 80,000 174 97.2 179,675 Oct-11 182 185,500 140 7 3.9 94,900 175 96.2 189,900 Sep-11 206 185,500 137 11 5.3 94,900 195 94.7 189,900 Aug-11 216 179,950 131 14 6.5 87,450 202 93.5 185,500 Jul-11 206 185,500 131 15 7.3 80,000 191 92.7 190,000 Jun-11 207 179,900 131 12 5.8 99,450 195 94.2 180,000 May-11 224 179,900 122 16 7.1 99,700 208 92.9 185,000 Apr-11 245 179,900 121 22 9.0 115,775 223 91.0 185,000 Mar-11 253 175,000 122 23 9.1 120,000 230 90.9 179,900 Feb-11 238 172,500 134 15 6.3 110,000 223 93.7 179,000 Jan-11 253 170,000 131 27 10.7 99,000 226 89.3 179,900 Dec-10 247 179,900 146 27 10.9 109,000 220 89.1 180,000 Nov-10 271 179,500 140 25 9.2 149,900 246 90.8 179,900 Oct-10 283 179,950 146 23 8.1 156,500 260 91.9 180,000 Sep-10 276 188,500 143 16 5.8 160,750 260 94.2 189,900 Aug-10 288 186,500 135 17 5.9 149,900 271 94.1 189,000 Jul-10 305 188,000 128 22 7.2 164,500 283 92.8 189,900 Jun-10 314 186,250 123 23 7.3 164,900 291 92.7 189,500 May-10 308 180,000 115 22 7.1 156,500 286 92.9 187,500 Apr-10 330 189,500 104 26 7.9 165,000 304 92.1 194,900 Mar-10 294 189,700 113 22 7.5 167,500 272 92.5 192,400 Feb-10 278 189,250 117 19 6.8 165,000 259 93.2 189,900 Jan-10 275 199,900 124 20 7.3 171,450 255 92.7 199,900 Dec-09 269 199,000 131 15 5.6 199,900 254 94.4 199,000 Clarus MarketMetrics® 2 of 2 01/04/2012 Information not guaranteed. © 2009-2010 Terradatum and its suppliers and licensors (www.terradatum.com/about/licensors.td). www.TaylorRealEstateAustin.com | Direct: 512.796.4447 | Fax: 512.628.7720 | 2525 Wallingwood Bldg. 7C Austin, TX 78746 12 of 20
- 13. Blake Taylor Taylor Real Estate Expired Properties by Month Dec-09 vs. Dec-11: The number of Expired properties is down 33% Dec-09 vs. Dec-11 Dec-09 Dec-11 Change % 39 26 -13 -33% MLS: ACTRIS Period: 2 years (monthly) Price: All Construction Type: All Bedrooms: All Bathrooms: All Lot Size: All Property Types: Residential: (House, Condo, Townhouse, Half Duplex, Modular) Sq Ft: All MLS Areas: 5 Clarus MarketMetrics® 1 of 2 01/04/2012 Information not guaranteed. © 2009-2010 Terradatum and its suppliers and licensors (www.terradatum.com/about/licensors.td). www.TaylorRealEstateAustin.com | Direct: 512.796.4447 | Fax: 512.628.7720 | 2525 Wallingwood Bldg. 7C Austin, TX 78746 13 of 20
- 14. Blake Taylor Taylor Real Estate Expired Properties by Month Dec-09 vs. Dec-11: The number of Expired properties is down 33% Full Market Bank Properties Non-Bank Properties Time Period # Properties Median Price Average DOM # Properties % Bank Median Price # Properties % Non-Bank Median Price Dec-11 26 218,950 165 0 26 100.0 218,950 Nov-11 18 132,000 129 0 18 100.0 132,000 Oct-11 24 202,450 112 1 4.2 150,000 23 95.8 205,000 Sep-11 20 216,250 188 1 5.0 99,900 19 95.0 219,000 Aug-11 28 192,000 111 3 10.7 99,000 25 89.3 199,000 Jul-11 20 197,000 136 1 5.0 79,500 19 95.0 205,000 Jun-11 18 159,950 164 0 18 100.0 159,950 May-11 19 143,500 124 2 10.5 78,225 17 89.5 148,500 Apr-11 25 209,900 125 3 12.0 109,000 22 88.0 246,200 Mar-11 29 184,900 135 3 10.3 109,000 26 89.7 195,450 Feb-11 23 155,000 167 1 4.3 110,000 22 95.7 158,750 Jan-11 33 212,000 106 7 21.2 130,500 26 78.8 221,000 Dec-10 42 199,475 195 1 2.4 180,000 41 97.6 199,950 Nov-10 40 161,200 168 1 2.5 149,900 39 97.5 172,500 Oct-10 40 197,000 204 2 5.0 193,500 38 95.0 197,200 Sep-10 24 204,448 107 0 24 100.0 204,448 Aug-10 35 189,000 134 1 2.9 292,900 34 97.1 184,450 Jul-10 42 180,750 115 3 7.1 292,900 39 92.9 174,000 Jun-10 35 179,900 120 3 8.6 179,900 32 91.4 182,200 May-10 24 178,500 111 0 24 100.0 178,500 Apr-10 27 214,900 127 4 14.8 208,450 23 85.2 217,900 Mar-10 34 200,380 115 1 2.9 289,000 33 97.1 195,760 Feb-10 21 212,000 152 1 4.8 104,900 20 95.2 218,500 Jan-10 32 237,000 150 2 6.2 208,500 30 93.8 238,500 Dec-09 39 205,000 147 1 2.6 242,500 38 97.4 200,484 Clarus MarketMetrics® 2 of 2 01/04/2012 Information not guaranteed. © 2009-2010 Terradatum and its suppliers and licensors (www.terradatum.com/about/licensors.td). www.TaylorRealEstateAustin.com | Direct: 512.796.4447 | Fax: 512.628.7720 | 2525 Wallingwood Bldg. 7C Austin, TX 78746 14 of 20
- 15. Blake Taylor Taylor Real Estate Supply & Demand by Month Dec-09 vs. Dec-11: The number of for sale properties is down 41% and the number of sold properties is down 19% Dec-09 vs. Dec-11 Dec-09 vs. Dec-11 Dec-09 Dec-11 Change % Dec-09 Dec-11 Change % 269 160 -109 -41% 26 21 -5 -19% MLS: ACTRIS Period: 2 years (monthly) Price: All Construction Type: All Bedrooms: All Bathrooms: All Lot Size: All Property Types: Residential: (House, Condo, Townhouse, Half Duplex, Modular) Sq Ft: All MLS Areas: 5 Clarus MarketMetrics® 1 of 2 01/04/2012 Information not guaranteed. © 2009-2010 Terradatum and its suppliers and licensors (www.terradatum.com/about/licensors.td). www.TaylorRealEstateAustin.com | Direct: 512.796.4447 | Fax: 512.628.7720 | 2525 Wallingwood Bldg. 7C Austin, TX 78746 15 of 20
- 16. Blake Taylor Taylor Real Estate Supply & Demand by Month Dec-09 vs. Dec-11: The number of for sale properties is down 41% and the number of sold properties is down 19% # Properties Average DOM # Properties Average DOM Time Period For Sale For Sale Sold Sold Dec-11 160 155 21 92 Nov-11 179 143 18 102 Oct-11 182 140 21 62 Sep-11 206 137 15 92 Aug-11 216 131 24 63 Jul-11 206 131 31 95 Jun-11 207 131 35 65 May-11 224 122 36 115 Apr-11 245 121 32 64 Mar-11 253 122 28 112 Feb-11 238 134 23 67 Jan-11 253 131 7 124 Dec-10 247 146 19 83 Nov-10 271 140 16 96 Oct-10 283 146 13 129 Sep-10 276 143 18 103 Aug-10 288 135 21 87 Jul-10 305 128 25 123 Jun-10 314 123 32 85 May-10 308 115 35 36 Apr-10 330 104 29 96 Mar-10 294 113 42 66 Feb-10 278 117 22 82 Jan-10 275 124 19 68 Dec-09 269 131 26 88 Clarus MarketMetrics® 2 of 2 01/04/2012 Information not guaranteed. © 2009-2010 Terradatum and its suppliers and licensors (www.terradatum.com/about/licensors.td). www.TaylorRealEstateAustin.com | Direct: 512.796.4447 | Fax: 512.628.7720 | 2525 Wallingwood Bldg. 7C Austin, TX 78746 16 of 20
- 17. Blake Taylor Taylor Real Estate The Average Days on Market by Month Dec-09 vs. Dec-11: The average days on market is up 33% Dec-09 vs. Dec-11 Dec-09 Dec-11 Change % 79 106 26 +33% MLS: ACTRIS Period: 2 years (monthly) Price: All Construction Type: All Bedrooms: All Bathrooms: All Lot Size: All Property Types: Residential: (House, Condo, Townhouse, Half Duplex, Modular) Sq Ft: All MLS Areas: 5 Clarus MarketMetrics® 1 of 2 01/04/2012 Information not guaranteed. © 2009-2010 Terradatum and its suppliers and licensors (www.terradatum.com/about/licensors.td). www.TaylorRealEstateAustin.com | Direct: 512.796.4447 | Fax: 512.628.7720 | 2525 Wallingwood Bldg. 7C Austin, TX 78746 17 of 20
- 18. Blake Taylor Taylor Real Estate The Average Days on Market by Month Dec-09 vs. Dec-11: The average days on market is up 33% Time Period Average DOM # UC Units Dec-11 106 29 Nov-11 105 19 Oct-11 90 16 Sep-11 105 30 Aug-11 88 22 Jul-11 57 17 Jun-11 81 29 May-11 60 41 Apr-11 124 34 Mar-11 81 32 Feb-11 98 28 Jan-11 83 25 Dec-10 86 7 Nov-10 80 16 Oct-10 96 16 Sep-10 125 16 Aug-10 90 15 Jul-10 106 25 Jun-10 92 20 May-10 77 23 Apr-10 74 41 Mar-10 64 34 Feb-10 70 40 Jan-10 78 27 Dec-09 79 17 Clarus MarketMetrics® 2 of 2 01/04/2012 Information not guaranteed. © 2009-2010 Terradatum and its suppliers and licensors (www.terradatum.com/about/licensors.td). www.TaylorRealEstateAustin.com | Direct: 512.796.4447 | Fax: 512.628.7720 | 2525 Wallingwood Bldg. 7C Austin, TX 78746 18 of 20
- 19. Blake Taylor Taylor Real Estate Months Supply of Inventory Dec-09 vs. Dec-11: The average months supply of inventory is down 71% Dec-09 vs. Dec-11 Dec-09 Dec-11 Change % 12.5 3.6 -8.9 -71% MLS: ACTRIS Period: 2 years (monthly) Price: All Construction Type: All Bedrooms: All Bathrooms: All Lot Size: All Property Types: Residential: (House, Condo, Townhouse, Half Duplex, Modular) Sq Ft: All MLS Areas: 5 Clarus MarketMetrics® 1 of 2 01/04/2012 Information not guaranteed. © 2009-2010 Terradatum and its suppliers and licensors (www.terradatum.com/about/licensors.td). www.TaylorRealEstateAustin.com | Direct: 512.796.4447 | Fax: 512.628.7720 | 2525 Wallingwood Bldg. 7C Austin, TX 78746 19 of 20
- 20. Blake Taylor Taylor Real Estate Months Supply of Inventory Dec-09 vs. Dec-11: The average months supply of inventory is down 71% # Units For Sale # UC Units UC Average Time Period Last Day of Month During Month MSI DOM Dec-11 105 29 3.6 106 Nov-11 142 19 7.5 105 Oct-11 142 16 8.9 90 Sep-11 156 30 5.2 105 Aug-11 166 22 7.5 88 Jul-11 169 17 9.9 57 Jun-11 160 29 5.5 81 May-11 164 41 4.0 60 Apr-11 186 34 5.5 124 Mar-11 192 32 6.0 81 Feb-11 187 28 6.7 98 Jan-11 195 25 7.8 83 Dec-10 198 7 28.3 86 Nov-10 215 16 13.4 80 Oct-10 227 16 14.2 96 Sep-10 236 16 14.8 125 Aug-10 238 15 15.9 90 Jul-10 238 25 9.5 106 Jun-10 259 20 12.9 92 May-10 261 23 11.3 77 Apr-10 262 41 6.4 74 Mar-10 226 34 6.6 64 Feb-10 217 40 5.4 70 Jan-10 216 27 8.0 78 Dec-09 213 17 12.5 79 Clarus MarketMetrics® 2 of 2 01/04/2012 Information not guaranteed. © 2009-2010 Terradatum and its suppliers and licensors (www.terradatum.com/about/licensors.td). www.TaylorRealEstateAustin.com | Direct: 512.796.4447 | Fax: 512.628.7720 | 2525 Wallingwood Bldg. 7C Austin, TX 78746 20 of 20