Introduction. EaP GREEN
•
0 gostou•588 visualizações


Recomendados
Recomendados
Mais conteúdo relacionado
Mais procurados
Mais procurados (20)
Semelhante a Introduction. EaP GREEN
Semelhante a Introduction. EaP GREEN (20)
Mais de Research Institute of the Ministry of Economic Development and Trade
Mais de Research Institute of the Ministry of Economic Development and Trade (20)
Último
Último (20)
Introduction. EaP GREEN
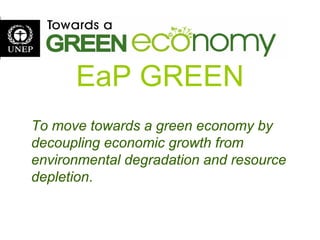
- 1. EaP GREEN To move towards a green economy by decoupling economic growth from environmental degradation and resource depletion.
- 2. Why a Green Economy? • It was born out of multiple crises and accelerating resource scarcity. • A Green Economy is the economic vehicle for sustainable development. • A Green Economy has strategies to end the persistence of poverty. • It is a new economic paradigm that can drive growth of income and jobs, without creating environmental risk.
- 3. A business-as-usual approach is no longer feasible: planetary boundaries constrain economic growth as traditionally conceived. Science tells us we are approaching and crossing bio-physical tipping points: environmental degradation threatens to undermine our collective well being. Threat exacerbated by a mounting social crisis, with growing unemployment and a daunting challenge to provide for new jobs and income opportunities, especially for youth. Rationale: Why is an Inclusive Green Economy needed? This calls for bold action to find new pathways for creating prosperity, decent work and income within a resource-constrained world.
- 4. • In 2009, global GDP reached US$58.22 trillion and yet, almost 80% of humanity continues to live on less than US$ 10/day. • The poorest 40 percent of the world’s population produce only 5 percent of global income. The threat to the planet and inequality go hand in hand. Income distribution under the current growth scenario
- 5. A green economy can reduce poverty • Inextricable link between poverty alleviation and wise management of natural resources and ecosystems. • Ecosystem services and other non-marketed natural goods account for 47 to 89% of the so-called ‘GDP of the Poor’ • Hence need to invest in natural capital as a source of growth and well-being. Natural-resource dependent sectors and ESS (2005) Brazil Indonesia India Original share of GDP (%): agriculture, forestry, fisheries 6% 11% 17% Adjusted share of GDP (%): including non market/ESS 17% 15% 20% Share of ESS/non market goods of total income of the poor (%) 90% 75% 47%
- 6. A Green Economy is one that results in increased human well-being & social equity, while significantly reducing environmental risks & ecological scarcities. What is a Green Economy?
- 7. In Other Words… A Green Economy is one whose growth of income and jobs is driven by investments and policy reforms that reduce carbon emissions and pollution, enhance efficiency and sustain biodiversity and ecosystem services.
- 8. UNEP’s Green Economy Report Investing or reallocating just 2% of global GDP in 10 key sectors can kick-start a transition to a low-carbon, resource-efficient economy.
- 9. BAU vs. a Green Scenario Green Scenario 2 % of GDP or 1.3 trillion USD per year invested in greening 10 key sectors from 2010-2050. Policies adopted to help reduce harmful CO2 emissions and subsidies, and incentives created to increase investments, i.e., in natural capital and energy efficiency. Business as Usual Current trends assumed to continue with 2% of GDP per year allocated in a BAU across 10 key sectors from 2010-2050. Policies continue to support investment in non-green infrastructure, harmful fossil fuel and fishing subsidies, etc.
- 10. Key Findings Investing in natural capital, resource and energy efficiency can lead to: • Higher rates of GDP growth over time and enhanced wealth • Natural capital stocks • Reduced poverty • Decent employment
- 11. Key Finding: A Green Economy Stimulates Growth & Exceeds BAU Over Time… GDP growth (%)
- 12. …while reducing ecological scarcities and environmental risks
- 13. Results by 2050 … While preserving NATURAL CAPITAL …create employment … ensure economic growth …alleviate poverty … outperform BAU GREEN ECONOMY can…
- 14. Asia – Pacific: 23% of global green stimulus investments, originated in this region China: investing US$ 468 billion in greening key sectors by 2015; >double past five years. Indonesia: national development plan has a goal of a “green and everlasting Indonesia” by 2025. 7-41 target. (7% GDP increase; 41% GHG reduction by 2030) Republic of Korea: Green New Deal policy. 2% of GDP invested in Green Growth. Green Economy in Action
- 15. Towards a Green Economy • Economic growth, social development and environmental sustainability can be mutually compatible • Not a single «recipe» for all countries but financing is the key
- 16. 16 of ecosystems damaged or being used unsustainably additional middle class consumers by 2030 of global extraction of natural resources per year by 2050, if consumption stays at current developed country rates. rise in temperature by the end of the century, due to doubling of GHG emissions by 2050 , under BAU.
- 17. Why SCP? The Resource Crisis If we keep the current patterns of production & consumption Since the late 1980 ecological Footprint exceeded the Earth’s bio-capacity in 2003 by about 25% 2002 20501900 2100
- 18. Continued… Global material Use 1900 – 2005 (Krausmann et al. 2009)
- 19. Continued… Macro Trend: GDP, Material Productivity and Domestic Material Consumption in EU (Michal Miedzinski, 2011) Although the EU has achieved a relative decoupling of GDP growth from material use, the absolute level of consumption also grew.
- 20. Resource consumption on the rise MoldovaBelarus Ukraine Source: www.footprintnetwork.org accessed 5 Feb 2013 Armenia Azerbaijan No data for Georgia Resource consumption (measured in ecological footprint) exceeds available natural resources (measured in bio-capacity). While being on the rise in the region, resource consumption yet varies substantively in different countries and from a year-by-year perspective (between 1.7-4.o ha/person, relative to global average of 2.7)
- 21. Some environmental results of transition: decoupling economic growth from air emissionsArmenia BelarusAzerbaijan Georgia: no data Moldova Ukraine 0 50 100 150 200 250 300 350 400 2000 2001 2002 2003 2004 2005 2006 2007 2008 2009 0 50 100 150 200 250 300 350 400 2000 2001 2002 2003 2004 2005 2006 2007 2008 2009 0 50 100 150 200 250 300 350 400 2000 2001 2002 2003 2004 2005 2006 2007 2008 2009 0 50 100 150 200 250 300 350 400 2000 2001 2002 2003 2004 2005 2006 2007 2008 2009 0 50 100 150 200 250 300 350 400 2000 2001 2002 2003 2004 2005 2006 2007 2008 2009 GDP (constant prices) Air emission from mobile sources Air emission from stationary sources
- 22. Ukraine Domestic Material Consumption and Trade Balance 0.0 2.0 4.0 6.0 8.0 10.0 12.0 14.0 16.0 1992 1997 2002 2007 kg/$ DMC / GDP (kg / $US Year 2000 exchange based) Ukraine EECCA World Rest of World -2.5 -2.0 -1.5 -1.0 -0.5 0.0 0.5 1.0 1.5 2.0 2.5 1992 1997 2002 2007 Tonnes/Capita Physical Trade Balance / Capita 0.0 2.0 4.0 6.0 8.0 10.0 12.0 14.0 16.0 18.0 1992 1997 2002 2007 Tonnes/Capita Domestic Material Consumption / Capita 0.0 2.0 4.0 6.0 8.0 10.0 12.0 14.0 16.0 1992 1997 2002 2007 Tonnes/Capita Domestic Material Consumption / Capita Biomass Fossil fuels Metal ores and industrial minerals Construction minerals
- 23. The context of SCP in GE Transition to a Green Economy will be achieved through: a. Investments and policy measures aimed at improvements in resource efficiency b. Development of cleaner and low-carbon technologies and markets, and c. Reduction of environmental risks, while enhancing human well being, fostering green growth and decent job creation
- 25. Sector - Agriculture • Strong comparative advantage for many countries, inter alia: – suitable climatic conditions and rich biodiversity – less contaminated soils • Organic: – 2010: $59 billion > 2015: $105 billion – most production is in developing countries (> 75%), most consumption in developed countries (> 95%) – development of regional organic trade (e.g. South America) – increasing demand for value-added organic products (e.g. juices, spices) • Higher price premiums • Improved trade balances: use of local, instead of costly imported, inputs and increased exports of sustainable agrifood products
- 26. Seizing new trade opportunities US$ 22.8 mil (2007/8) US$ 6.2 mil (2004/5) US$ 3.7 mil (2003/4) 48-68% less emissions and carbon sequestration The global market: 97% of buyers in OECD countries; 80% of producers in Africa, Asia and Latin America A $ 50 bn market in 2007 growing at 10% per year The case of Uganda
- 27. Sector – Manufacturing impact on the environment Resource use: •35 per cent of global electricity use •Over 25% of primary resource extraction. •Water use by industry is expected to grow to over 20 per cent of global total demand by 2030. •High quality metal ores are gradually being depleted. As industries resort to lower‐grade ores, more energy is required to extract useful metal content. Responsible for: •Over 20 per cent of CO2 emissions. •Increasing risks associated with the use of hazardous substances. •17 per cent of air pollution‐related health damages with external costs equivalent to 1‐5% of global GDP.
- 29. Opportunities for manufacturing •greening manufacturing industries will help reduce energy consumption and emissions, reduce the upward pressure on prices of fossil fuels and – through avoided energy costs – help boost productivity and profit whilst stimulating GDP and overall employment. •Redesign of products and systems – cleaner technology and closed‐cycle manufacturing (re‐use, repair, remanufacturing and recycling) •Extend products life •Life‐cylcle approach •Sustainbale value chain management Modelling results : reduction of industrial energy consumption by almost one half compared to BAU senario.
- 30. Policy and policy instruments options •Emission and discharge standards for industries with requirements for the best available or best possible technology (BAT, BPT), 3P, 3R, EPR •Fiscal policy, comprising public expenditure, subsidies and taxation, can provide powerful incentives that alter the basic cost‐benefit calculation of producers and consumers: – govt can establish prices through taxes, fees and royalties or limit quantities through tradable permit schemes •Public institutions can support the validation and harmonization of eco‐labeling schemes, and establish consumer awareness and education programmes •Institutional support and soft technology approaches, •Research and Development to forster eco‐innovation •New industrial eco‐parks
- 31. • Global sales of organic food and drink = US$ 46 billion in 2007 (threefold increase since 1999) • Sales of certified ‘sustainable’ forest products quadrupled between 2005 and 2007 • From April 2008 to March 2009, the global market for eco‐ labeled fish products grew by over 50%, to a retail value of US$ 1.5 billion • Major consumer brand owners and retailers added ‘ecologically‐friendly’ attributes to their products: – Mars (Rainforest Alliance cocoa) – Cadbury (Fairtrade cocoa) – Kraft (Rainforest Alliance Kenco coffee) – Unilever (Rainforest Alliance PG Tips). Growing consumer interest in ‘green’ products...
- 32. UNEP’s Green Economy Initiative started in late 2008, and is focused on the following areas: • Advisory Services – providing technical assistance and advise in more than 20 countries • Research – including on how to measure progress towards a green economy • Partnerships – with UN agencies, governments, academic institutions, businesses and NGOs
- 33. For Europe & Central Asia:For Europe & Central Asia: Bosnia and Herzegovina,Bosnia and Herzegovina, Montenegro, Serbia, Armenia, Azerbaijan,Montenegro, Serbia, Armenia, Azerbaijan, Belarus, Moldova, Ukraine,Belarus, Moldova, Ukraine, Kazakhstan,Kazakhstan, (Russian Federation)(Russian Federation) UNEP’s work at countries Advisory Services World Map
- 35. Provide targeted support that will enable countries to transition to socially inclusive green economies. 35 Vision Objectives •To provide a springboard for action on commitments made at the Rio+20 Summit. •To create an enabling environment and strengthen the capacity of Governments in their transition to a green economy. •To harness expertise and ensure a coordinated response to countries’ needs.
- 36. PAGE is designed to mobilize resources and deliver tailored support for green economy action at the national level, which in turn will spur a global transition. Specifically, PAGE aims to: •Enable countries to formulate and adopt green economy policies. •Strengthen capacity of national partners to implement focused green economy initiatives, including key sectors. •Develop global access to green economy training and tools. •Create and share knowledge and country‐level applications.
- 37. PAGE Founding Partners • International Labour Organization (ILO) • United Nations Environment Programme (UNEP) • United Nations Industrial Development Organization (UNIDO) • United Nations Institute for Training and Research (UNITAR)
- 39. Investing in a New Generation of Assets • Clean technologies • Resource-efficient infrastructure • Well functioning ecosystems • Green skilled labour • Good governance
- 40. Measuring the Impact of PAGE • Increased decoupling of economic growth from resource consumption and environmental degradation • More decent green jobs • Number of people with access to safe water, clean energy, sanitation and other environmental amenities.
- 41. Thank you!