Houston Market Retail Report (2Q15)
•
1 like•385 views

Houston’s retail market tightens in the second quarter as demand continues to outpace new supply. Avison Young releases 2Q15 retail Market Report. (www.avisonyoung.com/offices/houston)

Recommended
Recommended
More Related Content
What's hot
What's hot (20)
Viewers also liked
Viewers also liked (20)
Similar to Houston Market Retail Report (2Q15)
Similar to Houston Market Retail Report (2Q15) (20)
Recently uploaded
Recently uploaded (20)
Houston Market Retail Report (2Q15)
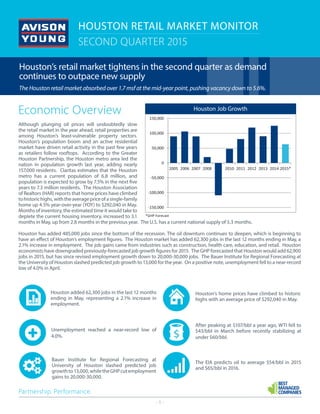
- 1. - 1 - HOUSTON RETAIL MARKET MONITOR SECOND QUARTER 2015 Partnership. Performance. Economic Overview Although plunging oil prices will undoubtedly slow the retail market in the year ahead, retail properties are among Houston’s least-vulnerable property sectors. Houston’s population boom and an active residential market have driven retail activity in the past few years as retailers follow rooftops. According to the Greater Houston Partnership, the Houston metro area led the nation in population growth last year, adding nearly 157,000 residents. Claritas estimates that the Houston metro has a current population of 6.8 million, and population is expected to grow by 7.5% in the next five years to 7.3 million residents. The Houston Association of Realtors (HAR) reports that home prices have climbed tohistorichighs,withtheaveragepriceofasingle-family home up 4.5% year-over-year (YOY) to $292,040 in May. Months of inventory, the estimated time it would take to deplete the current housing inventory, increased to 3.1 months in May, up from 2.8 months in the previous year. The U.S. has a current national supply of 5.3 months. Houston has added 485,000 jobs since the bottom of the recession. The oil downturn continues to deepen, which is beginning to have an effect of Houston’s employment figures. The Houston market has added 62,300 jobs in the last 12 months ending in May, a 2.1% increase in employment. The job gains came from industries such as construction, health care, education, and retail. Houston economists have downgraded previously-forecasted job growth figures for 2015. The GHP forecasted that Houston would add 62,900 jobs in 2015, but has since revised employment growth down to 20,000-30,000 jobs. The Bauer Institute for Regional Forecasting at the University of Houston slashed predicted job growth to 13,000 for the year. On a positive note, unemployment fell to a near-record low of 4.0% in April. *GHP Forecast Houston Job Growth ‐150,000 ‐100,000 ‐50,000 0 50,000 100,000 150,000 2005 2006 2007 2008 2009 2010 2011 2012 2013 2014 2015* Houston added 62,300 jobs in the last 12 months ending in May, representing a 2.1% increase in employment. Unemployment reached a near-record low of 4.0%. Bauer Institute for Regional Forecasting at University of Houston slashed predicted job growthto13,000,whiletheGHPcutemployment gains to 20,000-30,000. Houston’s home prices have climbed to historic highs with an average price of $292,040 in May. After peaking at $107/bbl a year ago, WTI fell to $43/bbl in March before recently stabilizing at under $60/bbl. The EIA predicts oil to average $54/bbl in 2015 and $65/bbl in 2016. Houston Job Growth Houston’s retail market tightens in the second quarter as demand continues to outpace new supply The Houston retail market absorbed over 1.7 msf at the mid-year point, pushing vacancy down to 5.6%.
- 2. - 2 - 0.0% 1.0% 2.0% 3.0% 4.0% 5.0% 6.0% 7.0% 8.0% 9.0% YE09 YE10 YE11 YE12 YE13 YE14 2Q15 Vacancy Rates Houston Retail Market Monitor Second Quarter 2015 NOTABLE SECOND QUARTER OCCUPANCIES: • Walmart Supercenter at 5461 S Rice Ave (178,000 sf). Southwest Near • Mercedes-Benz of The Woodlands (60,000 sf). Far North • Fitness Connection at Champion Forest Shopping Center (52,000 sf). Northwest Near • HEB at The Hollow at Oyster Creek (50,000 sf). Far South • Whole Foods at 1407 S Voss (45,000 sf). West Near • LA Fitness at Yale Street Market (42,000 sf). Inner Loop • HEB at 14100 Spring Cypress (20,000 sf). Northwest Far Retail Market Overview Growth in Houston’s retail market, coupled with limited new construction, has caused the market to tighten further in the second quarter. The Houston retail market has absorbed 1.7 million square feet (msf) of space at the mid-year point. 1.1 msf of new product has delivered year-to-date. Absorption has outpaced new supply, causing the vacancy rate to fall to 5.6% from 5.8% in the first quarter. At this point last year, vacancy registered 6.0%. Healthy demand as pushed average rates up to $15.21 per square foot (psf) up from $15.10 in the first quarter. An additional 1.8 msf is under construction, well-below the 10-year average of 2.8 msf, given the tight market conditions. Today’s retailers are facing a number of obstacles. While the energy downturn is expected to slightly cool Houston’s retail market over the next year, broader national trends are affecting the local area as well. Online retail continues to grow at double-digit rates, which is expected to increase as a larger amount of Millennials reach the point where they are making purchasing decisions. Many brick-and-mortar establishments have begun adapting to this by ramping up their online presence. Grocery stores are exempt from this, causing this type of retail development to remain active. Development in this sector has been led by HEB, Kroger, and Whole Foods. New grocers that entered the market in recent years include Aldi, Sprouts Farmers Market, and Trader Joe’s, fueling Houston’s “grocery wars”. Large, mixed-use centers have grown in popularity, slowly replacing the suburban mall model. Houston’s retail market will continue to be driven by trends that support the live, work, and play environment that is favored by Millennials. ABSORPTION & DEMAND TheHoustonretailmarketrecorded794,593squarefeet(sf)ofpositivenet absorption in the second quarter, totaling over 1.7 msf of absorption YTD. At mid-year 2014, the retail market had absorbed 2.6 msf. The second quarter marks the 11th consecutive quarter of positive net absorption. Much of the absorption was due to tenants taking occupancy of newly- deliveredprojects. Mostnotably,WalmartmovedintoitsnewSupercenter in the Southwest Near submarket totaling 178K sf. A variety of tenants, including Sprouts and LA Fitness, took occupancy of 125K sf at Yale Street Market,anewNeighborhoodCenterlocatedintheInnerLoopsubmarket. $13.80 $14.00 $14.20 $14.40 $14.60 $14.80 $15.00 $15.20 $15.40 YE09 YE10 YE11 YE12 YE13 YE14 2Q15 Asking Rents 0 500,000 1,000,000 1,500,000 2,000,000 2,500,000 3,000,000 3,500,000 4,000,000 4,500,000 YE09 YE10 YE11 YE12 YE13 YE14 YTD Net Absorption
- 3. - 3 - Construction of the Grand Parkway, Houston’s third major highwayloop,isdrivingactivityinnorthandwestHouston. The $1.1 billion project will connect Katy with the Woodlands when completed. New residential and office developments have been announced along the Grand Parkway, and retail activity has therefore increased in those areas. Additionally, Exxon completed its 3.1-msf campus in The Woodlands, and over 5.2 msf of office product has delivered in West Houston around the Energy Corridor in the last two years. These developments have significantly increased activity in the West Far and North Far retail submarkets, posting a YTD absorption of 339K sf and 209K sf, respectively. Baby boomers and Millennials have shifted demand towards a live, work and play environment, which is benefitting the Inner Loop submarket. The submarket has posted a positive absorption of 303K sf YTD. VACANCY & AVAILABILITY Vacancy in Houston retail market has fallen to 5.6% from 5.8% in the first quarter. At this point last year, vacancy registered 6.0%. The Houston retail vacancy rate has historically remained in the single-digits, peaking in 2009 at 9.0%. Vacancy is expected to remain tight throughout the remainder of the year due to limited new supply. The Inner Loop submarket has the lowest vacancy rate in Houston (3.4%), followed by West Far (4.1%) and Northeast Far (4.8%). By product type, single-tenant buildings historically have the lowest vacancy rates in Houston, although vacancy has not been this low (1.5%) since 2Q13. The majority of availability is found in Shopping Centers, particularly in North and Northwest Houston. RENTAL RATES Overall average asking rates have increased significantly since 2012 and continue to rise steadily. Asking rates increased from thepreviousquarterby$0.11psfto$15.21psf. Alowvacancyrate and sustained demand have pushed retail towards a landlord- favorable market and concessions remain limited. However, the energy downturn is expected to soften the market, and rental rate appreciation will slow throughout 2016. Areas that have experienced the largest increases in asking rates from the previous quarter include the North Far and West Far submarkets. CONSTRUCTION There is currently over 1.8 msf under construction in the Houston retail market. The majority of this space is expected to deliver in 2015. 1.1 msf has delivered to the market YTD. The largest project currently under construction broke ground inthesecondquarterintheWestFarsubmarket. TheShoppesat Parkwest totals 450,000 sf and is located within one mile of the Grand Parkway Loop in Katy, one of Houston’s fastest-growing suburbs. The Power Center development will be anchored by Bed Bath and Beyond, BuyBuy Baby, and Kirkland’s. According to the developer, the tremendous access granted by the new Grand Parkway has significantly changed the traffic patterns in Katy, allowing the location of The Shoppes at Parkwest to become a major retail hub for the entire trade area. Houston Retail Market Monitor Second Quarter 2015 Jeannie Tobin, Research Director 512.913.4438 jeannie.tobin@avisonyoung.com For more information: ©2015 Avison Young Texas, LLC. All rights reserved. avisonyoung.com 2Q15 COMPLETED BUILDINGS Westway Plaza (314,000 sf). FM 1960 2510 E Sam Houston Pky S (80,000 sf). Gulf Freeway/Pasadena Air Liquide Center North (143,830 sf). Katy Freeway East Energy Center Three (520,340 sf). Katy Freeway West Mason Creek Office Center II (127,955 sf). Katy Freeway West Woodbranch Plaza IV (168,050 sf). Katy Freeway West Academy Sports HQ (200,000 sf). Katy Freeway West The Offices at Sam Houston (108,633 sf). Northwest Tenant Name Building Submarket Square Feet Burlington Coat Factory The Market at Crenshaw Southeast Far 55,000 Ashley Furniture Deerbrook Corner Northeast Far 52,000 Fitness Connection Champion Forest Shopping Center Northwest Far 52,000 Largest Houston Transactions THE INFORMATION CONTAINED HEREIN WAS OBTAINED FROM SOURCES BELIEVED RELIABLE; HOWEVER, AVISON YOUNG MAKES NO GUARANTEES, WARRANTIES OR REPRESENTATIONS AS TO THE COMPLETENESS OR ACCURACY THEREOF. THE PRESENTATION OF THIS PROPERTY IS SUBMITTED SUBJECT TO ERRORS, OMISSIONS, CHANGE OF PRICE, OR CONDITIONS, PRIOR TO SALE OR LEASE, OR WITHDRAWAL WITHOUT NOTICE.