Nepse Technical Analysis July 05 - July 09, 2015
•
0 gostou•296 visualizações

Nepse Weekly Technical Analysis July 05 - July 09, 2015

Recomendados
Recomendados
Mais conteúdo relacionado
Mais procurados
Mais procurados (20)
Destaque
Destaque (20)
Semelhante a Nepse Technical Analysis July 05 - July 09, 2015
Semelhante a Nepse Technical Analysis July 05 - July 09, 2015 (19)
Mais de Kriti Capital & Investments Ltd.
Mais de Kriti Capital & Investments Ltd. (20)
Último
Último (20)
Nepse Technical Analysis July 05 - July 09, 2015
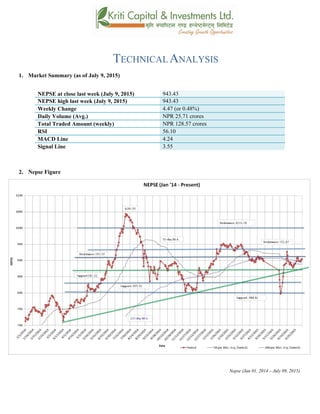
- 1. TECHNICALANALYSIS 1. Market Summary (as of July 9, 2015) NEPSE at close last week (July 9, 2015) 943.43 NEPSE high last week (July 9, 2015) 943.43 Weekly Change 4.47 (or 0.48%) Daily Volume (Avg.) NPR 25.71 crores Total Traded Amount (weekly) NPR 128.57 crores RSI 56.10 MACD Line 4.24 Signal Line 3.55 2. Nepse Figure Nepse (Jan 01, 2014 – July 09, 2015)
- 2. 3. Trend Analysis Nepse at the beginning of last week closed at 938.02. The benchmark index followed a bearish trend during the first two trading days of last week. However, it followed a bullish move for the rest of last week. The bullish momentum was triggered on Tuesday when the market gained 4.6 points. This is probably due to the positive news regarding the drafting of the constitution. 4. Resistance and Support Immediate Support 913.02 Support 2 900 Immediate Resistance 950.97 Resistance 2 972 The lowest Nepse went down to last week was at 936.76. Its immediate support level still stands at 913.02, and it does not seem to cross below the support level any time soon. Its immediate resistance level is at 950.97. With optimistic political news, such as completion of the first draft of the constitution, spreading across the country, the likeliness of the benchmark index crossing over the resistance level seems high. 5. Trend Indicator a.) MACD The MACD is a momentum oscillator formed by using two different types of moving averages, which provides specific buying or selling signals. When a MACD line crosses above the signal line, it is considered to be a positive sign and indicates a time to buy, and vice-versa. The Macd line made a slight descent at the beginning of last week. However, it picked up again by the end of the week. The signal line moved in an upward direction throughout the week. The distance between the macd and signal line have reduced as well. If the macd line crosses below the signal line, it would mean a bearish outlook. By the end of last week, the macd and signal lines ended at 4.24 and 3.55 respectively. b.) RSI RSI is a form of leading indicator that is believed to be most effective during periods of sideways movement. Such indicators may create numerous buy and sell signals that are useful when the market is not clearly trending upwards or downwards.
- 3. The RSI was at 53.20 level at the beginning of last week. It moved up most of the week, and it ended at – by the end of last week. The RSI has been hovering around the 50 level over the past few weeks, indicating a neutral stance. If it moves further up, it would signify an over-bought condition at the market. c.) Bollinger Bands The Bollinger Band is a technical indicator that consists of a moving average (21-day) along with two trading bands above (upper band) and below it (lower band). The bands are an indication of volatility, which are represented by calculating standard deviation. The benchmark index ended closer towards the upper Bollinger band last week. The index and the mid- band are still moving together and the mid band is also acting as a support level. If the index moves further upward towards the upper band, it would mean an over-bought condition at the market. The upper and lower bands have continued to close in, suggesting a decline in market volatility. 6. Volume Indicator (On-Balance Volume) On-Balance Volume (OBV) is a momentum indicator that relates volume to the current price of the index or security, which measures buying and selling pressure at the market. It acts as a cumulative indicator that adds volume on up days and subtracts volume on down days. If a price increase is supported by OBV, it confirms an uptrend, whereas if a price decrease is supported by OBV, it confirms a downtrend.
- 4. In the current context, the On-Balance Volume (OBV), once again, increased more than the growth experiences by the Nepse index. This again shows that investors have a bullish attitude towards the market. Although the average weekly volume transactions decreased to NPR 25.71 crores from NPR 31.90 crores the week prior, the total volume transaction on the last trading day of last week ended at NPR 36.44 crores. 7. Overview The Nepse index made modest gain of 4.47 points (or up 0.48%) last week to close at 943.43. The 50-day moving average (MA) is still below the 200-day moving average, which does not support a bullish trend in the market. However, the distance between the 50 and 200 days MA are converging, indicating a promising positive outlook of the market in the long run. The average weekly volume transactions decreased to NPR 25.71 crores from NPR 31.90 crores the week prior. Nevertheless, a minute increase in the benchmark index is supported by the OBV, indicating a bullish trigger. The RSI is still hovering around the 50 levels, ending at 56.10 level. The macd and signal lines are moving closer to each other. The index also ended closer to the upper Bollinger band. Touching the upper band will indicate an over-bought condition at the market.
- 5. k|fljlwsljZn]if0f !_ahf/ ;f/f+z -cfiff9 @$, @)&@ ;Ddsf]_ aGb cªs -cfiff9@$, @)&@_ ($#=$# pRr cªs -uPsf] ;ftf_ ($#=$# ;fKtflxs kl/jt{g $=$& -)=$*k|ltzt_ b}lgscf};t Jofkf/ ¿=@%=&!s/f]8 s'n ;fKtflxsJofkf/ ¿ !@*=%& s/f]8 cf/P;cfO{ %^=!) PdP;L8L $=@$ l;UgnnfO{g #=%% @_ ahf/ k|j[lt Nepse (Jan 01, 2014 – July09, 2015)
- 6. #_ 6]«G8 ljZn]if0f g]K;] kl/;"rsuPsf] ;ftfsf] z'?cftLlbgx?df (#*=)@ cªsdf /xof] . uPsf] ;ftfsf] z'?sf] s]xLlbgdftnem/]sf] ahf/ kl5Nnf] lbgdf a9g uof] . dËnaf/ af6 a'lnz 6«]G8 b]lvgyfNof] h;sf] kmn:j?kahf/ $=^ cªsn] dfly a9g uof] . ;+ljwfglgdf{0fsf] sfo{x?dfcfPsf] ;'wf/n] ubf{ ahf/df ;d]t o:sf] ;sf/fTds ;+s]tx? b]lvof] . $_ 6]jftyfk|lt/f]w cªs glhssf] 6]jfcªs (!#=)@ 6]jfcªs @ ()) glhssf] k|lt/f]w cªs (%)=(& k|lt/f]w cªs @ (&@ g]K;] kl/;"rsuPsf] ;ftf ;a} eGbftn (#^=&^ cªs ;Ddk'Uguof] . xfnsf] nfluglhssf] 6]jfcªsclxn] klg (!#=)@ g} /xguPsf] 5 / ;f] cem} s]xL ;dosf] nfluoyfjt /xg ;Sg] cj:yf 5 . xfnsf] nfluglhssf] k|lt/f]w (%)=(& g} /x]sf] 5 / /fhg}lts If]qdf b]lvb} uPsf] ;'wf/ ;+u ;+u} g]K;] kl/;"rsn] glhssf] k|lt/f]w cªs w]/} rfF8f] kf/ ug{ ;Sg] cj:yf /x]sf] 5 . %_ g]K;] 6]«G8 ;"rs s_ d'leª Pe/]hsGeh]{G; 8fOeh]{G; -PdP;L8L_ PdP;L8Ldf b'O{ cf]6f /]vf x'G5g, h;df Pp6fn] ahf/sf] lbzf kl/jt{gsf] ;+s]t u5{ eg] csf]{n] ahf/sf] k|j[lQ -6«]08_ b]vfpg] u5{ . olb PdP;L8L /]vfn] l;Ung /]vfnfO{ tnaf6 dfly sf6]dfo;nfO{ ;sf/fTds ;+s]tsf ?kdflnO{G5 / o;n] z]o/x? lsGg] ;+s]t ub{5 . PdP;L8L nfO{guPsf] ;ftfsf] z'?df s]xLtnemof]{ t/ ;ftfsf] cGTolt/ km]l/ ;f] nfO{g dflyclSng] s|dhf/L /xof] . l;UgnnfO{g ;d]t ;ftfsf] w]/} h;f] lbgdflyg} r9g] s|dhf/L g} /xof] . PdP;L8LnfO{g tyfl;UgnnfO{g aLrsf] b'?Ldf ;d]t sdLcfPsf] cj:yf /xof] . PdP;L8L nfO{g n] l;UgnnfO{gnfO{ sf6L tncfPsf] cj:yfdfo;n] ahf/dfa'lnz 6]«G8sf] ;+s]t ub{5 . ;ftfsf] cGTolt/ PdP;L8L nfO{g tyfl;UgnnfO{g s|dz M $=@$ tyf #=%% cªssf] l:yltdf /xguof] .
- 7. v_ l/n]l6j :6«]Gy OG8]S; -cf/P;cfO{_ cf/P;cfO{ k|fljlwsljZn]if0fsf] o:tf] cf}hf/ xf], h;nfO{ Pstlkm{ ?kdfrln/x]sf] ahf/dfJofkf/ /0fgLlt agfpg a9L pkof]uL dflgG5 . To;}u/L, o;n] ahf/dfvl/b / ljlqmsf] :ki6 ;+s]t b]vfpg] u5{ . cf/P;cfO{ ;ftfsf] z'?df %#=@) cªsdf /x]sf] lyof] . ;ftfsf] w]/} h;f] lbgcf/P:cfO{ dfly g} a9of] . uPsf] s]xL ;ftfx?dfcf/P;cfO{ %) cªssf] xf/fxf/Ldf /x]sf] x'Fbfxfnsf] nfluahf/ Go"6«ncj:yfdf g} /x]sf] ;+s]t ub{5 / cem} of] eGbfdflyhfg] xf] eg] ahf/ cf]e/–a6sf] l:yltdf k'Ug ;Sg] ;+Defjgf /x]sf] 5 . u_ af]lnªu/ Aof08 af]lnªu/ Aof08 Ps k|fljlwsljZn]if0f ;"rsxf] h;df @!–lbg] d'leËPe/]hsf ;fyb'O{ Aof08 -Pp6f dfly_ / Pp6f tn_ x'G5g . lo Aof08x?n] cl:y/tfsf] ;+s]t ub{5g, h'g :6fG88{ 8]leP;g u0fgf u/]/ kQfnufO{G5 . xfnsf] nflu g]K;] kl/;"rsdflyNnf] af]lnªu/ Aof08sf] glhsk'u]sf] 5 . g]K;] kl/;"rstyfdWo Jof08 xfnsf] nflu ;+u ;+u} rln/x]sf] cj:yf 5 tyfdWo Jof08n] ;d]t 6]jfcªssf] sfdul//x]sf] 5 . g]K;] kl/;"rscem} pkNnf] Jof08sf] glhshfg] xf] eg] o;n] ahf/dfcf]e/–a6 sf] l:ylt b]vfpF5 . pkNnf] tyftNnf] Jof08 aLrsf] b'/LdfcfPsf] sdLn] ahf/dfcl:y/tfdfsdLcfPsf] ;+s]t ub{5 .
- 8. ^_ eNo'd ;'rs -cg–Aofn]G; eNo'd_ cg–Aofn]G; eNo'd n] ahf/dflsGg] tyf a]Rg] k|];/sf] ;+s]t ub{5 . ;d|udf of] ;"rsn] ahf/ dflyuPsf] cj:yftyftnem/]sf] cj:yfdfahf/dfsf/f]af/sf] eNo'd s:tf] /xof] ;+s]t ub{5 . uPsf] ;ftfcg–Aofn]G; eNo'ddf g]K;] kl/;"rseGbf /fd|f] ;'wf/ b]lvof] . h;n] ahf/dfnufgLstf{x? dfemahf/ k|ltsf] b[li6sf]0f ;sf/fTds ?kdfa'ln; /x]sf] ;+s]t ub{5 . ;ftfsf] cf};t sf/f]af/ /sddfrfxL s]xLlu/fj6 b]lvof] hf] uPsf] ;ftf ?= #!=() s/f]8 lyof] eg] of] ;ftf ?= @%=&! s/f]8df /xguof] . ;ftf]sf] clGtdlbgeg] sf/f]af/ /sd ?= #^=$$ /xguof] . ;du{dfM uPsf] ;ftfsf/f]af/ lbgsf] clGtdb'O{ lbgafx]s g]K;]df a9g] s|d g} /xof] . (#*=(^ cªsdfaGbePsf] g]K;] kl/;"rsdf *=%* -)=(#Ü_ cªssf] a[l4 /xof] . tn /x]sf] cj:yfn] ahf/dfcl:y/tfcem} sfod /x]sf] ;+s]t ub{5 . t/ xfnsf] nflu%)–lbg] d'leËPe/]htyf@))–lbg] d'leËPe/]h ;+u ;+u} rln/x]sf] cj:yf 5 . cf};t sf/f]af/ /sddf ;d]t ;'wf/ b]lvof] hf] uPsf] ;ftf ?= #!=() s/f]8 /xguof] / ;f] /sd cl3Nnf] ;ftfeg] ?= @%=&! s/f]8 /x]sf] lyof] .%#=&$ cªsdf /x]sf] cf/P;cfO{ clxn] klg Go"6«n cj:yfdf /x]sf] 5 . z"GonfO{g eGbfdfly r9]sf] PdP;L8LnfO{gn] ahf/dfa'ln; 6«]G8 /x]sf] ;+s]t ub{5 .
- 9. pkNnf] tyftNnf] af]lnªu/ Jof08sf] b'/LdfcfPsf] sdLn] ahf/sf] cl:yt/tfdfsdLcfPsf] ;+s]t ub{5 . g]K;] kl/;"rscem} pkNnf] Jof08sf] glhshfg] xf] eg] o;n] ahf/dfcf]e/–a6 sf] l:ylt b]vfpF5 .