
Recomendados
Recomendados
Mais conteúdo relacionado
Mais procurados
Mais procurados (20)
Semelhante a G04463843
Semelhante a G04463843 (20)
Mais de IOSR-JEN
Último
Último (20)
G04463843
- 1. IOSR Journal of Engineering (IOSRJEN) www.iosrjen.org ISSN (e): 2250-3021, ISSN (p): 2278-8719 Vol. 04, Issue 04 (April. 2014), ||V6|| PP 38-43 International organization of Scientific Research 38 | P a g e The Influence of Stress Analyzed By The Emitted Fluorescence Changes Eriola (Zhuri) Hida1 , Veledin Çako2 , Fatbardha Babani3 , Theodhor Karaja 4 14 Physics Department, University of Politecnic, Tirana, Albania, 2 Department of Physics, University ‘Ismail Qemali’,Vlora, Albania, 3 Biotechnology Department, University of Tirana, Tirana, Albania, 4 Physics Department, University of Tirana, Tirana, Albania, Abstract: - The chlorophyll (Chl) fluorescence signatures of leaves have been widely applied as non-invasive techniques for the in vivo analysis of plant stress. The Chl fluorescence provides ample information on the photosynthetic apparatus as first discovered by Kautsky. Various ratios of the Chl fluorescence determined from the induction kinetics can be used as indicators of the stress effect to the photosynthetic apparatus. The high resolution multi-colour Chl fluorescence imaging techniques for whole leaves have been developed over the last years. These techniques offer the new possibility to study the distribution and patchiness of fluorescence signatures over the whole leaf area. The chlorophyll fluorescence induction kinetics (Kautsky effect) of pre- darkened leaves (30 min) was measured using the FluorCam 700MF imaging system (Photon Systems Instrument). The images of the measured Chl fluorescence intensity were obtained on false colour, whereby blue is the lowest (zero) and red the highest fluorescence. The images of various Chl fluorescence ratios were obtained by pixel to pixel arithmetic operations performed by FluorCam software. Efficiency of photosynthetic apparatus of analyzed endemic plants grown in different environmental stress conditions was evaluated via chlorophyll fluorescence imaging during induction kinetics and the fluorescence ratios which describe the photosynthetic light processes and quantum conversion of light. Keywords: - Chlorophyll fluorescence imaging, spontaneous plant, induction kinetics, photosynthetic apparatus. I. INTRODUCTION Air pollutions as toxic gases and dusts negatively affect plants by changing stomata conductance or blocking leaf stomata and prevent plant respiration, reducing photosynthesis rates, increasing leaf temperature, reducing leaf and plant growth, causing leaf injury as necrosis and chlorosis or speckle of brown spots. Acid rain (a product of air pollution) and soil contamination severely affect trees and plants as well. However, two or more pollutants acting together can have a synergistic effect, producing damage at lower concentrations than if they were acting separately (Colls, 2002). The contaminants emitted from the metalurgical complex impact on the environment causing many problems. Smelters, whose emissions contain toxic gases and dusts rich in heavy metals like Pb, Cu, Zn Cr, Ni and Cd, caused particularly these effects. The soils around metallurgical complex are contaminated by heavy metals such as cadmium, nickel, chromium, lead and copper as consequence of the industrial activity (Shallari et al., 1998, Sallaku et al., 1999) Plants grown in the area of the Metallurgical complex of Elbasan are repeatedly exposed to various stressors especially to air pollution gases (sulfide, dioxide etc), highly reactive oxygen species (O3, OH, H2O2) and dusts (Shallari et al., 1998, Sallaku et al., 1999). These stressors can affect the photosynthetic performance of leaves either directly or indirectly modifying their optical and fluorescence properties. The chlorophyll (Chl) fluorescence signatures of plants as a rapid, nondestructive diagnostic method allow to investigate the photosynthetic light processes and quantum conversion in plants (Lichtenthaler and Miehe, 1997; Govindjee. 2004; Krause and Weis, 1991; Lichtentaler and Babani, 2004; Schreiber, 1986). Recently, image analysis of the Chl fluorescence signal offers the possibility to study distribution and patchiness of fluorescence signatures over the whole leaf area. These techniques were developed as useful tool for determining the photosynthetic performance of plants as well as to detect and quantify early stress damage in plants. Imaging of Chl fluorescence during induction kinetics correctly screens the emission heterogeneity reflecting localized biotic or abiotic stress or heterogeneous metabolism (Buschmann and Lichtenthaler 1998, Lichtenthaler and Babani 2000; Lichtenthaler et al., 2000, Lichtenthaler and Babani 2004, Lichtenthaleret al., 2007, Nebdal et al. 2000, Schreiber 2004). The objective of the presented work is the evaluation of damage by Metallurgical complex on spontaneous plants (Populus deltoides Marsh. x Populus nigra L.) grown in sites with different level of air pollution characterizing the photosynthetic performance by chlorophyll fluorescence imaging.
- 2. Florescence Image and Photosythetic Activity Of Endemic Plants In Differences Air Pollution International organization of Scientific Research 39 | P a g e II. MATERIALS & METHODS Chlorophyll (Chl) fluorescence induction kinetics was measured using the FluorCam 700MF kinetics imaging system constructed by Photon Systems Instrument (Photon Systems Instruments, 2011). Chl fluorescence images and induction kinetics were measured on pre-darkened leaves (30 min) using the FluorCam quenching protocol. The images of the measured Chl fluorescence intensity were obtained on false colour, whereby black is the lowest (zero) and red the highest fluorescence intensity. The fluorescence emission is induced by two sets of 325 super-bright orange light emitting diodes (LED’s) (wavelength 605nm) that provide excitation flashes or a continuous actinic irradiance controlled by defined protocol. Fluorescence images are captured by a CCD camera at 12-bit resolution in 512x512 pixels of CCD chip. The size of an analyzed object is up to 1313 cm. Chlorophyll fluorescence images of parameters during induction kinetics as F0 and F0’ (minimum fluorescence in the dark and in the light-adapted states), Fm and Fm’ (maximum fluorescence in the dark and in the light-adapted states), Fp (initial fluorescence increase caused by the actinic light exposure) and Fs, (steady- state fluorescence in actinic light exposure) were recorded during induction kinetics. Images of various Chl fluorescence ratios obtained by pixel to pixel arithmetic operations performed by FluorCam software were: maximum quantum yields of Photosystem II Fv/Fm and Fm/Fo, effective quantum yields of Photosystem II Fv'/Fm‘ and Fm’/Fo’, fluorescence decline ratio in steady-state which assess plant vitality Rfd=(Fp-Fs)/Fs where Fv=Fm-Fo and Fv’=Fm’-Fo’. III. RESULTS & DISCUSSION Image Fluorescence parameters Image fluorescence parameters measured during induction kinetics in Table 1 represent the mean values of six different leaves. Whereby, the values of each parameter of every leaf calculated by FluoCam software, indicate the mean of the fluorescence signals of all pixels over the leaf area. The mean values of image fluorescence parameters demonstrate the differences between leaves grown in different conditions. The observed rising of the values of standard deviations from optimal growth conditions to pollution conditions can be illustrated the increase of the variability through the leaves as the effect to steel plant pollution exposure. Table 1: Induced fluorescence image parameters of leaves of Poplar grown in area of plan steel air pollution conditions (Site 1- 200 m, Site 2- 2,5 km) and optimal conditions (Site 3- Dajt, control) on August Populus x canadensis Moench Site 1 Site 2 Site 3 Image Fluorescence parameters October Fo mean 94.7 122.2 101.7 std 3.80 24.92 2.95 Fm mean 284.5 461.8 432.7 std 11.45 92.30 15.06 Fo' mean 131.5 130.2 136.0 std 3.16 31.24 2.34 Fm' mean 196.8 194.6 182.0 std 8.79 48.42 6.55
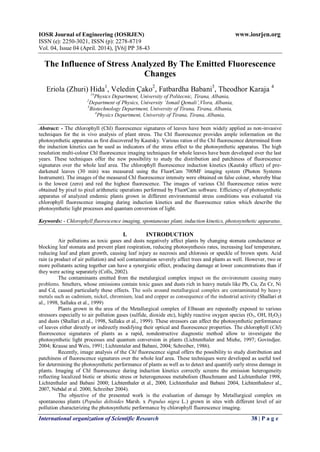
- 3. Florescence Image and Photosythetic Activity Of Endemic Plants In Differences Air Pollution International organization of Scientific Research 40 | P a g e Table 2: Induced fluorescence image parameters of leaves of Poplar grown in area of plan steel air pollution conditions (Site 1- 200 m, Site 2- 2,5 km) and optimal conditions (Site 3- Dajt, control) on October Chlorophyll fluorescence images Images at the maximum fluorescence of chlorophyll in the dark state Fm displayed at the same pseudoscale clearly show changes of the values of this parameter and the distributions of fluorescence signature related to the heterogeneity over leaf area between leaves grown in different conditions (Figure 1 and Figure 2). Fluorescence images at Fm of leaves grown in plan steel air pollution conditions (Site 1 – A area, Site 2 – B area) demonstrate a different distribution of the fluorescence signature over the leaf area as compare to the leaves grown in optimal conditions (Site 3 - Dajt). 0 600 0 700 0 700 Site 1 Site 3Site 2 Figure 1. Images at the maximum fluorescence in the dark Fm of a leaf grown in plan steel air pollution conditions (Site 1 - Bradashesh, 2km, Site 2 - Petresh, 14km) and optimal conditions (Site 3 – Dajt, control) on August. 0 600 0 700 0 700 Site 1 Site 3Site 2 Figure 2. Images at the maximum fluorescence in the dark Fm of a leaf grown in plan steel air pollution conditions (Site 1- Bradashesh, 2km, Site 2- Petresh, 14km) and optimal conditions (Site 3 – Dajt, control) on October. Screening of the fluorescence emission over the leaf area confirm the increase of the gradients and local irregularities especially in the leaves grown in Site 1, where the level of pollution is higher related to the nearer Populus x canadensis Moench Site 1 Site 2 Site 3 Image Fluorescence parameters August Fo mean 114.9 114,7 128.8 std 13.49 6,75 3.64 Fm mean 477.4 433,1 563.4 std 93.22 48,64 17.02 Fo' mean 104.2 131,5 124.9 std 66.55 16,42 4.04 Fm' mean 213.4 178,3 180.0 std 12.45 30,68 9.35
- 4. Florescence Image and Photosythetic Activity Of Endemic Plants In Differences Air Pollution International organization of Scientific Research 41 | P a g e distance from the metallurgical complex. Even on leaves grown in Site 2 (on October) can be detected local areas with a very low fluorescence signal that shown the high reduction of photosynthetic pigments. Chlorophyll fluorescence ratios The fluorescence ratios that allow to estimate maximum quantum yield of Photosystem II (Fv/Fm, Fm/Fo) and effective quantum yield of Photosystem II (Fv'/Fm‘and Fm’/Fo’) indicate a decrease of these ratios from optimal growth conditions at Site 3 (Dajt area - control) to stress-pollution conditions at Site 1 (A area, 200 m) and at Site 2 (B area, 2,5 km) (Tab. 2). The values of these ratios show a higher decrease in the leaves grown in Site 1 than in Site 2. These observed differences demonstrate a decline of the maximum and effective quantum yields of Photosystem II as the result of exposure of leaves to steel plant pollution conditions. The reduction of quantum yields seems to be related to the level of pollution, being higher at nearer distance from the metallurgical complex where the level of pollution is higher. The values of Chl decline ratios Rfd represent a higher mean values to leaves grown in the optimal conditions (Site 3 - mean values 2.66 and 2.12 respectively on August and October) comparing to two other pollution growth conditions in areas near the metallurgical unit (Site 1 - mean values 1.52 and 0.88, Site 2 - mean values 1.97 and 1.68 respectively on August and October) (Table 2). The observed rise of the values of standard deviations from optimal growth conditions to pollution conditions can be illustrate the increase of the variability through the leaves as the effect to steel plant pollution exposure. Table 3: Image fluorescence ratios of Poplar leaves grown in area of plan steel air pollution conditions (Site 1- A, 200m, Site 2- B, 2,5km) and optimal conditions (Site 3- Dajt, control) on August. Table 4: Image fluorescence ratios of Poplar leaves grown in area of plan steel air pollution conditions (Site 1- A, 200m, Site 2- B, 2,5km) and optimal conditions (Site 3- Dajt, control) on October. Populus x canadensis Moench Site 1 (200m) Site 2 (2.5km) Site 3 (control) Image Fluorescence ratios August Fm/Fo mean 3.96 3.77 4.37 std 0.19 0.20 0.11 Fv/Fm mean 0.75 0.73 0.77 std 0.01 0.01 0.01 Fm'/Fo' mean 1.51 1.35 1.44 std 0.06 0.06 0.05 Fv'/Fm' mean 0.33 0.26 0.31 std 0.03 0.04 0.02 Rfd mean 1.52 1.97 2.66 std 0.07 0.19 0.10 Populus x canadensis Moench Site 1 (200m) Site 2 (2.5km) Site 3 (control) Image Fluorescence ratios October Fm/Fo mean 3.01 3.79 4.25 std 0.21 0.39 0.06 Fv/Fm mean 0.67 0.73 0.77 std 0.02 0.03 0.00 Fm'/Fo' mean 1.50 1.49 1.34 std 0.03 0.04 0.03 Fv'/Fm' mean 0.33 0.33 0.25 std 0.01 0.02 0.02 Rfd mean 0.88 1.68 2.12 std 0.05 0.13 0.13
- 5. Florescence Image and Photosythetic Activity Of Endemic Plants In Differences Air Pollution International organization of Scientific Research 42 | P a g e Chlorophyll fluorescence decline ratio images - Rfd images Images of the fluorescence decline ratio Rfd of a green leaf grown in optimal conditions at Site 3 in Dajt area - control show almost no irregularities and a uniform distribution of the values of this ratios over the leaf area (Figure 3, Figure 4). The values of Rfd ratios as plant vitality indicator demonstrated that these green leaves can be characterized by a high photosynthetic activity, as reflect by the mean values of the ratios 2.66 and 2.12 respectively on August and October (Table 2). The distribution of the Rfd indices over the leaf area display an increase of the gradients and local irregularities of the leaves grown in plan steel air pollution growth conditions, Site 1- 200 m area, Site 2- 2,5 km area, in comparison of leaves grown in optimal conditions (Dajti area) especially in the leaves grown in Site 1, where the level of pollution is higher related to the nearer distance from the metallurgical complex. 0 3 Site 1 Site 3Site 2 Figure 3. The fluorescence decline ratio image Rfd of leaves grown in plan steel air pollution conditions (Site 1- A, 200m, Site 2- B, 2.5km) and optimal conditions (Site 3- Dajt, control) on August (pseudoscale 0 - 3). 0 3 Site 1 Site 3Site 2 Figure 4. The fluorescence decline ratio image Rfd of leaves grown in plan steel air pollution conditions (Site 1- A, 200m, Site 2- B, 2.5km) and optimal conditions (Site 3- Dajt, control) on October (pseudoscale 0 - 3). Very low Rfd signal identified at local areas on leaves grown in Site 2 on October show the high reduction of photosynthetic performance as damage of the photosynthetic apparatus and photosynthetic electron transport. The distribution of the Rfd values over the leaf area as well as the values of the ratios exhibit a lower activity of photosynthetic apparatus of the leaves grown in plan steel air pollution growth conditions, Site 1- 200 m area, Site 2- 2,5 km area, in comparison of leaves grown in optimal conditions (Dajti area). The decline of activity of photosynthetic apparatus seems to be related to the distance of the source of pollution (Figure 3, Figure 4, Tab. 2). IV. CONCLUSIONS Fluorescence images measured during induction kinetics, values of the fluorescence parameters and distribution of the fluorescence signal and the Rfd values over the leaf area in the leaves of spontaneous plant Populus x canadensis Moench grown in optimal conditions (Dajti area - site 3) exhibited a high photosynthetic activity as is demonstrated by the values of fluorescence ratios which evaluate the plant vitality and maximum quantum yield of photosynthetic apparatus: Rfd=2.66, 2.12; Fm/Fo=4.37, 4.25 respectively on August and October. Activity of photosynthetic apparatus of leaves of Populus x canadensis Moench grown in plant steel air pollution conditions in Site 2 at B area in a distance of 2.5km from source of pollution was generally lower than activity of plants grown in optimal conditions as is expressed by a non uniform distribution and increase of irregularities of the fluorescence signal at Fm and Rfd ratios over the leaf area as well as by the values of the fluorescence ratios: Rfd=1.9, 1.68; Fm/Fo=3.77, 3.79 respectively on August and October. Activity of photosynthetic apparatus of leaves of Populus x canadensis Moench grown in plant steel air pollution conditions in Site 1, Elbasan area at Bradashesh in a distance of 200m from source of pollution, demonstrate a higher reduction of the activity of photosynthetic apparatus compare to other areas as is expressed by the lowest values of fluorescence decline ratio (Rfd=1.52, 0.88 and Fm/Fo=3.96, 3.01 respectively on August and October) and the increased of non-uniformity distribution and heterogeneity of signal of fluorescence and plant vitality index over the leaf area.
- 6. Florescence Image and Photosythetic Activity Of Endemic Plants In Differences Air Pollution International organization of Scientific Research 43 | P a g e Based on images of the analyzed chlorophyll fluorescence signatures during induction kinetics and fluorescence ratios, increased of non-uniformity distribution and heterogeneity of signal over the leaf area and the values of fluorescence parameters at certain state during induction kinetics could be demonstrated that the decline of photosynthetic apparatus activity in pollution conditions is related to the level of pollution indicated by the distance of the source of pollution, metallurgical complex of Elbasan. Consequently, contamination effect reflected on decline of photosynthetic activity of leaves could be particularly very high on plants grown in locations nearer the metallurgical units. V. ACKNOWLEDGEMENTS We gratefully extend our acknowledgements to the Biotechnology Department of the Natural Sciences Faculty, UT, where the experimental work was performed. We wish to thank especially technical staff Eremira Misiri, for qualified assisting during all preparatory work and necessary fluorimetric measurements. REFERENCES [1] Babani F. and Lichtenthaler H.K. (1996). Light-induced and age-dependent development of chloroplasts in etiolated barley leaves as visualized by determination of photosynthetic pigments, CO2 assimilation rates and different kinds of chlorophyll fluorescence ratios. J Plant Physiol 148: 555-566 [2] Buschmann C. and Lichtenthaler H.K. (1998). Principles and characteristics of multi-colour fluorescence imaging of plants. - J. Plant Physiol. 152: 297-314. [3] Colls, J. (2002). Air Pollution. New York: Spon Press: 354. [4] Govindjee (2004): Chlorophyll a fluorescence: A bit of basics and history. In: Papageorgiou G, Govindjee (eds.) Chlorophyll fluorescence: A signature of Photosynthesis. Kluwer Academic Publishers, Dordrecht, The Netherlands: 1-42. [5] Krause G.H. and Weis E. (1991). Chlorophyll fluorescence and photosynthesis: the basics. Ann Rev Plant Physiol Plant Mol. Biol 42: 313-349. [6] Lichtenthaler H.K. and Babani F. (2000). Detection of photosynthetic activity and water stress by imaging the red chlorophyll fluorescence. Plant Physiology Biochemistry 38: 889-895. [7] Lichtenthaler H.K. and Babani F. (2004). Light adaptation and senescence of the photosynthetic apparatus. In George Papageorgiou G, Govindjee (eds.): Chlorophyll Fluorescence: A Signature of Photosynthesis, Kluwer Academic Publishers. Dordrecht, The Netherlands: 713-736. [8] Lichtenthaler H.K. and Miehe J.A. (1997) Fluorescence imaging as a diagnostic tool for plant stress. Trends Plant Sci 2: 316-320. [9] Lichtenthaler H.K., Babani F., Langsdorf G. (2007). Chlorophyll fluorescence imaging of photosynthetic activity in sun and shade leaves of trees. Photosynthesis Research, 93: 235-244. [10] Lichtenthaler H.K., Babani F., Langsdorf G., Buschmann C. (2000). Measurement of differences in red chlorophyll fluorescence and photosynthetic activity between sun and shade leaves by fluorescence imaging. Photosynthetica 38: 521-529. [11] Nedbal L., Soukupova J., Kaftan D., Whitmarsh J. and Trtilek M. (2000): Kinetic imaging of chlorophyll fluorescence using modulated light. Photosynthesis Research 66: 3-12. [12] Sallaku F., Shallari S., Wegener H.-R and Henningsen P.F. (1999). Heavy metals in industrial area of Elbasan. Bull. Agric. Sci. (in Albanian) 3:85-92. [13] Schreiber U (2004) Pulse-Amplitude (PAM) fluorometry and saturation pulse method. In: Papageorgiou G, Govindjee (eds.) Chlorophyll fluorescence: A signature of Photosynthesis. Kluwer Academic Publishers, Dordrecht, The Netherlands: 279-319. [14] Shallari S., Schwartz C., Hasko A. and Morel J.L. (1998). Heavy metals in soils and plants of serpentine and industrial sites of Albania. Sci. Total Environ. 209:133-142. [15] Photon Systems Instruments (2011) FluorCam Instruction Manual, http://www.psi.cz.