SlideShare uma empresa Scribd logo
1 de 10
Baixar para ler offline
Ecology, 88(9), 2007, pp. 2270–2279
Ó 2007 by the Ecological Society of America


WOODY PLANT RICHNESS AND NDVI RESPONSE TO DROUGHT EVENTS
       IN CATALONIAN (NORTHEASTERN SPAIN) FORESTS
                F. LLORET,1,5 A. LOBO,2 H. ESTEVAN,3 P. MAISONGRANDE,4 J. VAYREDA,3                AND   J. TERRADAS1
1
    CREAF (Center for Ecological Research and Forestry Applications) - Departament de Biologia Animal, Biologia Vegetal i Ecologia,
                                   Universitat Auto `noma de Barcelona, 08193 Bellaterra, Barcelona, Spain
               2
                 Institut de Cie`ncies de la Terra ‘‘Jaume Almera’’ (CSIC), Lluis Sole´ Sabarı´s s/n, 08028 Barcelona, Spain
     3
       CREAF (Center for Ecological Research and Forestry Applications), Universitat Auto       `noma de Barcelona, 08193 Bellaterra,
                                                              Barcelona, Spain
     4            ´
       Centre d’Etudes Spatiales de la Biosphe`re (CESBIO), bpi 2801, 18, avenue Edouard Belin, 31401 Toulouse Cedex 9, France

                   Abstract. The role of species diversity on ecosystem resistance in the face of strong
               environmental fluctuations has been addressed from both theoretical and experimental
               viewpoints to reveal a variety of positive and negative relationships. Here we explore
               empirically the relationship between the richness of forest woody species and canopy
               resistance to extreme drought episodes. We compare richness data from an extensive forest
               inventory to a temporal series of satellite imagery that estimated drought impact on forest
               canopy as NDVI (normalized difference vegetation index) anomalies of the dry summer in
               2003 in relation to records of previous years. We considered five different types of forests that
               are representative of the main climatic and altitudinal gradients of the region, ranging from
               lowland Mediterranean to mountain boreal-temperate climates.
                   The observed relationship differed among forest types and interacted with the climate,
               summarised by the Thorntwaite index. In Mediterranean Pinus halepensis forests, NDVI
               decreased during the drought. This decrease was stronger in forests with lower richness. In
               Mediterranean evergreen forests of Quercus ilex, drought did not result in an overall NDVI
               loss, but lower NDVI values were observed in drier localities with lower richness, and in more
               moist localities with higher number of species. In mountain Pinus sylvestris forests NDVI
               decreased, mostly due to the drought impact on drier localities, while no relation to species
               richness was observed. In moist Fagus sylvatica forests, NDVI only decreased in plots with
               high richness. No effect of drought was observed in the high mountain Pinus uncinata forests.
                   Our results show that a shift on the diversity–stability relationship appears across the
               regional, climatic gradient. A positive relationship appears in drier localities, supporting a null
               model where the probability of finding a species able to cope with drier conditions increases
               with the number of species. However, in more moist localities we hypothesize that the
               proportion of drought-sensitive species would increase in richer localities, due to a higher
               likelihood of co-occurrence of species that share moist climatic requirements. The study points
               to the convenience of considering the causes of disturbance in relation to current
               environmental gradients and historical environmental constraints on the community.
                   Key words: climate change; ecosystem resistance; forest dieback; Mediterranean forests; NDVI; species
               diversity.


                          INTRODUCTION                               between diversity and the resistance of the ecosystem
  The role of species diversity in the functioning of                (Tilman and Downing 1994, McGrady-Steed et al. 1997,
ecosystems has become one of the most challenging                    Naem and Li 1997). However, Loreau (2000) used a
topics in recent ecological research. Evidence of great              model approach to conclude that resistance may decrease
human-induced transformations ranging from the local                 or increase with increasing diversity. A selection mech-
to the global scale has highlighted the importance of this           anism (Huston 1997) (equivalent to the sampling effect
question. One particular issue concerns the role of species          described by Tilman et al. 1997), by which ‘‘diversity
diversity on ecosystems’ ability to face strong environ-             increases the range of trait variation and a selective
mental fluctuations, such as extreme climate events,                  process promotes dominance by species with extreme
which in some cases can be considered as disturbances.               trait values’’ (Loreau 2000), would explain these different
Experimental results point to a positive relationship                relationships. A positive relationship would be found if
                                                                     the disturbance has a negative effect on most species and
                                                                     diversity enhances the probability of finding the species
  Manuscript received 13 July 2006; revised 7 February 2007;
                                                                     best adapted to afford the new conditions (Loreau 2000).
accepted 12 February 2007. Corresponding Editor: T. J.
Stohlgren.                                                           This response would be enhanced by historically-
  5 E-mail: francisco.lloret@uab.es                                  fluctuating selective pressures that remain promoting
                                                                 2270
September 2007                     DROUGHT RESISTANCE AND PLANT RICHNESS                                               2271

the occurrence of traits fitting the new conditions.                 In addition, extensive forest inventories provide
Alternatively, a greater number of species may imply             reliable information about the forest composition of
greater changes in ecosystem properties under the new            woody species across large territories, and both types of
disturbance conditions when competitive pressures                information may be integrated into geographical infor-
under non-disturbance conditions tended to eliminate             mation systems (GIS).
disturbance-tolerant species from the community.                    During the summer of 2003 an intense drought
   Climate models and current empirical trends point to an       episode occurred in southwestern Europe, which was
increase of climatic variability in some regions, resulting in   well documented by remote sensing imagery (Gobron et
a greater number and intensity of extreme events (Voss et        al. 2005, Lobo and Maisongrande 2005). In the present
al. 2002). In the particular case of the Mediterranean           study, we analyze the relationship between woody
Basin, where water availability is the major environmental       species richness obtained from extensive forest invento-
constraint to plant growth, and where episodes of drought        ries in Catalonia (northeastern Spain) and drought
resulting in forest dieback have been recorded in the last       impact on the canopy of forests, estimated as NDVI
decades (Penuelas et al. 2001, Lloret et al. 2004), current
              ˜                                                  anomalies of the year 2003 in relation to median NDVI
models predict warmer and drier conditions (Houghon et           records of previous years. We assume that the canopy
al. 2001, Gibelin and Deque 2003), with increased                NDVI values in the dense forests under study were
seasonal and inter-annual variability resulting in more          mostly determined by woody species. We consider five
common and intense drought events (Houghton et al.               different types of forests, defined by their dominant tree
2001, Sanchez et al. 2004).                                      species, which are representative of the main climatic
   As experimental manipulation of climate and richness          and altitudinal gradients of the region. Our main
in forest ecosystems is unlikely to be performed, direct         hypothesis is that species richness correlates positively
                                                                 with canopy resistance to drought, this pattern being
observations of the effect of extreme climate events are
                                                                 more evident in those communities where drought
currently the most reliable approach for investigating
                                                                 intensity was higher, and where drought-driven selection
the relationship between forest species richness and the
                                                                 has been historically prevalent.
effects of extreme drought on forest properties. In
addition, extensive sampling is recommended to inves-                                       METHODS
tigate regional patterns, on a similar scale to that at
                                                                                           Study area
which drought occurs. The scaling-up of the level of
observation requires integrative variables related to              Catalonia (0815 E, 40830 0 N to 3815 0 E, 42840 0 N,
                                                                                       0

ecosystem functioning, although accurate details of              ;31 900 km2) is located in the northeast of the Iberian
functioning at stand level may be missed. Remote                 Peninsula, including the Pyrenean range to the north
sensing imagery has been revealed as a useful tool to            and bounded to the east by the Mediterranean Sea.
describe structural patterns of vegetation determining           Most of the area falls under different degrees of
primary productivity in relation to between-year climat-         Mediterranean climate, with a main climatic-topograph-
ic variability at local and regional scales (Tucker and          ic gradient from a temperate-boreal climate (mean
Sellers 1986, Paruelo et al. 2001). NDVI (normalized             annual precipitation of up to 1500 mm) in the Pyrenees,
difference vegetation index) is a normalized contrast            to a Mediterranean climate of mild winters and dry
between near infrared and red reflectance, thus empha-            summers (mean annual precipitation from 530 mm) in
sizing the presence of green vegetation in the area              the southern extreme. There is also a continental,
corresponding to the pixel. Since NDVI integrates both           semiarid gradient inland towards the west, with colder
the abundance of green vegetation and its greenness, it          winters, very hot summers, and low rainfall (mean
has a certain consubstantial ambiguity. Also, as NDVI            annual precipitation around 400 mm). Vegetation types
is a two-dimensional approximation to a three-dimen-             across the climatic-topographic gradients include scle-
                                                                 rophyllous, evergreen shrublands and forests, deciduous
sional reality in which leaves tend to be arranged in
                                                                 forests, and coniferous forests (Folch 1981), all with a
different layers, the relationship between NDVI and
                                                                 long history of human management.
PAR tends to saturate in the case of highly multilayered
canopies. Notwithstanding, if time series are available                  Climatic data and remote sensing estimation
for post-processing and certain observations (i.e.,                                   of forest drought
extreme angles) are disregarded, NDVI is a linear
                                                                                          `
                                                                   From the Atlas Climatic Digital de Catalunya, we
estimate of the fraction of photosynthetically active
                                                                 obtained for each plot locality the Thorntwaite index as
radiation (PAR) that is intercepted by the photosynthe-
                                                                 a standard index that effectively describes the aridity–
sizing tissue of vegetation present in the pixel. Because
                                                                 moisture climatic gradient, from the Mediterranean
of the aforementioned multilayering, NDVI correlations
                                                                 coast to the mountains inland (Lloret et al. 2005; atlas
between NDVI and LAI (leaf area index; i.e., Chen and
                                                                 available online). 6 The Thorntwaite index was
Cihlar 1996, Cohen et al. 2003) are more variable, with a
                                                                 calculated as follows:
less close fit and quicker saturation than in the case of
APAR. NDVI has also been found to correlate to
ecosystem CO2 flux (Wylie et al. 2003, Li et al. 2005).             6   hhttp://magno.uab.es/atles-climatic/i
2272                                             F. LLORET ET AL.                                 Ecology, Vol. 88, No. 9


       Thorntwaite index ¼ ðP À ETP Þ 3 100=ETP              average annual series of monthly mean NDVI images
                                                             for the period 1999–2002, which we used as the
where P is annual precipitation (mm), and ETP is annual
                                                             ‘‘normal’’ reference, and an annual series of monthly
potential evapotranspiration (mm), which is the sum of
                                                             mean NDVI images for 2003. We calculated the
monthly evapotranspiration values calculated following
                                                             difference between the respective 2003 and 1999–2002
the Thorntwaite formula (Thorntwaite 1948). This
                                                             mean NDVI values, and we finally estimated NDVI
calculation considers for each plot locality the mean
                                                             anomalies as the difference between the respective 2003
monthly average values of temperature, that were
                                                             and 1999–2002 mean NDVI values (Fig. 1). Considering
                                `
obtained from the Atlas Climatic Digital de Catalunya,
                                                             that the period of drought concluded by the end of
and a coefficient estimated by the numbers of days in a
                                                             August in southwestern Europe, we use in this study the
month and the daily hours of sun as a function of
                                                             anomaly of NDVI in August 2003 as an estimate of the
latitude.
                                                             impact of the drought in the canopy. Also, this month is
   The difference between precipitation and evapotrans-
                                                             at the peak of the dry season, when a large part of the
piration can be considered as an estimation of the
                                                             herbaceous vegetation has probably burned off, causing
balance between atmospheric water supply and demand
                                                             the minimal interference to the NDVI scores.
(Lobo and Maisongrande 2005). During the drought
episode of the summer of 2003, in most of our region of                        Species richness data
study, the difference between total precipitation and
evapotranspiration showed a negative anomaly of more            Richness data are based on circular field plots
than 100 mm (Lobo and Maisongrande 2005). This               established in the Third National Forest Inventory of
information was obtained by comparing climate and                                     ´
                                                             Spain (IFN3; Direccion General de Conservacion de la´
meteorological data of June, July, and August 2003 to        Naturaleza 2006). Sampling was conducted from 2000 to
data of the same months for the period 1961–2000,            2001 at a density of 1 plot/km2, following a regular
provided as grids of 5 3 5 km resolution by the Spanish      design within the forested surface of the whole territory
Instituto Nacional de Metereologia (INM) (Lobo and           (Fig. 1). Each plot was located in the field by a global
Maisongrande 2005).                                          positioning system (GPS), allowing for cross-references
   The vegetation response to water deficit was assessed      with climatic databases (see footnote 6).
from the normalized difference vegetation index (NDVI;          The IFN3 survey includes exhaustive information on
Tarpley et al. 1984) included in the S10 products that are   the composition of canopy and understory woody
derived from images acquired by the VEGETATION               species, as well as on production and structure. We
instrument onboard satellite SPOT. VEGETATION is             restricted our analysis to this group as no consistent
an optical multi-spectral instrument that acquires a daily   information is available for non-woody species. Shrub
and almost complete cover of the Earth’s surface at 1-       and regenerative trees (defined as those with a normal
km2 resolution in four spectral bands (Hagolle et al.        diameter, measured 50 cm above the ground surface,
2004). S10 products are calibrated, atmospherically and      below 75 mm) were sampled within circular plots with a
geometrically corrected images.                              radius of 10 and 5 m, respectively). Extensive stands of
   The VEGETATION S10 collection is produced from            regenerative trees after clearing are not common in the
temporal compositing of calibrated, atmospherically          region and are not included in the study. Plot size for
and geometrically corrected images, by the combination       sampling the rest of the trees varied in order to sample
of daily images in periods of 10 days. The aim is to         enough individuals belonging to the largest size classes
create a synthetic reconstruction from cloud-free images     present in the plot. In order to minimize species richness
that is assumed to be representative of each 10-day          bias due to plot size, we compared the richness shown by
period. The maximum value composite (MVC; Holben             plots of different size in each forest type. In the cases
1986) procedure is used for compositing in VEGETA-           where differences arose (Fagus sylvatica and Pinus
TION S10 products. MVC selects, for each pixel, the          sylvestris forests), we only selected the most common
maximum NDVI value among 10 daily images. Al-                size (15 m radius), which was considered to be the most
though alternative compositing methods have been             representative for that type of forest. When there were
developed (Hagolle et al. 2005), MVC is the only             no significant differences in species richness between
method currently implemented in the processing chain         plots of different size (Quercus ilex, Pinus halepensis, and
of the S10 collection. Time series of NDVI composites        Pinus uncinata forests), we pooled these plots in the
produced by this method have been used successfully to       analysis. This process reduced the original 9126 IFN3
monitor surface dynamics at global and regional scales       plots for Catalonia to 7567, most of them with a radius
(Zhou et al. 2001, Lucht et al. 2002, Nemani et al. 2003).   of 15 m. Finally, since large variation in richness among
   We used a data set of S10 products of the region of       plots may produce no significant differences between
study from 1999 to 2003, with a resolution of 3200           plot size classes, we minimized the effect of plot size on
(seconds). NDVI values in S10 products are linearly          the relationship between NDVI anomaly and species
scaled from the observed jÀ0.1, 0.9j range to the integer    richness by including it as an explicative variable in the
range j0, 250j, and we kept this scale. We computed an       statistical analysis, as detailed below.
September 2007                      DROUGHT RESISTANCE AND PLANT RICHNESS                                                     2273


   FIG. 1. Map of the studied region (Catalonia, Spain) showing the pattern of the woody species richness obtained from field
plots (left) and the 2003 summer NDVI (normalized difference vegetation index) anomaly (right). The darker the gray, the greater is
the species richness and drought impact, respectively. Negative values of the NDVI anomaly correspond to lower values of NDVI
in August 2003 than in the reference August. Values of NDVI are linearly scaled to the range j0, 250j.


                        Data analysis                              from plots should show some degree of autocorrelation
   In order to ensure a reliable correspondence between            in short distances (1 km). Alternatively, a random
IFN3 information and pixel information, we applied an              spatial distribution of richness values from sites 1 km
additional filter to avoid plots located in heterogeneous           apart would indicate that the richness estimated in small
areas, so that reflectance from the forest canopy does              sampling units is not representative of spatial patterns
not dominate the corresponding pixel values. Thus, we              on a larger scale. This assumption was supported by a
defined a 1-km2 grid coincident with the pixels of the              spatial autocorrelation analysis of the selected plots,
imagery and selected those cells including inventory               which indicated that the pattern of species richness does
plots and satisfying two criteria: (1) land cover category         not change across the neighbouring areas (Mantel test in
having dense forest in more than 50% of the cell, and (2)          which the main factors were the absolute differences
tree canopy cover being more than 50% in the respective            between species richness for each pair of inventory plots
inventory plots. This second filter reduced the number of           and the geographical Euclidean distance between them, r
plots (and pixels) to 3504. After applying the filters, we          ¼ 0.125, P , 0.001; for distances up to 15 km, r ¼ 0.075,
crossed the selected inventory data and the NDVI values            P , 0.001; for distances up to 60 km, r ¼ 0.036, P ,
obtained in the respective 1-km2 pixel surrounding the             0.001).
plot location, following the nearest neighbor procedure               We also tested this assumption by comparing plot
of the Miramon GIS (Pons 2000). Since 1-km2 NDVI                   richness values to records of species richness on larger
anomalies are obtained from averaged continuous forest             spatial scales obtained from the BIOCAT data bank
canopies, we assumed that they can be applied to smaller           (available online).7 BIOCAT provides the list of plant
pieces of forest, such as those sampled at the plot scale.         species recorded by botanists at 10 3 10 km UTM grids
   We also assumed that the number of woody species at             covering the whole Catalonia territory. We selected 33 10
plot level is a reliable estimate of woody species richness        3 10 km grids where forest cover was largely dominant
in the surrounding forest areas. More specifically, we              (more than 75% of the territory) and included at least 10
assumed that the spatial pattern of richness in small              plots, from which we calculated the mean species
sampling units 1 km apart follows the same pattern as
adjacent 1-km2 units. If this assumption is true, richness           7   http://biodiver.bio.ub.es/biocat/homepage.htmli
2274                                                 F. LLORET ET AL.                                  Ecology, Vol. 88, No. 9

TABLE 1. GLM results for the different forest types considering NDVI anomaly (August 2003) as the dependent variable and
  woody species richness, Thorntwaite index, UTM x and y coordinates, and plot size as explicative variables.

                                            Pinus halepensis                                      Quercus ilex
                                                                Parameter                                          Parameter
       Parameter              F1, 457         P                  estimate          F1, 556         P                estimate
Richness (R)                   7.02          0.008          0.238 (0.009)          10.33         ,0.001           0.402 (0.105)
Thorntwaite index (T )         1.82          0.178         À0.118 (0.009)          14.61         ,0.001           0.115 (0.036)
R3T                            3.16          0.076          0.076 (0.011)           6.74          0.010          À0.007 (0.003)
Coordinate x                   0.08          0.776                                  0.79          0.374
Coordinate y                  58.97         ,0.001                                  1.76          0.185
Plot size                      0.01          0.909                                  0.27          0.603

  Notes: Values in parentheses are SE.


richness. We obtained a significant positive correlation (r        may determine richness values and consequently may
¼ 0.765, F1,32 ¼ 43.74, P , 0.0001, slope ¼ 4.39) between         indirectly influence the relationship between NDVI
woody species richness at the plot scale and at the 10 3 10       anomaly and species richness we also included plot size
km scale, supporting our assumption that richness values          in the model as an additional explicative variable.
obtained at plot level may be correlated to NDVI 1-km2               We also built similar GLMs for each type of forest,
estimates at intermediate scales.                                 including woody species richness, Thorntwaite index,
   We selected five types of forests that were represen-           UTM x and y coordinates and plot size as explicative
tative of the climatic conditions of the area of study.           variables. Since all the plots in F. sylvatica and P.
These forest types were defined by its respective                  sylvestris were of the same size (15 m radius), this
dominant species (accounting for .50% of the plot                 variable was not included in the analysis of these two
basal area): Pinus halepensis (Mediterranean, coniferous          types of forests.
forests), Quercus ilex (broadleaf, evergreen, Mediterra-
nean), Pinus sylvestris (mesic and mountain coniferous                                       RESULTS
forests), Fagus sylvatica (moist, broadleaf, deciduous               The relationships between NDVI anomaly and woody
forests), and Pinus uncinata (high-mountain, coniferous           species richness and between NDVI anomaly and
forests) (Folch 1981, Gracia et al. 2004). As we                  Thorntwaite index were not the same in the different
disregarded those plots located in other types of forests,        types of forests, as shown by the significant interactions
the total number of plots (and pixels) was 2087: 464 P.
                                                                  forest type 3 richness and forest type 3 Thorntwaite
halepensis plots, 565 Q. ilex plots, 749 P. sylvestris plots,
                                                                  (F4,2063 ¼ 3.37, P , 0.005 and F4,2063 ¼ 2.56, P ¼ 0.037,
91 F. sylvatica plots, and 218 P. uncinata plots.
                                                                  respectively). NDVI anomaly was also significantly
   We built a general linear model (GLM), including the
                                                                  influenced by the UTM y coordinate (F4,2063 ¼ 74.42,
NDVI anomaly (difference between August 2003 and
                                                                  P , 0.001). Therefore, we analyzed these relationships
mean values for the same month of the period 1999–
                                                                  for each forest type separately. The effect of plot size
2002) as the dependent variable, and forest type, woody
                                                                  was not significant in the analysis of the model
species richness, and Thorntwaite index as independent
                                                                  considering the five types of forests (F2,2065 ¼ 0.63, P ¼
factors. We included the interactions between these
independent variables in the model. Since some sam-               0.533), nor was it in the analysis of each forest separately
pling points may experience some degree of spatial                (Table 1).
autocorrelation, we included in the model two spatial                NDVI values in P. halepensis forests significantly
terms corresponding to UTM x and y coordinates.                   decreased in the 2003 summer (anomaly mean: À2.14,
Including the x and y coordinates may not compensate              SD ¼ 7.98, Student’s t test of significant differences from
for small scale spatial biases. Given the large number of         zero, t ¼ 5.77, P , 0.001). NDVI loss was lower in P.
sampling points, small scale heterogeneity is unlikely to         halepensis plots with higher woody species richness
bias strongly our main results, but we tested the                 (Table 1, Fig. 2). Although NDVI loss was not
autocorrelation pattern of NDVI anomalies by correlo-             significantly influenced by the Thorntwaite index, a
gram based on Mantel tests and we found that when                 marginally significant interaction between woody species
considering larger distances, NDVI anomaly tends to               richness and Thorntwaite index points to more vulner-
diverge gradually without relevant leveling that could            ability to the 2003 drought episode in moist localities
indicate small scale heterogeneity at range lower than            (within the distribution range of these forests) with less
about 40 km. We also checked GLM analysis including               species (Table 1, Fig. 1). NDVI anomaly was signifi-
higher order spatial coordinate parameters, but they did          cantly influenced by the UTM y coordinate, with less
not improve the model, instead in several cases they              drought impact in northern localities occupied by this
resulted in collinearity problems. Finally, since plot size       type of forest.
September 2007                     DROUGHT RESISTANCE AND PLANT RICHNESS                                                   2275

TABLE 1. Extended.


             Pinus sylvestris                             Fagus sylvatica                            Pinus uncinata
                            Parameter                                   Parameter                                  Parameter
F1, 743      P               estimate          F1,85        P            estimate        F1, 210       P            estimate
 0.17       0.680         À0.015 (0.073)       5.96       0.017      À0.187 (0.114)        0.28      0.595        0.502 (0.943)
11.15      ,0.001          0.119 (0.031)       2.71       0.104      À2.194 (0.899)        0.84      0.361        0.038 (0.042)
 0.17       0.678        À0.0004 (0.0003)      1.38       0.243       0.014 (0.012)        0.06      0.813       À0.002 (0.007)
 9.48       0.002                              6.54       0.012                           46.80     ,0.001
22.15      ,0.001                             14.08      ,0.001                            1.68      0.197
                                                                                           0.35      0.704


   FIG. 2. Contour graphs of the 2003 summer NDVI (normalized difference vegetation index) anomaly (linearly standardized) in
relation to woody species richness and Thorntwaite index (lower values are found under drier conditions) for the five types of
forests. Darker surfaces indicate more negative anomalies, i.e., lower NDVI than in previous years, as shown by anomaly values
drawn over the contour lines. Arrows show the direction of the drought impact, estimated by NDVI decrease in relation to the
species richness and the climatic gradient. Dots indicate the situation of field-sampled plots in the richness–Thorntwaite index
space. The graphs were obtained after fitting a second-order polynomical surface, following the GLM module of the Statistica 5.1.
package (StatSoft, Tulsa, Oklahoma, USA).
2276                                             F. LLORET ET AL.                                Ecology, Vol. 88, No. 9

   In Q. ilex forests, NDVI in August 2003 was               among coniferous forests, NDVI decreased in Mediter-
significantly higher than in previous years (anomaly          ranean (P. halepensis) and mesic (P. sylvestris) forests,
mean ¼ 0.98, SD ¼ 6.61, t ¼ 3.53, P , 0.001). Although       while it did not change significantly in mountain (P.
both richness and the Thorntwaite index were positively      uncinata) pine forests. The lack of drought effect on P.
correlated to this increase (Table 1), a significant          uncinata forests also concurs with the patches of positive
interaction between them indicates that lower NDVI           NDVI anomaly found by Lobo and Maisongrande
values were observed in drier localities with lower          (2005) in high-mountain areas, where water availability
species richness and they also appear to be in moister       was sufficient to compensate for the 2003 drought event.
localities with a higher number of species, although            This general concordance with studies based on land
relatively few plots shared this profile (Table 1, Fig. 2).   cover maps supports our approach based on scaling-
   Pinus sylvestris forests showed a significant decrease     down parameters obtained for large spatial units, in
in NDVI values (mean ¼ À3.80, SD ¼ 7.02, t ¼ 14.81, P        which remote-sensing information is available, to stand
, 0.001). This decrease was not related to woody species     level information taken from field surveys. In fact,
richness, but was lower in moister localities (Table 1,      special care was taken to select representative forest
Fig. 2). The NDVI anomaly was significantly influenced         stands that were located in the middle of forested
by the UTM x and y coordinates, indicating less drought      patches of land. This is relevant because an important
impact in southern and western inland localities.            source of variability in NDVI signal comes from
   NDVI values of Fagus sylvatica forests were not           herbaceous vegetation, which experiences important
significantly lower in August 2003 (mean ¼ À0.44, SD ¼        phenological changes over the course of a summer
8.03, t ¼ À0.52, P ¼ 0.606), and consequently there was      (Lobo and Maisongrande 2005). Furthermore, upscal-
no significant correlation with the Thorntwaite index         ing approaches have been used when field measures of a
(Table 1). However, NDVI values decreased significant-        given variable are unlikely to be obtained for the whole
ly in plots with higher woody species richness (Table 1,     territory (Williams and Rastetter 1999, Hernandez-
Fig. 2). NDVI anomaly was significantly determined by         Stefanoni and Ponce-Hernandez 2004). In our case, the
the UTM x and y coordinates, with less drought impact        assumption that species richness recorded at plot level is
in northern and eastern localities.                          a reliable estimate of woody plant diversity on a larger
   Pinus uncinata forests did not show significantly          scale is supported by correlation to records for larger
different values of NDVI in August 2003 when                 pieces of land (10 3 10 km) obtained from plant
compared to previous years (mean ¼ À0.22, SD ¼ 7.10,         distribution data banks. Also, the observed autocorre-
t ¼ À0.46, P ¼ 0.643) (Table 1), and this pattern            lation in Mantel tests ensures that local heterogeneity
remained present in the plots with higher species            does not result in random patterns on a scale of 1 km.
richness (Fig. 2). NDVI anomaly was significantly             Finally, extensive forestry inventories are the most
influenced by the UTM x coordinate, with less drought         reliable source of information at a regional level on
impact in eastern localities.                                species coexisting in the field. This empirical information
                                                             avoids the problems of other estimates of regional
                       DISCUSSION                            patterns of species richness based on merging individual
   The regional decrease in vegetation green cover           species distribution maps, which do not take into
(NDVI) in southern Europe (Gobron et al. 2005, Lobo          account species interactions or local habitat variability
and Maisongrande 2005) during the 2003 drought               (Terradas et al. 2004). However, our study does not
episode exhibited important differences between forest       consider habitat heterogeneity within 1-km2 pixels. This
types, although water deficit occurred across the whole       may result in a source of error when estimates of species
territory under study. Lobo and Maisongrande (2005),         richness are scaled-up.
after crossing the 2003 remote-sensing anomaly with             The relationship between species richness and drought
CORINE Land Cover 2000 cartography, reported                 resistance showed an important variability between the
higher anomalies in herbaceous than in woody vegeta-         different types of forests. Forest type is a complex
tion, and in deciduous than in evergreen broadleaf           category involving species composition and forest
forests, but no analysis of coniferous forests was           structure resulting from community assembly under
undertaken. Our study excludes herbaceous communi-           different climatic constrictions and human management.
ties but also found more NDVI loss in F. sylvatica           In fact, the five selected forests correspond to categories
forests than in Q. ilex ones. Evergreen canopies are         distributed in a complex gradient from drier, warmer
expected to be more resistant to NDVI changes than           conditions for open P. halepensis and close Q. ilex
deciduous canopies, which should be able to respond          forests to moister conditions for P. sylvestris and F.
faster to changes in water availability by shedding leaves   sylvatica ones, and to cold, mountain conditions for P.
or losing other photosynthetic tissues. Unexpectedly, Q.     uncinata ones. However the climatic gradient, synthe-
ilex forest even showed higher NDVI values in the 2003       sized by the Thorntwaite index, failed in itself to explain
summer than in previous years, perhaps due to the loss       the pattern of NDVI anomaly variation, as reflected by
of old leaves that are more likely to fall under drought     the significant interaction between forest type and the
conditions (Ogaya and Penuelas 2003). As expected,
                             ˜                               climatic index. The Thorntwaite index is a complex
September 2007                   DROUGHT RESISTANCE AND PLANT RICHNESS                                               2277

environmental variable correlated with altitude, temper-      mountain P. uncinata forests where the drought effect
ature, and precipitation that did not account for the         was not significant, species richness was not related to
complete set of factors contributing to forest canopy         NDVI variability.
response to drought. Structural differences among                Therefore, the proportion of drought-tolerant species
forests types also emerge (Gracia et al. 2004), associated    within the community would play an important role in
with different management including selection logging in      explaining NDVI anomaly. In drier P. halepensis forests,
Q. ilex and F. sylvatica forests, shelterwood systems in      higher diversity would involve the recruitment of species
P. sylvestris forests and seed tree systems in P. uncinata    that are drought tolerant. In contrast, in F. sylvatica
forest, while logging is relatively rare in unproductive P.   forests, occurring in moister zones, higher diversity
halepensis forests. Overall, these types of forest can be     would be caused by the recruitment of drought-
considered as distinct systems where the relationship         intolerant species, and the more diverse canopy would
between species diversity and ecosystem function may          lead to higher evapotranspiration rates. Quercus ilex
perform differently.                                          forests, intermediate between dry and somewhat moister
   Within each type of forest, patterns of drought impact     zones, seem to display a more complex response,
in relation to species richness may result from the           somewhere between that of the P. halepensis and F.
interaction with other variables, such as those related to    syvatica forests.
climate. As previously reported in herbaceous commu-             The recovery of forest canopy after the drought
nities (Tilman and Downing 1994), the hypothesis of           episode is not considered in this study, but canopy
species richness enhancing drought resistance was             greenness is expected to have achieved average values
supported in forests growing under Mediterranean              after rainfall, as reported by field observations in
conditions, such as P. halepensis forests. According to       previous drought episodes (Penuelas et al. 2001, Lloret
                                                                                                 ˜
the selection mechanism, the greater the number of            et al. 2004). Since an increase of extreme climate
species, the greater the probability of finding species able   episodes is expected in some regions, further exploration
to cope with drying conditions. In this case, the negative    of the role of diversity in forest resistance in the face of
effect of the drought episode on species performance          frequent droughts may be achieved by increasing the
coincides with the historical selective pressures that have   effort put into long-term monitoring and the surveying
promoted the acquisition of drought tolerance or                                               ´
                                                              of climate forest diebacks (Suarez et al. 2004).
avoidance traits in Mediterranean species (Mooney                Our exploration of the relationship between species
1989, Martı´ nez-Ferri et al. 2000). This hypothesis is       richness and ecosystem resistance may have also been
also supported by the trend of drier localities of P.         influenced by the parameter used to estimate ecosystem
halepensis forests with more species to exhibit lower         drought-resistance. NDVI is a rough estimate of some
NDVI anomalies than moister ones. In the more mesic           global ecosystem properties, such as productivity, that is
Q. ilex forest, a more complex pattern of interaction         affected by multiple factors, including canopy structure
between species richness and climate appears. As in P.        and moisture state. To minimize these limitations, we
halepensis forests, NDVI values were higher in richer         used forest homogeneous pixels, and the NDVI value
forests growing in drier conditions, but the opposite         obtained in the drought period was compared to average
trend was observed in moister localities, where more          values of normal years. Therefore, NDVI loss also
NDVI was observed in forests with low richness. Sala          illustrates the relevant ecological consequences of
and Tenhunen (1994) also found that water deficits             drought on the physiological (i.e., loss of photosynthetic
during dry summers were more severe in valley bottom          activity), structural (i.e., crown partial dieback), func-
localities of Q. ilex forests than in ridge top ones, where   tional (i.e., complete or partial foliage drop and
trees may have developed more conservative strategies         reduction leaf longevity with consequences on nutrient
of water use.                                                 cycling), and demographic (i.e., tree mortality) proper-
   Significant relationships between species richness and      ties of the forest ecosystem, although it reflects poorly
drought resistance tended to disappear in more humid          the details of these responses in the understory
P. sylvestris forests, where NDVI decrease became             vegetation.
significant in drier localities. In these types of forests,       Species homogeneity may be partly responsible for the
historical selective pressures may have not favoured          unexplained effect of richness on drought impact: plots
those species able to face drought, making the whole          with a high number of species may be dominated by just
community more sensitive to drier conditions. Within          a few of them, while a few species on poor plots may be
the moister F. sylvatica forests, the climatic gradient       evenly represented in the canopy, greatly influencing
would not be sufficiently contrasted to produce such a         NDVI. Unfortunately, our forestry inventories did not
pattern. The distribution of these forests is restricted in   provide enough reliable information to calculate this
the moister temperate localities of the region and they       parameter because the estimates of the abundance of
are a refuge for many Euro-Siberian species (Folch            rare species within plots were not accurate enough.
1981). In these cases, species-rich communities made up       Nevertheless, we managed to detect that the number of
of many drought-sensitive species exhibited high nega-        species significantly explained the variability of NDVI
tive NDVI anomalies. Finally, as expected, in high            anomalies, probably because plot richness acts as a
2278                                                  F. LLORET ET AL.                                    Ecology, Vol. 88, No. 9

robust indicator of diversity patterns in this group of             biophysical variables and Landsat ETMþdata. Remote
plants on a larger scale, as supported by correlations              Sensing of Environment 84:561–571.
                                                                           ´                               ´
                                                                  Direccion General de Conservacion de la Naturaleza. 2006.
with the number of woody species recorded at a scale of             Tercer Inventario Forestal Nacional 1997–2006, Barcelona.
10 3 10 km in the BIOCAT data bank (see footnote 6).                Ministerio de Medio Ambiente, Madrid, Spain.
   In spite of the difficulties of scaling up the species                                             ´
                                                                  Folch, R. 1981. La vegetacio dels Paı¨ sos Catalans. Ketres,
diversity patterns, our study provides a novel insight              Barcelona, Spain.
                                                                  Gibelin, A. L., and M. Deque. 2003. Anthropogenic climate
into large-scale empirical patterns in the relationship
                                                                    change over the Mediterranean region simulated by a global
between the species richness and drought-resistance of              variable resolution model. Climate Dynamics 20:327–339.
temperate forests, in the face of increasing episodes of          Gobron, N., B. Pinty, F. Melin, M. Taberner, M. M.
rapid climate change. Thus, our study expands the                   Verstraete, A. Belward, T. Lavergne, and J. L. Widlowski.
information provided by experiments in diversity                    2005. The state of vegetation in Europe after following the
                                                                    2003 drought. International Journal of Remote Sensing 26:
manipulation on herbaceous communities across climat-               2013–2020.
ic gradients that have shown a positive correlation                                                    ` ˜
                                                                  Gracia, C., J. A. Burriel, J. J. Ibanez, T. Mata, and J. Vayreda.
between species diversity and productivity (Hector et al.                                  `
                                                                    2004. Inventari Ecologic i Forestal de Catalunya, Catalunya.
1999).                                                                                             `
                                                                    Centre de Recerca Ecologica i Aplicacions Forestals,
                                                                    Bellaterra, Spain.
   Our study supports the idea that diversity–stability           Hagolle, O., A. Lobo, P. Maisongrande, B. Duchemin, and A.
relationships are not simple, as established by other               De Pereira. 2005. Quality assessment and improvement of
empirical and theoretical studies (Loreau 2000, Pfisterer            SPOT/VEGETATION level temporally composited products
and Schmid 2002). Overall, a shift in this relationship             of remotely sensed imagery by combination of VEGETA-
                                                                    TION 1 and 2 images. Remote Sensing of Environment 94:
seems to appear across the regional aridity gradient.
                                                                    172–286.
Forests from drier localities seem to have a pool of              Hagolle, O., J. M. Nicolas, B. Fougnie, F. Cabot, and B.
species that allow a selection mechanism to operate                 Henry. 2004. Absolute calibration of VEGETATION de-
under extreme drought conditions. This results in an                rived from an interband method based on the sun glint over
improvement in resistance in accordance with species                ocean. IEEE Transactions of Geoscience and Remote
                                                                    Sensing 42:1–20.
richness. However, in moister localities, drought-resis-          Hector, A., et al. 1999. Plant diversity and productivity
tant species are likely to be competitively suppressed by           experiments in European grasslands. Science 286:1123–1127.
drought-sensitive ones, with higher growth rates under            Hernandez-Stefanoni, J. L., and R. Ponce-Hernandez. 2004.
moist climate regimes. In other words, there would be a             Mapping the spatial distribution of plant diversity indices in
                                                                    a tropical forest using multi-spectral satellite image classifi-
higher likelihood of co-occurrence of species sharing               cation and field measurements. Biodiversity and Conserva-
similar moist climatic requirements. Thus, if the                   tion 13–14:2599–2621.
proportion of drought-sensitive species increases with            Holben, B. N. 1986. Characteristics of maximum-values
species richness in moist communities, these forests                composite images from temporal AVHRR data. Internation-
                                                                    al Journal of Remote Sensing 7:1417–1434.
would be more vulnerable to drought events. Finally,              Houghton, J. T., Y. Ding, D. J. Griggs, M. Noguer, P. J. van
when the climatic episode is not intense enough, as in the          der Linden, X. Dai, K. Maskell, and C. A. Johnson, editors.
P. uncinata forests of the Pyrenean Mountains, no                   2001. Climate change 2001: the scientific basis. Contribution
relationship is found. Thus, the study points to the                of Working Group I. Third Assessment Report of the
                                                                    Intergovernmental Panel on Climate Change. Cambridge
necessity of incorporating into the analysis of the
                                                                    University Press, Cambridge, UK.
richness–resistance relationship an axis relating the             Huston, M. A. 1997. Hidden treatments in ecological experi-
causes of disturbance (i.e., in our case, water availabil-          ments: re-evaluating the ecosystem function of biodiversity.
ity) to current environmental gradients and to historical           Oecologia 110:449–460.
environmental constraints on the community.                       Li, S. G., J. Asanuma, A. Kotani, W. Eugster, G. Davaa, D.
                                                                    Oyunbaatar, and M. Sugita. 2005. Year-round measurements
                     ACKNOWLEDGMENTS                                of net ecosystem CO2 flux over a montane larch forest in
                                                                    Mongolia. Journal of Geophysical Research: Atmospheres
   We thank J. Penuelas for the comments to an earlier version
                   ˜                                                110(D9): Article No. D09303.
of the manuscript and J. J. Ibanez for his advice on the
                                   ˜                              Lloret, F., H. Estevan, J. Vayreda, and J. Terradas. 2005. Fire
inventory data. We also are grateful to P. Lambdon and an           regenerative syndromes of forest woody species across fire
anonymous reviewer for their suggestions. The study has been        and climatic gradients. Oecologia 146:461–468.
supported by SI02IR0010 project of the Institut d’Estudis         Lloret, F., D. Siscart, and C. Dalmases. 2004. Canopy recovery
Catalans (IEC), by REN 2003-07198 and CGL2006-01293/BOS             after drought dieback in holm-oak Mediterranean forests of
projects of the Spanish MCYT and by project HIDROLIM, of            Catalonia (NE Spain). Global Change Biology 10:2092–2099.
the Departament d’Universitats, Recerca i Societat de la          Lobo, A., and P. Maisongrande. 2005. Stratified analysis of
           ´                                             ´
Informacio of the Generalitat de Catalunya (Spain) and Region       satellite imagery of SW Europe during summer 2003: the
                ´
des Midi-Pyrinees (France).                                         differential response of vegetation classes to increased water
                                                                    deficit. Hydrology and Earth System Sciences Discussions 2:
                      LITERATURE CITED
                                                                    2025–2060.
Chen, J. M., and J. Cihlar. 1996. Retrieving leaf area index of   Loreau, M. 2000. Biodiversity and ecosystem functioning:
  boreal conifer forests using Landsat TM images. Remote            recent theoretical advances. Oikos 91:3–17.
  Sensing of Environment 55:153–162.                              Lucht, W. I., W. I. C. Prentice, R. B. Myneni, S. Sitch, P.
Cohen, W. B., T. K. Maiersperger, S. T. Gower, and D. P.            Friedlingstein, W. Creamer, P. Bousquet, W. Buermann, and
  Turner. 2003. An improved strategy for regression of              B. Smith. 2002. Climatic control of the high-latitude
September 2007                      DROUGHT RESISTANCE AND PLANT RICHNESS                                                        2279

  vegetation greening trend and Pinatubo effect. Science 296:         ´
                                                                   Suarez, M. L., L. Ghermandi, and T. Kitzberger. 2004. Factors
  1687–1688.                                                         predisposing episodic drought-induced tree mortality in
Martı´ nez-Ferri, E., L. Balaguer, F. Valladares, J. M. Chico,       Nothofagus: site, climatic sensitivity and growth trends.
  and E. Manrique. 2000. Energy dissipation in drought-              Journal of Ecology 92:954–966.
  avoiding and drought-tolerant tree species at midday during      Tarpley, J. P., S. R. Schneider, and R. L. Money. 1984. Global
  the Mediterranean summer. Tree Physiology 20:131–138.              vegetation indices from NOAA-7 meteorological satellite.
McGrady-Steed, J., J. M. Harris, and P. J. Morin. 1997.              Journal of Climate and Applied Meteorology 23:491–494.
  Biodiversity regulates ecosystem predictability. Nature 390:     Terradas, J., R. Salvador, J. Vayreda, and F. Lloret. 2004.
  162–165.                                                           Maximal species richness: an empirical approach for
Mooney, H. A. 1989. Chaparral physiological ecology:                 evaluating woody plant forest biodiversity. Forest Ecology
  paradigms revisited. Pages 85–90 in S. C. Keeley, editor.          and Management 189:241–249.
  The California chaparral. Paradigms re-examined. Natural         Thorntwaite, C. W. 1948. An approach toward a rational
  History Museum of Los Angeles County, Los Angeles,                 classification of climate. Geographical Review 38:55–94.
  California, USA.                                                 Tilman, D., and J. A. Downing. 1994. Biodiversity and stability
Naeem, S., and S. Li. 1997. Biodiversity enhances ecosystems         in grasslands. Nature 367:363–365.
  reliability. Nature 390:507–509.                                 Tilman, D., C. Lehman, and K. Thompson. 1997. Plant
Nemani, R. R., C. D. Keeling, J. Hashimoto, W. M. Jolly, S. C.       diversity and ecosystem productivity: theoretical consider-
  Pipar, C. J. Tucker, R. B. Myneni, and S. W. Running. 2003.        ations. Proceedings of the National Academy of Science
  Climate-driven increases in global terrestrial net primary
                                                                     (USA) 94:1857–1861.
  production from 1982 to 1999. Science 300:1560–1563.
                                                                   Tucker, C. J., and P. J. Sellers. 1986. Satellite remote-sensing of
Ogaya, R., and J. Penuelas. 2003. Phenological patterns of
                         ˜
                                                                     primary production. International Journal of Remote Sens-
  Quercus ilex, Phyllirea latifolia and Arbutus unedo growing
                                                                     ing 7:1395–1416.
  under a field experimental drought. Ecoscience 11:262–270.
Paruelo, J. M., E. G. Jobbagy, and O. E. Sala. 2001. Current       Voss, R., W. May, and E. Roeckner. 2002. Enhanced resolution
  distribution of ecosystem functional types in temperate South      modelling study an anthropogenic climate change: changes in
  America. Ecosystems 4:683–698.                                     extremes of the hydrological cycle. International Journal of
Penuelas, J., F. Lloret, and R. Montoya. 2001. Severe drought
   ˜                                                                 Climatology 22:755–777.
  effects on Mediterranean woody flora in Spain. Forest             Williams, M., and E. B. Rastetter. 1999. Vegetation character-
  Science 47:214–219.                                                istics and primary production along an arctic gradient
Pfisterer, A. B., and B. Schmid. 2002. Diversity-dependent            transect: implications for scaling-up. Journal of Ecology 87:
  production can decrease the stability of ecosystem function-       885–898.
  ing. Nature 416:84–86.                                           Wylie, B. K., D. A. Johnson, E. Laca, N. Z. Saliendra, T. G.
                                                  ´
Pons, X. 2000. Miramon. Sistema d’Informacio Geografica i  `          Gilmanov, B. C. Reed, L. L. Tieszan, and B. B. Worstell.
                           ´
  software de Teledeteccio. CREAF, Bellaterra, Spain.                2003. Calibration of remotely sensed, coarse resolution
Sala, A., and J. D. Tenhunen. 1994. Site-specific water relations     NDVI to CO2 fluxes in a sagebrush–steppe ecosystem.
  and stomatal response of Quercus ilex in a Mediterranean           Remote Sensing of Environment 85:243–255.
  watershed. Tree Physiology 14:601–617.                           Zhou, L., C. J. Tucker, R. K. Kaufmann, D. Slayback, N.
Sanchez, E., C. Gallardo, M. A. Gaertner, A. Arribas, and M.         Shabnov, and R. B. Myneni. 2001. Variations in northern
  Castro. 2004. Future climate extreme events in the Mediter-        vegetation activity inferred from satellite data of vegetation
  ranean simulated by a regional climate model: a first               index during 1981 to 1999. Journal of Geophysical Research
  approach. Global and Planetary Change 44:163–180.                  106(D17):20069–20083.

Mais conteúdo relacionado

Mais procurados

Seminário 5 mc_cauley 2007_dragonfly (2)
Seminário 5 mc_cauley 2007_dragonfly (2)Seminário 5 mc_cauley 2007_dragonfly (2)
Seminário 5 mc_cauley 2007_dragonfly (2)Carlos Alberto Monteiro
 
Seminário 2 capers_et_al-2010_aquatic plant (2)
Seminário 2 capers_et_al-2010_aquatic plant (2)Seminário 2 capers_et_al-2010_aquatic plant (2)
Seminário 2 capers_et_al-2010_aquatic plant (2)Carlos Alberto Monteiro
 
Seminário 3 cottenie_et_al-2003_zooplankton (1)
Seminário 3 cottenie_et_al-2003_zooplankton (1)Seminário 3 cottenie_et_al-2003_zooplankton (1)
Seminário 3 cottenie_et_al-2003_zooplankton (1)Carlos Alberto Monteiro
 
Forestry effects on stream invertebrate communities
Forestry effects on stream invertebrate communitiesForestry effects on stream invertebrate communities
Forestry effects on stream invertebrate communitiesRodolfo Santos
 
PhD Thesis by Iago Otero 25 March 2010
PhD Thesis by Iago Otero 25 March 2010PhD Thesis by Iago Otero 25 March 2010
PhD Thesis by Iago Otero 25 March 2010iagootero
 
D.B Lindenmayer Future Directions For Biodiversity
D.B Lindenmayer   Future Directions For BiodiversityD.B Lindenmayer   Future Directions For Biodiversity
D.B Lindenmayer Future Directions For BiodiversityMyris Silva
 
Garssen et al 2014 Effects of climate-induced increases in summer drought
Garssen et al 2014 Effects of climate-induced increases in summer droughtGarssen et al 2014 Effects of climate-induced increases in summer drought
Garssen et al 2014 Effects of climate-induced increases in summer droughtAnnemarie Garssen
 
Wildfire.final.report
Wildfire.final.reportWildfire.final.report
Wildfire.final.reportDon Threewitt
 
53; calotes thermoregulation m.s.
53; calotes thermoregulation m.s.53; calotes thermoregulation m.s.
53; calotes thermoregulation m.s.Roger Meek
 
Sidder_et_al-2016-Ecosphere
Sidder_et_al-2016-EcosphereSidder_et_al-2016-Ecosphere
Sidder_et_al-2016-EcosphereAaron Sidder
 
Thesis-Final_Rachel-Strawn
Thesis-Final_Rachel-StrawnThesis-Final_Rachel-Strawn
Thesis-Final_Rachel-StrawnRachel Newbold
 
Impact of past and future climate change on diversity in tropical rainforests
Impact of past and future climate change on diversity in tropical rainforestsImpact of past and future climate change on diversity in tropical rainforests
Impact of past and future climate change on diversity in tropical rainforestsUniversity of Adelaide
 
Photosynthetic rates of Camassia quamash under different burn regimes
Photosynthetic rates of Camassia quamash under different burn regimesPhotosynthetic rates of Camassia quamash under different burn regimes
Photosynthetic rates of Camassia quamash under different burn regimesClaire Cook
 
Jon Schurman PhD defense-PPFT
Jon Schurman PhD defense-PPFTJon Schurman PhD defense-PPFT
Jon Schurman PhD defense-PPFTJonathan Schurman
 
DE presentation to IISD on May 7, 2008. Title: Amazon Resilience and Busines...
DE presentation to IISD on May 7, 2008.  Title: Amazon Resilience and Busines...DE presentation to IISD on May 7, 2008.  Title: Amazon Resilience and Busines...
DE presentation to IISD on May 7, 2008. Title: Amazon Resilience and Busines...DE Design and Environment
 

Mais procurados (20)

UBC BLISS talk 2016
UBC BLISS talk 2016UBC BLISS talk 2016
UBC BLISS talk 2016
 
Seminário 5 mc_cauley 2007_dragonfly (2)
Seminário 5 mc_cauley 2007_dragonfly (2)Seminário 5 mc_cauley 2007_dragonfly (2)
Seminário 5 mc_cauley 2007_dragonfly (2)
 
Seminário 2 capers_et_al-2010_aquatic plant (2)
Seminário 2 capers_et_al-2010_aquatic plant (2)Seminário 2 capers_et_al-2010_aquatic plant (2)
Seminário 2 capers_et_al-2010_aquatic plant (2)
 
Seminário 3 cottenie_et_al-2003_zooplankton (1)
Seminário 3 cottenie_et_al-2003_zooplankton (1)Seminário 3 cottenie_et_al-2003_zooplankton (1)
Seminário 3 cottenie_et_al-2003_zooplankton (1)
 
Forestry effects on stream invertebrate communities
Forestry effects on stream invertebrate communitiesForestry effects on stream invertebrate communities
Forestry effects on stream invertebrate communities
 
PhD Thesis by Iago Otero 25 March 2010
PhD Thesis by Iago Otero 25 March 2010PhD Thesis by Iago Otero 25 March 2010
PhD Thesis by Iago Otero 25 March 2010
 
Weis 2
Weis 2Weis 2
Weis 2
 
D.B Lindenmayer Future Directions For Biodiversity
D.B Lindenmayer   Future Directions For BiodiversityD.B Lindenmayer   Future Directions For Biodiversity
D.B Lindenmayer Future Directions For Biodiversity
 
Garssen et al 2014 Effects of climate-induced increases in summer drought
Garssen et al 2014 Effects of climate-induced increases in summer droughtGarssen et al 2014 Effects of climate-induced increases in summer drought
Garssen et al 2014 Effects of climate-induced increases in summer drought
 
Wildfire.final.report
Wildfire.final.reportWildfire.final.report
Wildfire.final.report
 
53; calotes thermoregulation m.s.
53; calotes thermoregulation m.s.53; calotes thermoregulation m.s.
53; calotes thermoregulation m.s.
 
Sidder_et_al-2016-Ecosphere
Sidder_et_al-2016-EcosphereSidder_et_al-2016-Ecosphere
Sidder_et_al-2016-Ecosphere
 
Thesis-Final_Rachel-Strawn
Thesis-Final_Rachel-StrawnThesis-Final_Rachel-Strawn
Thesis-Final_Rachel-Strawn
 
Bartomeus bes sfe_lille
Bartomeus bes sfe_lilleBartomeus bes sfe_lille
Bartomeus bes sfe_lille
 
Esa2013
Esa2013Esa2013
Esa2013
 
Impact of past and future climate change on diversity in tropical rainforests
Impact of past and future climate change on diversity in tropical rainforestsImpact of past and future climate change on diversity in tropical rainforests
Impact of past and future climate change on diversity in tropical rainforests
 
Photosynthetic rates of Camassia quamash under different burn regimes
Photosynthetic rates of Camassia quamash under different burn regimesPhotosynthetic rates of Camassia quamash under different burn regimes
Photosynthetic rates of Camassia quamash under different burn regimes
 
SPANOS Ioannis-CV
SPANOS Ioannis-CVSPANOS Ioannis-CV
SPANOS Ioannis-CV
 
Jon Schurman PhD defense-PPFT
Jon Schurman PhD defense-PPFTJon Schurman PhD defense-PPFT
Jon Schurman PhD defense-PPFT
 
DE presentation to IISD on May 7, 2008. Title: Amazon Resilience and Busines...
DE presentation to IISD on May 7, 2008.  Title: Amazon Resilience and Busines...DE presentation to IISD on May 7, 2008.  Title: Amazon Resilience and Busines...
DE presentation to IISD on May 7, 2008. Title: Amazon Resilience and Busines...
 

Semelhante a WOODY PLANT RICHNESS AND NDVI RESPONSE TO DROUGHT EVENTS IN CATALONIAN (NORTHEASTERN SPAIN) FORESTS - Francisco Lloret

patterns and determinants of floristic variation across lowland forests of bo...
patterns and determinants of floristic variation across lowland forests of bo...patterns and determinants of floristic variation across lowland forests of bo...
patterns and determinants of floristic variation across lowland forests of bo...Valderes Sarnaglia
 
MAMMALS, EDGE EFFECTS, AND THE LOSS OF TROPICAL FOREST DIVERSITY Asquith & Me...
MAMMALS, EDGE EFFECTS, AND THE LOSS OF TROPICAL FOREST DIVERSITY Asquith & Me...MAMMALS, EDGE EFFECTS, AND THE LOSS OF TROPICAL FOREST DIVERSITY Asquith & Me...
MAMMALS, EDGE EFFECTS, AND THE LOSS OF TROPICAL FOREST DIVERSITY Asquith & Me...Fundación Natura Bolivia
 
Beckel - Leaf physiology response across a disturbance gradient in a temperat...
Beckel - Leaf physiology response across a disturbance gradient in a temperat...Beckel - Leaf physiology response across a disturbance gradient in a temperat...
Beckel - Leaf physiology response across a disturbance gradient in a temperat...Rick Beckel
 
Texto 1 gaston 2000 pattern biodiversity
Texto 1 gaston 2000 pattern biodiversityTexto 1 gaston 2000 pattern biodiversity
Texto 1 gaston 2000 pattern biodiversityCarlos Alberto Monteiro
 
why are the tropics so diverseplease expaint this queation in det.pdf
why are the tropics so diverseplease expaint this queation in det.pdfwhy are the tropics so diverseplease expaint this queation in det.pdf
why are the tropics so diverseplease expaint this queation in det.pdfarihantmobilepoint15
 
Vegetation dynamics in the western himalayas, diversity indices and climate c...
Vegetation dynamics in the western himalayas, diversity indices and climate c...Vegetation dynamics in the western himalayas, diversity indices and climate c...
Vegetation dynamics in the western himalayas, diversity indices and climate c...Shujaul Mulk Khan
 
Tree regeneration, Fenner School July 2009
Tree regeneration, Fenner School July 2009Tree regeneration, Fenner School July 2009
Tree regeneration, Fenner School July 2009joernfischer
 
Reforestation in the Cerro Candelaria Reserve
Reforestation in the Cerro Candelaria ReserveReforestation in the Cerro Candelaria Reserve
Reforestation in the Cerro Candelaria ReserveChristopher Chang
 
Climate change and forest diseases
Climate change and forest diseasesClimate change and forest diseases
Climate change and forest diseasesJoão Soares
 
Relationship Between Sampling Area, Sampling Size Vs...
Relationship Between Sampling Area, Sampling Size Vs...Relationship Between Sampling Area, Sampling Size Vs...
Relationship Between Sampling Area, Sampling Size Vs...Jessica Deakin
 
Regional and global elevational patterns of microbial species richness and ev...
Regional and global elevational patterns of microbial species richness and ev...Regional and global elevational patterns of microbial species richness and ev...
Regional and global elevational patterns of microbial species richness and ev...sediman
 
Biogeography Critique #1
Biogeography Critique #1Biogeography Critique #1
Biogeography Critique #1Matthew Highnam
 
Bucci et al 2005 mechanisms contributing to seasonal homeostasis of minimum l...
Bucci et al 2005 mechanisms contributing to seasonal homeostasis of minimum l...Bucci et al 2005 mechanisms contributing to seasonal homeostasis of minimum l...
Bucci et al 2005 mechanisms contributing to seasonal homeostasis of minimum l...Deliane Penha
 
The amazon basin_in_transition
The amazon basin_in_transitionThe amazon basin_in_transition
The amazon basin_in_transitionSérgio Sacani
 
Longleaf Pine Final Paper
Longleaf Pine Final PaperLongleaf Pine Final Paper
Longleaf Pine Final PaperKevin Willson
 
Swift etal 2008 SAJB
Swift etal 2008 SAJBSwift etal 2008 SAJB
Swift etal 2008 SAJBMari Brand
 
ECOLOGY, BEHAVIOR AND BIONOMICSEucalyptus Edge Effect on Q
ECOLOGY, BEHAVIOR AND BIONOMICSEucalyptus Edge Effect on QECOLOGY, BEHAVIOR AND BIONOMICSEucalyptus Edge Effect on Q
ECOLOGY, BEHAVIOR AND BIONOMICSEucalyptus Edge Effect on QEvonCanales257
 
MeganArcher_EVS_FinalReport
MeganArcher_EVS_FinalReportMeganArcher_EVS_FinalReport
MeganArcher_EVS_FinalReportMegan Archer
 

Semelhante a WOODY PLANT RICHNESS AND NDVI RESPONSE TO DROUGHT EVENTS IN CATALONIAN (NORTHEASTERN SPAIN) FORESTS - Francisco Lloret (20)

patterns and determinants of floristic variation across lowland forests of bo...
patterns and determinants of floristic variation across lowland forests of bo...patterns and determinants of floristic variation across lowland forests of bo...
patterns and determinants of floristic variation across lowland forests of bo...
 
Syndromes
SyndromesSyndromes
Syndromes
 
MAMMALS, EDGE EFFECTS, AND THE LOSS OF TROPICAL FOREST DIVERSITY Asquith & Me...
MAMMALS, EDGE EFFECTS, AND THE LOSS OF TROPICAL FOREST DIVERSITY Asquith & Me...MAMMALS, EDGE EFFECTS, AND THE LOSS OF TROPICAL FOREST DIVERSITY Asquith & Me...
MAMMALS, EDGE EFFECTS, AND THE LOSS OF TROPICAL FOREST DIVERSITY Asquith & Me...
 
Beckel - Leaf physiology response across a disturbance gradient in a temperat...
Beckel - Leaf physiology response across a disturbance gradient in a temperat...Beckel - Leaf physiology response across a disturbance gradient in a temperat...
Beckel - Leaf physiology response across a disturbance gradient in a temperat...
 
Texto 1 gaston 2000 pattern biodiversity
Texto 1 gaston 2000 pattern biodiversityTexto 1 gaston 2000 pattern biodiversity
Texto 1 gaston 2000 pattern biodiversity
 
why are the tropics so diverseplease expaint this queation in det.pdf
why are the tropics so diverseplease expaint this queation in det.pdfwhy are the tropics so diverseplease expaint this queation in det.pdf
why are the tropics so diverseplease expaint this queation in det.pdf
 
Vegetation dynamics in the western himalayas, diversity indices and climate c...
Vegetation dynamics in the western himalayas, diversity indices and climate c...Vegetation dynamics in the western himalayas, diversity indices and climate c...
Vegetation dynamics in the western himalayas, diversity indices and climate c...
 
Tree regeneration, Fenner School July 2009
Tree regeneration, Fenner School July 2009Tree regeneration, Fenner School July 2009
Tree regeneration, Fenner School July 2009
 
Voltas_et_al-2015-New_Phytologist
Voltas_et_al-2015-New_PhytologistVoltas_et_al-2015-New_Phytologist
Voltas_et_al-2015-New_Phytologist
 
Reforestation in the Cerro Candelaria Reserve
Reforestation in the Cerro Candelaria ReserveReforestation in the Cerro Candelaria Reserve
Reforestation in the Cerro Candelaria Reserve
 
Climate change and forest diseases
Climate change and forest diseasesClimate change and forest diseases
Climate change and forest diseases
 
Relationship Between Sampling Area, Sampling Size Vs...
Relationship Between Sampling Area, Sampling Size Vs...Relationship Between Sampling Area, Sampling Size Vs...
Relationship Between Sampling Area, Sampling Size Vs...
 
Regional and global elevational patterns of microbial species richness and ev...
Regional and global elevational patterns of microbial species richness and ev...Regional and global elevational patterns of microbial species richness and ev...
Regional and global elevational patterns of microbial species richness and ev...
 
Biogeography Critique #1
Biogeography Critique #1Biogeography Critique #1
Biogeography Critique #1
 
Bucci et al 2005 mechanisms contributing to seasonal homeostasis of minimum l...
Bucci et al 2005 mechanisms contributing to seasonal homeostasis of minimum l...Bucci et al 2005 mechanisms contributing to seasonal homeostasis of minimum l...
Bucci et al 2005 mechanisms contributing to seasonal homeostasis of minimum l...
 
The amazon basin_in_transition
The amazon basin_in_transitionThe amazon basin_in_transition
The amazon basin_in_transition
 
Longleaf Pine Final Paper
Longleaf Pine Final PaperLongleaf Pine Final Paper
Longleaf Pine Final Paper
 
Swift etal 2008 SAJB
Swift etal 2008 SAJBSwift etal 2008 SAJB
Swift etal 2008 SAJB
 
ECOLOGY, BEHAVIOR AND BIONOMICSEucalyptus Edge Effect on Q
ECOLOGY, BEHAVIOR AND BIONOMICSEucalyptus Edge Effect on QECOLOGY, BEHAVIOR AND BIONOMICSEucalyptus Edge Effect on Q
ECOLOGY, BEHAVIOR AND BIONOMICSEucalyptus Edge Effect on Q
 
MeganArcher_EVS_FinalReport
MeganArcher_EVS_FinalReportMeganArcher_EVS_FinalReport
MeganArcher_EVS_FinalReport
 

Mais de Hibrids

Estratégias de Intervención: Arte y ecología, Arte Urbano, Arte Social
Estratégias de Intervención: Arte y ecología, Arte Urbano, Arte SocialEstratégias de Intervención: Arte y ecología, Arte Urbano, Arte Social
Estratégias de Intervención: Arte y ecología, Arte Urbano, Arte SocialHibrids
 
noubarisnou - Sessio participativa oberta
noubarisnou - Sessio participativa obertanoubarisnou - Sessio participativa oberta
noubarisnou - Sessio participativa obertaHibrids
 
Workshop POST-OIL CITIES: Girona
Workshop POST-OIL CITIES: GironaWorkshop POST-OIL CITIES: Girona
Workshop POST-OIL CITIES: GironaHibrids
 
Phenology Feedbacks on CLimate Change - Iolanda Filella
Phenology Feedbacks on CLimate Change - Iolanda FilellaPhenology Feedbacks on CLimate Change - Iolanda Filella
Phenology Feedbacks on CLimate Change - Iolanda FilellaHibrids
 
Constatacions biològiques del canvi climàtic a Catalunya - Iolanda Filella
Constatacions biològiques   del canvi climàtic a Catalunya - Iolanda FilellaConstatacions biològiques   del canvi climàtic a Catalunya - Iolanda Filella
Constatacions biològiques del canvi climàtic a Catalunya - Iolanda FilellaHibrids
 
EL CANVI CLIMÀTIC ALTERA I ALTERARÀ LA VIDA ALS ECOSISTEMES TERRESTRES CATA...
EL CANVI CLIMÀTIC ALTERA I  ALTERARÀ LA VIDA ALS ECOSISTEMES  TERRESTRES CATA...EL CANVI CLIMÀTIC ALTERA I  ALTERARÀ LA VIDA ALS ECOSISTEMES  TERRESTRES CATA...
EL CANVI CLIMÀTIC ALTERA I ALTERARÀ LA VIDA ALS ECOSISTEMES TERRESTRES CATA...Hibrids
 
European phenological response to climate change matches the warming pattern...
European phenological response to climate change  matches the warming pattern...European phenological response to climate change  matches the warming pattern...
European phenological response to climate change matches the warming pattern...Hibrids
 
Landscape dynamics of Abies and Fagus in the southern Pyrenees during the la...
Landscape dynamics of Abies and Fagus in the southern Pyrenees during the  la...Landscape dynamics of Abies and Fagus in the southern Pyrenees during the  la...
Landscape dynamics of Abies and Fagus in the southern Pyrenees during the la...Hibrids
 
Changes in Pyrenean woodlands as a result of the intensity of human exploita...
Changes in Pyrenean woodlands as a result of the intensity  of human exploita...Changes in Pyrenean woodlands as a result of the intensity  of human exploita...
Changes in Pyrenean woodlands as a result of the intensity of human exploita...Hibrids
 
Vulnerabilidades y adaptación al cambio climático - Jaume Terradas
Vulnerabilidades y adaptación al cambio climático - Jaume TerradasVulnerabilidades y adaptación al cambio climático - Jaume Terradas
Vulnerabilidades y adaptación al cambio climático - Jaume TerradasHibrids
 
El límite superior del bosque
El límite superior del bosqueEl límite superior del bosque
El límite superior del bosqueHibrids
 
Effects of a severe drought on Quercus ilex radial growth and xylem anatomy
Effects of a severe drought on Quercus ilex radial growth  and xylem anatomyEffects of a severe drought on Quercus ilex radial growth  and xylem anatomy
Effects of a severe drought on Quercus ilex radial growth and xylem anatomyHibrids
 
INCREASING ARIDITY IS ENHANCING SILVER FIR (ABIES ALBA MILL.) WATER STRESS I...
INCREASING ARIDITY IS ENHANCING SILVER FIR  (ABIES ALBA MILL.) WATER STRESS I...INCREASING ARIDITY IS ENHANCING SILVER FIR  (ABIES ALBA MILL.) WATER STRESS I...
INCREASING ARIDITY IS ENHANCING SILVER FIR (ABIES ALBA MILL.) WATER STRESS I...Hibrids
 
El decaimiento del abeto en los Pirineos
El decaimiento del abeto en los PirineosEl decaimiento del abeto en los Pirineos
El decaimiento del abeto en los PirineosHibrids
 
SPATIOTEMPORAL VARIABILITY IN TREE GROWTH IN THE CENTRAL PYRENEES: CLIMATIC ...
SPATIOTEMPORAL VARIABILITY IN TREE GROWTH IN THE CENTRAL  PYRENEES: CLIMATIC ...SPATIOTEMPORAL VARIABILITY IN TREE GROWTH IN THE CENTRAL  PYRENEES: CLIMATIC ...
SPATIOTEMPORAL VARIABILITY IN TREE GROWTH IN THE CENTRAL PYRENEES: CLIMATIC ...Hibrids
 
Dendropedagogical Approach
Dendropedagogical ApproachDendropedagogical Approach
Dendropedagogical ApproachHibrids
 
Cambio Global y Decaimiento Del Bosque - Jesús Camarero
Cambio Global y Decaimiento Del Bosque - Jesús CamareroCambio Global y Decaimiento Del Bosque - Jesús Camarero
Cambio Global y Decaimiento Del Bosque - Jesús CamareroHibrids
 
Climate Change Treeline
Climate Change TreelineClimate Change Treeline
Climate Change TreelineHibrids
 

Mais de Hibrids (18)

Estratégias de Intervención: Arte y ecología, Arte Urbano, Arte Social
Estratégias de Intervención: Arte y ecología, Arte Urbano, Arte SocialEstratégias de Intervención: Arte y ecología, Arte Urbano, Arte Social
Estratégias de Intervención: Arte y ecología, Arte Urbano, Arte Social
 
noubarisnou - Sessio participativa oberta
noubarisnou - Sessio participativa obertanoubarisnou - Sessio participativa oberta
noubarisnou - Sessio participativa oberta
 
Workshop POST-OIL CITIES: Girona
Workshop POST-OIL CITIES: GironaWorkshop POST-OIL CITIES: Girona
Workshop POST-OIL CITIES: Girona
 
Phenology Feedbacks on CLimate Change - Iolanda Filella
Phenology Feedbacks on CLimate Change - Iolanda FilellaPhenology Feedbacks on CLimate Change - Iolanda Filella
Phenology Feedbacks on CLimate Change - Iolanda Filella
 
Constatacions biològiques del canvi climàtic a Catalunya - Iolanda Filella
Constatacions biològiques   del canvi climàtic a Catalunya - Iolanda FilellaConstatacions biològiques   del canvi climàtic a Catalunya - Iolanda Filella
Constatacions biològiques del canvi climàtic a Catalunya - Iolanda Filella
 
EL CANVI CLIMÀTIC ALTERA I ALTERARÀ LA VIDA ALS ECOSISTEMES TERRESTRES CATA...
EL CANVI CLIMÀTIC ALTERA I  ALTERARÀ LA VIDA ALS ECOSISTEMES  TERRESTRES CATA...EL CANVI CLIMÀTIC ALTERA I  ALTERARÀ LA VIDA ALS ECOSISTEMES  TERRESTRES CATA...
EL CANVI CLIMÀTIC ALTERA I ALTERARÀ LA VIDA ALS ECOSISTEMES TERRESTRES CATA...
 
European phenological response to climate change matches the warming pattern...
European phenological response to climate change  matches the warming pattern...European phenological response to climate change  matches the warming pattern...
European phenological response to climate change matches the warming pattern...
 
Landscape dynamics of Abies and Fagus in the southern Pyrenees during the la...
Landscape dynamics of Abies and Fagus in the southern Pyrenees during the  la...Landscape dynamics of Abies and Fagus in the southern Pyrenees during the  la...
Landscape dynamics of Abies and Fagus in the southern Pyrenees during the la...
 
Changes in Pyrenean woodlands as a result of the intensity of human exploita...
Changes in Pyrenean woodlands as a result of the intensity  of human exploita...Changes in Pyrenean woodlands as a result of the intensity  of human exploita...
Changes in Pyrenean woodlands as a result of the intensity of human exploita...
 
Vulnerabilidades y adaptación al cambio climático - Jaume Terradas
Vulnerabilidades y adaptación al cambio climático - Jaume TerradasVulnerabilidades y adaptación al cambio climático - Jaume Terradas
Vulnerabilidades y adaptación al cambio climático - Jaume Terradas
 
El límite superior del bosque
El límite superior del bosqueEl límite superior del bosque
El límite superior del bosque
 
Effects of a severe drought on Quercus ilex radial growth and xylem anatomy
Effects of a severe drought on Quercus ilex radial growth  and xylem anatomyEffects of a severe drought on Quercus ilex radial growth  and xylem anatomy
Effects of a severe drought on Quercus ilex radial growth and xylem anatomy
 
INCREASING ARIDITY IS ENHANCING SILVER FIR (ABIES ALBA MILL.) WATER STRESS I...
INCREASING ARIDITY IS ENHANCING SILVER FIR  (ABIES ALBA MILL.) WATER STRESS I...INCREASING ARIDITY IS ENHANCING SILVER FIR  (ABIES ALBA MILL.) WATER STRESS I...
INCREASING ARIDITY IS ENHANCING SILVER FIR (ABIES ALBA MILL.) WATER STRESS I...
 
El decaimiento del abeto en los Pirineos
El decaimiento del abeto en los PirineosEl decaimiento del abeto en los Pirineos
El decaimiento del abeto en los Pirineos
 
SPATIOTEMPORAL VARIABILITY IN TREE GROWTH IN THE CENTRAL PYRENEES: CLIMATIC ...
SPATIOTEMPORAL VARIABILITY IN TREE GROWTH IN THE CENTRAL  PYRENEES: CLIMATIC ...SPATIOTEMPORAL VARIABILITY IN TREE GROWTH IN THE CENTRAL  PYRENEES: CLIMATIC ...
SPATIOTEMPORAL VARIABILITY IN TREE GROWTH IN THE CENTRAL PYRENEES: CLIMATIC ...
 
Dendropedagogical Approach
Dendropedagogical ApproachDendropedagogical Approach
Dendropedagogical Approach
 
Cambio Global y Decaimiento Del Bosque - Jesús Camarero
Cambio Global y Decaimiento Del Bosque - Jesús CamareroCambio Global y Decaimiento Del Bosque - Jesús Camarero
Cambio Global y Decaimiento Del Bosque - Jesús Camarero
 
Climate Change Treeline
Climate Change TreelineClimate Change Treeline
Climate Change Treeline
 

Último

Proudly South Africa powerpoint Thorisha.pptx
Proudly South Africa powerpoint Thorisha.pptxProudly South Africa powerpoint Thorisha.pptx
Proudly South Africa powerpoint Thorisha.pptxthorishapillay1
 
Global Lehigh Strategic Initiatives (without descriptions)
Global Lehigh Strategic Initiatives (without descriptions)Global Lehigh Strategic Initiatives (without descriptions)
Global Lehigh Strategic Initiatives (without descriptions)cama23
 
ANG SEKTOR NG agrikultura.pptx QUARTER 4
ANG SEKTOR NG agrikultura.pptx QUARTER 4ANG SEKTOR NG agrikultura.pptx QUARTER 4
ANG SEKTOR NG agrikultura.pptx QUARTER 4MiaBumagat1
 
Keynote by Prof. Wurzer at Nordex about IP-design
Keynote by Prof. Wurzer at Nordex about IP-designKeynote by Prof. Wurzer at Nordex about IP-design
Keynote by Prof. Wurzer at Nordex about IP-designMIPLM
 
4.18.24 Movement Legacies, Reflection, and Review.pptx
4.18.24 Movement Legacies, Reflection, and Review.pptx4.18.24 Movement Legacies, Reflection, and Review.pptx
4.18.24 Movement Legacies, Reflection, and Review.pptxmary850239
 
ACC 2024 Chronicles. Cardiology. Exam.pdf
ACC 2024 Chronicles. Cardiology. Exam.pdfACC 2024 Chronicles. Cardiology. Exam.pdf
ACC 2024 Chronicles. Cardiology. Exam.pdfSpandanaRallapalli
 
AUDIENCE THEORY -CULTIVATION THEORY - GERBNER.pptx
AUDIENCE THEORY -CULTIVATION THEORY -  GERBNER.pptxAUDIENCE THEORY -CULTIVATION THEORY -  GERBNER.pptx
AUDIENCE THEORY -CULTIVATION THEORY - GERBNER.pptxiammrhaywood
 
Karra SKD Conference Presentation Revised.pptx
Karra SKD Conference Presentation Revised.pptxKarra SKD Conference Presentation Revised.pptx
Karra SKD Conference Presentation Revised.pptxAshokKarra1
 
Student Profile Sample - We help schools to connect the data they have, with ...
Student Profile Sample - We help schools to connect the data they have, with ...Student Profile Sample - We help schools to connect the data they have, with ...
Student Profile Sample - We help schools to connect the data they have, with ...Seán Kennedy
 
What is Model Inheritance in Odoo 17 ERP
What is Model Inheritance in Odoo 17 ERPWhat is Model Inheritance in Odoo 17 ERP
What is Model Inheritance in Odoo 17 ERPCeline George
 
INTRODUCTION TO CATHOLIC CHRISTOLOGY.pptx
INTRODUCTION TO CATHOLIC CHRISTOLOGY.pptxINTRODUCTION TO CATHOLIC CHRISTOLOGY.pptx
INTRODUCTION TO CATHOLIC CHRISTOLOGY.pptxHumphrey A Beña
 
ENGLISH 7_Q4_LESSON 2_ Employing a Variety of Strategies for Effective Interp...
ENGLISH 7_Q4_LESSON 2_ Employing a Variety of Strategies for Effective Interp...ENGLISH 7_Q4_LESSON 2_ Employing a Variety of Strategies for Effective Interp...
ENGLISH 7_Q4_LESSON 2_ Employing a Variety of Strategies for Effective Interp...JhezDiaz1
 
Concurrency Control in Database Management system
Concurrency Control in Database Management systemConcurrency Control in Database Management system
Concurrency Control in Database Management systemChristalin Nelson
 
Judging the Relevance and worth of ideas part 2.pptx
Judging the Relevance  and worth of ideas part 2.pptxJudging the Relevance  and worth of ideas part 2.pptx
Judging the Relevance and worth of ideas part 2.pptxSherlyMaeNeri
 
MULTIDISCIPLINRY NATURE OF THE ENVIRONMENTAL STUDIES.pptx
MULTIDISCIPLINRY NATURE OF THE ENVIRONMENTAL STUDIES.pptxMULTIDISCIPLINRY NATURE OF THE ENVIRONMENTAL STUDIES.pptx
MULTIDISCIPLINRY NATURE OF THE ENVIRONMENTAL STUDIES.pptxAnupkumar Sharma
 
HỌC TỐT TIẾNG ANH 11 THEO CHƯƠNG TRÌNH GLOBAL SUCCESS ĐÁP ÁN CHI TIẾT - CẢ NĂ...
HỌC TỐT TIẾNG ANH 11 THEO CHƯƠNG TRÌNH GLOBAL SUCCESS ĐÁP ÁN CHI TIẾT - CẢ NĂ...HỌC TỐT TIẾNG ANH 11 THEO CHƯƠNG TRÌNH GLOBAL SUCCESS ĐÁP ÁN CHI TIẾT - CẢ NĂ...
HỌC TỐT TIẾNG ANH 11 THEO CHƯƠNG TRÌNH GLOBAL SUCCESS ĐÁP ÁN CHI TIẾT - CẢ NĂ...Nguyen Thanh Tu Collection
 
Incoming and Outgoing Shipments in 3 STEPS Using Odoo 17
Incoming and Outgoing Shipments in 3 STEPS Using Odoo 17Incoming and Outgoing Shipments in 3 STEPS Using Odoo 17
Incoming and Outgoing Shipments in 3 STEPS Using Odoo 17Celine George
 
4.16.24 21st Century Movements for Black Lives.pptx
4.16.24 21st Century Movements for Black Lives.pptx4.16.24 21st Century Movements for Black Lives.pptx
4.16.24 21st Century Movements for Black Lives.pptxmary850239
 
AMERICAN LANGUAGE HUB_Level2_Student'sBook_Answerkey.pdf
AMERICAN LANGUAGE HUB_Level2_Student'sBook_Answerkey.pdfAMERICAN LANGUAGE HUB_Level2_Student'sBook_Answerkey.pdf
AMERICAN LANGUAGE HUB_Level2_Student'sBook_Answerkey.pdfphamnguyenenglishnb
 
Influencing policy (training slides from Fast Track Impact)
Influencing policy (training slides from Fast Track Impact)Influencing policy (training slides from Fast Track Impact)
Influencing policy (training slides from Fast Track Impact)Mark Reed
 

Último (20)

Proudly South Africa powerpoint Thorisha.pptx
Proudly South Africa powerpoint Thorisha.pptxProudly South Africa powerpoint Thorisha.pptx
Proudly South Africa powerpoint Thorisha.pptx
 
Global Lehigh Strategic Initiatives (without descriptions)
Global Lehigh Strategic Initiatives (without descriptions)Global Lehigh Strategic Initiatives (without descriptions)
Global Lehigh Strategic Initiatives (without descriptions)
 
ANG SEKTOR NG agrikultura.pptx QUARTER 4
ANG SEKTOR NG agrikultura.pptx QUARTER 4ANG SEKTOR NG agrikultura.pptx QUARTER 4
ANG SEKTOR NG agrikultura.pptx QUARTER 4
 
Keynote by Prof. Wurzer at Nordex about IP-design
Keynote by Prof. Wurzer at Nordex about IP-designKeynote by Prof. Wurzer at Nordex about IP-design
Keynote by Prof. Wurzer at Nordex about IP-design
 
4.18.24 Movement Legacies, Reflection, and Review.pptx
4.18.24 Movement Legacies, Reflection, and Review.pptx4.18.24 Movement Legacies, Reflection, and Review.pptx
4.18.24 Movement Legacies, Reflection, and Review.pptx
 
ACC 2024 Chronicles. Cardiology. Exam.pdf
ACC 2024 Chronicles. Cardiology. Exam.pdfACC 2024 Chronicles. Cardiology. Exam.pdf
ACC 2024 Chronicles. Cardiology. Exam.pdf
 
AUDIENCE THEORY -CULTIVATION THEORY - GERBNER.pptx
AUDIENCE THEORY -CULTIVATION THEORY -  GERBNER.pptxAUDIENCE THEORY -CULTIVATION THEORY -  GERBNER.pptx
AUDIENCE THEORY -CULTIVATION THEORY - GERBNER.pptx
 
Karra SKD Conference Presentation Revised.pptx
Karra SKD Conference Presentation Revised.pptxKarra SKD Conference Presentation Revised.pptx
Karra SKD Conference Presentation Revised.pptx
 
Student Profile Sample - We help schools to connect the data they have, with ...
Student Profile Sample - We help schools to connect the data they have, with ...Student Profile Sample - We help schools to connect the data they have, with ...
Student Profile Sample - We help schools to connect the data they have, with ...
 
What is Model Inheritance in Odoo 17 ERP
What is Model Inheritance in Odoo 17 ERPWhat is Model Inheritance in Odoo 17 ERP
What is Model Inheritance in Odoo 17 ERP
 
INTRODUCTION TO CATHOLIC CHRISTOLOGY.pptx
INTRODUCTION TO CATHOLIC CHRISTOLOGY.pptxINTRODUCTION TO CATHOLIC CHRISTOLOGY.pptx
INTRODUCTION TO CATHOLIC CHRISTOLOGY.pptx
 
ENGLISH 7_Q4_LESSON 2_ Employing a Variety of Strategies for Effective Interp...
ENGLISH 7_Q4_LESSON 2_ Employing a Variety of Strategies for Effective Interp...ENGLISH 7_Q4_LESSON 2_ Employing a Variety of Strategies for Effective Interp...
ENGLISH 7_Q4_LESSON 2_ Employing a Variety of Strategies for Effective Interp...
 
Concurrency Control in Database Management system
Concurrency Control in Database Management systemConcurrency Control in Database Management system
Concurrency Control in Database Management system
 
Judging the Relevance and worth of ideas part 2.pptx
Judging the Relevance  and worth of ideas part 2.pptxJudging the Relevance  and worth of ideas part 2.pptx
Judging the Relevance and worth of ideas part 2.pptx
 
MULTIDISCIPLINRY NATURE OF THE ENVIRONMENTAL STUDIES.pptx
MULTIDISCIPLINRY NATURE OF THE ENVIRONMENTAL STUDIES.pptxMULTIDISCIPLINRY NATURE OF THE ENVIRONMENTAL STUDIES.pptx
MULTIDISCIPLINRY NATURE OF THE ENVIRONMENTAL STUDIES.pptx
 
HỌC TỐT TIẾNG ANH 11 THEO CHƯƠNG TRÌNH GLOBAL SUCCESS ĐÁP ÁN CHI TIẾT - CẢ NĂ...
HỌC TỐT TIẾNG ANH 11 THEO CHƯƠNG TRÌNH GLOBAL SUCCESS ĐÁP ÁN CHI TIẾT - CẢ NĂ...HỌC TỐT TIẾNG ANH 11 THEO CHƯƠNG TRÌNH GLOBAL SUCCESS ĐÁP ÁN CHI TIẾT - CẢ NĂ...
HỌC TỐT TIẾNG ANH 11 THEO CHƯƠNG TRÌNH GLOBAL SUCCESS ĐÁP ÁN CHI TIẾT - CẢ NĂ...
 
Incoming and Outgoing Shipments in 3 STEPS Using Odoo 17
Incoming and Outgoing Shipments in 3 STEPS Using Odoo 17Incoming and Outgoing Shipments in 3 STEPS Using Odoo 17
Incoming and Outgoing Shipments in 3 STEPS Using Odoo 17
 
4.16.24 21st Century Movements for Black Lives.pptx
4.16.24 21st Century Movements for Black Lives.pptx4.16.24 21st Century Movements for Black Lives.pptx
4.16.24 21st Century Movements for Black Lives.pptx
 
AMERICAN LANGUAGE HUB_Level2_Student'sBook_Answerkey.pdf
AMERICAN LANGUAGE HUB_Level2_Student'sBook_Answerkey.pdfAMERICAN LANGUAGE HUB_Level2_Student'sBook_Answerkey.pdf
AMERICAN LANGUAGE HUB_Level2_Student'sBook_Answerkey.pdf
 
Influencing policy (training slides from Fast Track Impact)
Influencing policy (training slides from Fast Track Impact)Influencing policy (training slides from Fast Track Impact)
Influencing policy (training slides from Fast Track Impact)
 

WOODY PLANT RICHNESS AND NDVI RESPONSE TO DROUGHT EVENTS IN CATALONIAN (NORTHEASTERN SPAIN) FORESTS - Francisco Lloret

  • 1. Ecology, 88(9), 2007, pp. 2270–2279 Ó 2007 by the Ecological Society of America WOODY PLANT RICHNESS AND NDVI RESPONSE TO DROUGHT EVENTS IN CATALONIAN (NORTHEASTERN SPAIN) FORESTS F. LLORET,1,5 A. LOBO,2 H. ESTEVAN,3 P. MAISONGRANDE,4 J. VAYREDA,3 AND J. TERRADAS1 1 CREAF (Center for Ecological Research and Forestry Applications) - Departament de Biologia Animal, Biologia Vegetal i Ecologia, Universitat Auto `noma de Barcelona, 08193 Bellaterra, Barcelona, Spain 2 Institut de Cie`ncies de la Terra ‘‘Jaume Almera’’ (CSIC), Lluis Sole´ Sabarı´s s/n, 08028 Barcelona, Spain 3 CREAF (Center for Ecological Research and Forestry Applications), Universitat Auto `noma de Barcelona, 08193 Bellaterra, Barcelona, Spain 4 ´ Centre d’Etudes Spatiales de la Biosphe`re (CESBIO), bpi 2801, 18, avenue Edouard Belin, 31401 Toulouse Cedex 9, France Abstract. The role of species diversity on ecosystem resistance in the face of strong environmental fluctuations has been addressed from both theoretical and experimental viewpoints to reveal a variety of positive and negative relationships. Here we explore empirically the relationship between the richness of forest woody species and canopy resistance to extreme drought episodes. We compare richness data from an extensive forest inventory to a temporal series of satellite imagery that estimated drought impact on forest canopy as NDVI (normalized difference vegetation index) anomalies of the dry summer in 2003 in relation to records of previous years. We considered five different types of forests that are representative of the main climatic and altitudinal gradients of the region, ranging from lowland Mediterranean to mountain boreal-temperate climates. The observed relationship differed among forest types and interacted with the climate, summarised by the Thorntwaite index. In Mediterranean Pinus halepensis forests, NDVI decreased during the drought. This decrease was stronger in forests with lower richness. In Mediterranean evergreen forests of Quercus ilex, drought did not result in an overall NDVI loss, but lower NDVI values were observed in drier localities with lower richness, and in more moist localities with higher number of species. In mountain Pinus sylvestris forests NDVI decreased, mostly due to the drought impact on drier localities, while no relation to species richness was observed. In moist Fagus sylvatica forests, NDVI only decreased in plots with high richness. No effect of drought was observed in the high mountain Pinus uncinata forests. Our results show that a shift on the diversity–stability relationship appears across the regional, climatic gradient. A positive relationship appears in drier localities, supporting a null model where the probability of finding a species able to cope with drier conditions increases with the number of species. However, in more moist localities we hypothesize that the proportion of drought-sensitive species would increase in richer localities, due to a higher likelihood of co-occurrence of species that share moist climatic requirements. The study points to the convenience of considering the causes of disturbance in relation to current environmental gradients and historical environmental constraints on the community. Key words: climate change; ecosystem resistance; forest dieback; Mediterranean forests; NDVI; species diversity. INTRODUCTION between diversity and the resistance of the ecosystem The role of species diversity in the functioning of (Tilman and Downing 1994, McGrady-Steed et al. 1997, ecosystems has become one of the most challenging Naem and Li 1997). However, Loreau (2000) used a topics in recent ecological research. Evidence of great model approach to conclude that resistance may decrease human-induced transformations ranging from the local or increase with increasing diversity. A selection mech- to the global scale has highlighted the importance of this anism (Huston 1997) (equivalent to the sampling effect question. One particular issue concerns the role of species described by Tilman et al. 1997), by which ‘‘diversity diversity on ecosystems’ ability to face strong environ- increases the range of trait variation and a selective mental fluctuations, such as extreme climate events, process promotes dominance by species with extreme which in some cases can be considered as disturbances. trait values’’ (Loreau 2000), would explain these different Experimental results point to a positive relationship relationships. A positive relationship would be found if the disturbance has a negative effect on most species and diversity enhances the probability of finding the species Manuscript received 13 July 2006; revised 7 February 2007; best adapted to afford the new conditions (Loreau 2000). accepted 12 February 2007. Corresponding Editor: T. J. Stohlgren. This response would be enhanced by historically- 5 E-mail: francisco.lloret@uab.es fluctuating selective pressures that remain promoting 2270
  • 2. September 2007 DROUGHT RESISTANCE AND PLANT RICHNESS 2271 the occurrence of traits fitting the new conditions. In addition, extensive forest inventories provide Alternatively, a greater number of species may imply reliable information about the forest composition of greater changes in ecosystem properties under the new woody species across large territories, and both types of disturbance conditions when competitive pressures information may be integrated into geographical infor- under non-disturbance conditions tended to eliminate mation systems (GIS). disturbance-tolerant species from the community. During the summer of 2003 an intense drought Climate models and current empirical trends point to an episode occurred in southwestern Europe, which was increase of climatic variability in some regions, resulting in well documented by remote sensing imagery (Gobron et a greater number and intensity of extreme events (Voss et al. 2005, Lobo and Maisongrande 2005). In the present al. 2002). In the particular case of the Mediterranean study, we analyze the relationship between woody Basin, where water availability is the major environmental species richness obtained from extensive forest invento- constraint to plant growth, and where episodes of drought ries in Catalonia (northeastern Spain) and drought resulting in forest dieback have been recorded in the last impact on the canopy of forests, estimated as NDVI decades (Penuelas et al. 2001, Lloret et al. 2004), current ˜ anomalies of the year 2003 in relation to median NDVI models predict warmer and drier conditions (Houghon et records of previous years. We assume that the canopy al. 2001, Gibelin and Deque 2003), with increased NDVI values in the dense forests under study were seasonal and inter-annual variability resulting in more mostly determined by woody species. We consider five common and intense drought events (Houghton et al. different types of forests, defined by their dominant tree 2001, Sanchez et al. 2004). species, which are representative of the main climatic As experimental manipulation of climate and richness and altitudinal gradients of the region. Our main in forest ecosystems is unlikely to be performed, direct hypothesis is that species richness correlates positively with canopy resistance to drought, this pattern being observations of the effect of extreme climate events are more evident in those communities where drought currently the most reliable approach for investigating intensity was higher, and where drought-driven selection the relationship between forest species richness and the has been historically prevalent. effects of extreme drought on forest properties. In addition, extensive sampling is recommended to inves- METHODS tigate regional patterns, on a similar scale to that at Study area which drought occurs. The scaling-up of the level of observation requires integrative variables related to Catalonia (0815 E, 40830 0 N to 3815 0 E, 42840 0 N, 0 ecosystem functioning, although accurate details of ;31 900 km2) is located in the northeast of the Iberian functioning at stand level may be missed. Remote Peninsula, including the Pyrenean range to the north sensing imagery has been revealed as a useful tool to and bounded to the east by the Mediterranean Sea. describe structural patterns of vegetation determining Most of the area falls under different degrees of primary productivity in relation to between-year climat- Mediterranean climate, with a main climatic-topograph- ic variability at local and regional scales (Tucker and ic gradient from a temperate-boreal climate (mean Sellers 1986, Paruelo et al. 2001). NDVI (normalized annual precipitation of up to 1500 mm) in the Pyrenees, difference vegetation index) is a normalized contrast to a Mediterranean climate of mild winters and dry between near infrared and red reflectance, thus empha- summers (mean annual precipitation from 530 mm) in sizing the presence of green vegetation in the area the southern extreme. There is also a continental, corresponding to the pixel. Since NDVI integrates both semiarid gradient inland towards the west, with colder the abundance of green vegetation and its greenness, it winters, very hot summers, and low rainfall (mean has a certain consubstantial ambiguity. Also, as NDVI annual precipitation around 400 mm). Vegetation types is a two-dimensional approximation to a three-dimen- across the climatic-topographic gradients include scle- rophyllous, evergreen shrublands and forests, deciduous sional reality in which leaves tend to be arranged in forests, and coniferous forests (Folch 1981), all with a different layers, the relationship between NDVI and long history of human management. PAR tends to saturate in the case of highly multilayered canopies. Notwithstanding, if time series are available Climatic data and remote sensing estimation for post-processing and certain observations (i.e., of forest drought extreme angles) are disregarded, NDVI is a linear ` From the Atlas Climatic Digital de Catalunya, we estimate of the fraction of photosynthetically active obtained for each plot locality the Thorntwaite index as radiation (PAR) that is intercepted by the photosynthe- a standard index that effectively describes the aridity– sizing tissue of vegetation present in the pixel. Because moisture climatic gradient, from the Mediterranean of the aforementioned multilayering, NDVI correlations coast to the mountains inland (Lloret et al. 2005; atlas between NDVI and LAI (leaf area index; i.e., Chen and available online). 6 The Thorntwaite index was Cihlar 1996, Cohen et al. 2003) are more variable, with a calculated as follows: less close fit and quicker saturation than in the case of APAR. NDVI has also been found to correlate to ecosystem CO2 flux (Wylie et al. 2003, Li et al. 2005). 6 hhttp://magno.uab.es/atles-climatic/i
  • 3. 2272 F. LLORET ET AL. Ecology, Vol. 88, No. 9 Thorntwaite index ¼ ðP À ETP Þ 3 100=ETP average annual series of monthly mean NDVI images for the period 1999–2002, which we used as the where P is annual precipitation (mm), and ETP is annual ‘‘normal’’ reference, and an annual series of monthly potential evapotranspiration (mm), which is the sum of mean NDVI images for 2003. We calculated the monthly evapotranspiration values calculated following difference between the respective 2003 and 1999–2002 the Thorntwaite formula (Thorntwaite 1948). This mean NDVI values, and we finally estimated NDVI calculation considers for each plot locality the mean anomalies as the difference between the respective 2003 monthly average values of temperature, that were and 1999–2002 mean NDVI values (Fig. 1). Considering ` obtained from the Atlas Climatic Digital de Catalunya, that the period of drought concluded by the end of and a coefficient estimated by the numbers of days in a August in southwestern Europe, we use in this study the month and the daily hours of sun as a function of anomaly of NDVI in August 2003 as an estimate of the latitude. impact of the drought in the canopy. Also, this month is The difference between precipitation and evapotrans- at the peak of the dry season, when a large part of the piration can be considered as an estimation of the herbaceous vegetation has probably burned off, causing balance between atmospheric water supply and demand the minimal interference to the NDVI scores. (Lobo and Maisongrande 2005). During the drought episode of the summer of 2003, in most of our region of Species richness data study, the difference between total precipitation and evapotranspiration showed a negative anomaly of more Richness data are based on circular field plots than 100 mm (Lobo and Maisongrande 2005). This established in the Third National Forest Inventory of information was obtained by comparing climate and ´ Spain (IFN3; Direccion General de Conservacion de la´ meteorological data of June, July, and August 2003 to Naturaleza 2006). Sampling was conducted from 2000 to data of the same months for the period 1961–2000, 2001 at a density of 1 plot/km2, following a regular provided as grids of 5 3 5 km resolution by the Spanish design within the forested surface of the whole territory Instituto Nacional de Metereologia (INM) (Lobo and (Fig. 1). Each plot was located in the field by a global Maisongrande 2005). positioning system (GPS), allowing for cross-references The vegetation response to water deficit was assessed with climatic databases (see footnote 6). from the normalized difference vegetation index (NDVI; The IFN3 survey includes exhaustive information on Tarpley et al. 1984) included in the S10 products that are the composition of canopy and understory woody derived from images acquired by the VEGETATION species, as well as on production and structure. We instrument onboard satellite SPOT. VEGETATION is restricted our analysis to this group as no consistent an optical multi-spectral instrument that acquires a daily information is available for non-woody species. Shrub and almost complete cover of the Earth’s surface at 1- and regenerative trees (defined as those with a normal km2 resolution in four spectral bands (Hagolle et al. diameter, measured 50 cm above the ground surface, 2004). S10 products are calibrated, atmospherically and below 75 mm) were sampled within circular plots with a geometrically corrected images. radius of 10 and 5 m, respectively). Extensive stands of The VEGETATION S10 collection is produced from regenerative trees after clearing are not common in the temporal compositing of calibrated, atmospherically region and are not included in the study. Plot size for and geometrically corrected images, by the combination sampling the rest of the trees varied in order to sample of daily images in periods of 10 days. The aim is to enough individuals belonging to the largest size classes create a synthetic reconstruction from cloud-free images present in the plot. In order to minimize species richness that is assumed to be representative of each 10-day bias due to plot size, we compared the richness shown by period. The maximum value composite (MVC; Holben plots of different size in each forest type. In the cases 1986) procedure is used for compositing in VEGETA- where differences arose (Fagus sylvatica and Pinus TION S10 products. MVC selects, for each pixel, the sylvestris forests), we only selected the most common maximum NDVI value among 10 daily images. Al- size (15 m radius), which was considered to be the most though alternative compositing methods have been representative for that type of forest. When there were developed (Hagolle et al. 2005), MVC is the only no significant differences in species richness between method currently implemented in the processing chain plots of different size (Quercus ilex, Pinus halepensis, and of the S10 collection. Time series of NDVI composites Pinus uncinata forests), we pooled these plots in the produced by this method have been used successfully to analysis. This process reduced the original 9126 IFN3 monitor surface dynamics at global and regional scales plots for Catalonia to 7567, most of them with a radius (Zhou et al. 2001, Lucht et al. 2002, Nemani et al. 2003). of 15 m. Finally, since large variation in richness among We used a data set of S10 products of the region of plots may produce no significant differences between study from 1999 to 2003, with a resolution of 3200 plot size classes, we minimized the effect of plot size on (seconds). NDVI values in S10 products are linearly the relationship between NDVI anomaly and species scaled from the observed jÀ0.1, 0.9j range to the integer richness by including it as an explicative variable in the range j0, 250j, and we kept this scale. We computed an statistical analysis, as detailed below.
  • 4. September 2007 DROUGHT RESISTANCE AND PLANT RICHNESS 2273 FIG. 1. Map of the studied region (Catalonia, Spain) showing the pattern of the woody species richness obtained from field plots (left) and the 2003 summer NDVI (normalized difference vegetation index) anomaly (right). The darker the gray, the greater is the species richness and drought impact, respectively. Negative values of the NDVI anomaly correspond to lower values of NDVI in August 2003 than in the reference August. Values of NDVI are linearly scaled to the range j0, 250j. Data analysis from plots should show some degree of autocorrelation In order to ensure a reliable correspondence between in short distances (1 km). Alternatively, a random IFN3 information and pixel information, we applied an spatial distribution of richness values from sites 1 km additional filter to avoid plots located in heterogeneous apart would indicate that the richness estimated in small areas, so that reflectance from the forest canopy does sampling units is not representative of spatial patterns not dominate the corresponding pixel values. Thus, we on a larger scale. This assumption was supported by a defined a 1-km2 grid coincident with the pixels of the spatial autocorrelation analysis of the selected plots, imagery and selected those cells including inventory which indicated that the pattern of species richness does plots and satisfying two criteria: (1) land cover category not change across the neighbouring areas (Mantel test in having dense forest in more than 50% of the cell, and (2) which the main factors were the absolute differences tree canopy cover being more than 50% in the respective between species richness for each pair of inventory plots inventory plots. This second filter reduced the number of and the geographical Euclidean distance between them, r plots (and pixels) to 3504. After applying the filters, we ¼ 0.125, P , 0.001; for distances up to 15 km, r ¼ 0.075, crossed the selected inventory data and the NDVI values P , 0.001; for distances up to 60 km, r ¼ 0.036, P , obtained in the respective 1-km2 pixel surrounding the 0.001). plot location, following the nearest neighbor procedure We also tested this assumption by comparing plot of the Miramon GIS (Pons 2000). Since 1-km2 NDVI richness values to records of species richness on larger anomalies are obtained from averaged continuous forest spatial scales obtained from the BIOCAT data bank canopies, we assumed that they can be applied to smaller (available online).7 BIOCAT provides the list of plant pieces of forest, such as those sampled at the plot scale. species recorded by botanists at 10 3 10 km UTM grids We also assumed that the number of woody species at covering the whole Catalonia territory. We selected 33 10 plot level is a reliable estimate of woody species richness 3 10 km grids where forest cover was largely dominant in the surrounding forest areas. More specifically, we (more than 75% of the territory) and included at least 10 assumed that the spatial pattern of richness in small plots, from which we calculated the mean species sampling units 1 km apart follows the same pattern as adjacent 1-km2 units. If this assumption is true, richness 7 http://biodiver.bio.ub.es/biocat/homepage.htmli
  • 5. 2274 F. LLORET ET AL. Ecology, Vol. 88, No. 9 TABLE 1. GLM results for the different forest types considering NDVI anomaly (August 2003) as the dependent variable and woody species richness, Thorntwaite index, UTM x and y coordinates, and plot size as explicative variables. Pinus halepensis Quercus ilex Parameter Parameter Parameter F1, 457 P estimate F1, 556 P estimate Richness (R) 7.02 0.008 0.238 (0.009) 10.33 ,0.001 0.402 (0.105) Thorntwaite index (T ) 1.82 0.178 À0.118 (0.009) 14.61 ,0.001 0.115 (0.036) R3T 3.16 0.076 0.076 (0.011) 6.74 0.010 À0.007 (0.003) Coordinate x 0.08 0.776 0.79 0.374 Coordinate y 58.97 ,0.001 1.76 0.185 Plot size 0.01 0.909 0.27 0.603 Notes: Values in parentheses are SE. richness. We obtained a significant positive correlation (r may determine richness values and consequently may ¼ 0.765, F1,32 ¼ 43.74, P , 0.0001, slope ¼ 4.39) between indirectly influence the relationship between NDVI woody species richness at the plot scale and at the 10 3 10 anomaly and species richness we also included plot size km scale, supporting our assumption that richness values in the model as an additional explicative variable. obtained at plot level may be correlated to NDVI 1-km2 We also built similar GLMs for each type of forest, estimates at intermediate scales. including woody species richness, Thorntwaite index, We selected five types of forests that were represen- UTM x and y coordinates and plot size as explicative tative of the climatic conditions of the area of study. variables. Since all the plots in F. sylvatica and P. These forest types were defined by its respective sylvestris were of the same size (15 m radius), this dominant species (accounting for .50% of the plot variable was not included in the analysis of these two basal area): Pinus halepensis (Mediterranean, coniferous types of forests. forests), Quercus ilex (broadleaf, evergreen, Mediterra- nean), Pinus sylvestris (mesic and mountain coniferous RESULTS forests), Fagus sylvatica (moist, broadleaf, deciduous The relationships between NDVI anomaly and woody forests), and Pinus uncinata (high-mountain, coniferous species richness and between NDVI anomaly and forests) (Folch 1981, Gracia et al. 2004). As we Thorntwaite index were not the same in the different disregarded those plots located in other types of forests, types of forests, as shown by the significant interactions the total number of plots (and pixels) was 2087: 464 P. forest type 3 richness and forest type 3 Thorntwaite halepensis plots, 565 Q. ilex plots, 749 P. sylvestris plots, (F4,2063 ¼ 3.37, P , 0.005 and F4,2063 ¼ 2.56, P ¼ 0.037, 91 F. sylvatica plots, and 218 P. uncinata plots. respectively). NDVI anomaly was also significantly We built a general linear model (GLM), including the influenced by the UTM y coordinate (F4,2063 ¼ 74.42, NDVI anomaly (difference between August 2003 and P , 0.001). Therefore, we analyzed these relationships mean values for the same month of the period 1999– for each forest type separately. The effect of plot size 2002) as the dependent variable, and forest type, woody was not significant in the analysis of the model species richness, and Thorntwaite index as independent considering the five types of forests (F2,2065 ¼ 0.63, P ¼ factors. We included the interactions between these independent variables in the model. Since some sam- 0.533), nor was it in the analysis of each forest separately pling points may experience some degree of spatial (Table 1). autocorrelation, we included in the model two spatial NDVI values in P. halepensis forests significantly terms corresponding to UTM x and y coordinates. decreased in the 2003 summer (anomaly mean: À2.14, Including the x and y coordinates may not compensate SD ¼ 7.98, Student’s t test of significant differences from for small scale spatial biases. Given the large number of zero, t ¼ 5.77, P , 0.001). NDVI loss was lower in P. sampling points, small scale heterogeneity is unlikely to halepensis plots with higher woody species richness bias strongly our main results, but we tested the (Table 1, Fig. 2). Although NDVI loss was not autocorrelation pattern of NDVI anomalies by correlo- significantly influenced by the Thorntwaite index, a gram based on Mantel tests and we found that when marginally significant interaction between woody species considering larger distances, NDVI anomaly tends to richness and Thorntwaite index points to more vulner- diverge gradually without relevant leveling that could ability to the 2003 drought episode in moist localities indicate small scale heterogeneity at range lower than (within the distribution range of these forests) with less about 40 km. We also checked GLM analysis including species (Table 1, Fig. 1). NDVI anomaly was signifi- higher order spatial coordinate parameters, but they did cantly influenced by the UTM y coordinate, with less not improve the model, instead in several cases they drought impact in northern localities occupied by this resulted in collinearity problems. Finally, since plot size type of forest.
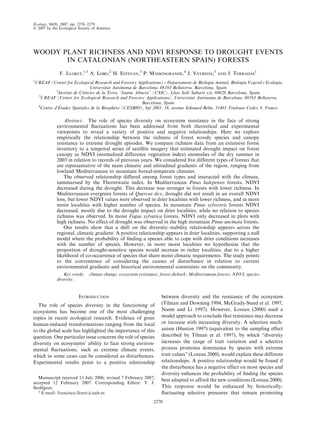
  • 6. September 2007 DROUGHT RESISTANCE AND PLANT RICHNESS 2275 TABLE 1. Extended. Pinus sylvestris Fagus sylvatica Pinus uncinata Parameter Parameter Parameter F1, 743 P estimate F1,85 P estimate F1, 210 P estimate 0.17 0.680 À0.015 (0.073) 5.96 0.017 À0.187 (0.114) 0.28 0.595 0.502 (0.943) 11.15 ,0.001 0.119 (0.031) 2.71 0.104 À2.194 (0.899) 0.84 0.361 0.038 (0.042) 0.17 0.678 À0.0004 (0.0003) 1.38 0.243 0.014 (0.012) 0.06 0.813 À0.002 (0.007) 9.48 0.002 6.54 0.012 46.80 ,0.001 22.15 ,0.001 14.08 ,0.001 1.68 0.197 0.35 0.704 FIG. 2. Contour graphs of the 2003 summer NDVI (normalized difference vegetation index) anomaly (linearly standardized) in relation to woody species richness and Thorntwaite index (lower values are found under drier conditions) for the five types of forests. Darker surfaces indicate more negative anomalies, i.e., lower NDVI than in previous years, as shown by anomaly values drawn over the contour lines. Arrows show the direction of the drought impact, estimated by NDVI decrease in relation to the species richness and the climatic gradient. Dots indicate the situation of field-sampled plots in the richness–Thorntwaite index space. The graphs were obtained after fitting a second-order polynomical surface, following the GLM module of the Statistica 5.1. package (StatSoft, Tulsa, Oklahoma, USA).
  • 7. 2276 F. LLORET ET AL. Ecology, Vol. 88, No. 9 In Q. ilex forests, NDVI in August 2003 was among coniferous forests, NDVI decreased in Mediter- significantly higher than in previous years (anomaly ranean (P. halepensis) and mesic (P. sylvestris) forests, mean ¼ 0.98, SD ¼ 6.61, t ¼ 3.53, P , 0.001). Although while it did not change significantly in mountain (P. both richness and the Thorntwaite index were positively uncinata) pine forests. The lack of drought effect on P. correlated to this increase (Table 1), a significant uncinata forests also concurs with the patches of positive interaction between them indicates that lower NDVI NDVI anomaly found by Lobo and Maisongrande values were observed in drier localities with lower (2005) in high-mountain areas, where water availability species richness and they also appear to be in moister was sufficient to compensate for the 2003 drought event. localities with a higher number of species, although This general concordance with studies based on land relatively few plots shared this profile (Table 1, Fig. 2). cover maps supports our approach based on scaling- Pinus sylvestris forests showed a significant decrease down parameters obtained for large spatial units, in in NDVI values (mean ¼ À3.80, SD ¼ 7.02, t ¼ 14.81, P which remote-sensing information is available, to stand , 0.001). This decrease was not related to woody species level information taken from field surveys. In fact, richness, but was lower in moister localities (Table 1, special care was taken to select representative forest Fig. 2). The NDVI anomaly was significantly influenced stands that were located in the middle of forested by the UTM x and y coordinates, indicating less drought patches of land. This is relevant because an important impact in southern and western inland localities. source of variability in NDVI signal comes from NDVI values of Fagus sylvatica forests were not herbaceous vegetation, which experiences important significantly lower in August 2003 (mean ¼ À0.44, SD ¼ phenological changes over the course of a summer 8.03, t ¼ À0.52, P ¼ 0.606), and consequently there was (Lobo and Maisongrande 2005). Furthermore, upscal- no significant correlation with the Thorntwaite index ing approaches have been used when field measures of a (Table 1). However, NDVI values decreased significant- given variable are unlikely to be obtained for the whole ly in plots with higher woody species richness (Table 1, territory (Williams and Rastetter 1999, Hernandez- Fig. 2). NDVI anomaly was significantly determined by Stefanoni and Ponce-Hernandez 2004). In our case, the the UTM x and y coordinates, with less drought impact assumption that species richness recorded at plot level is in northern and eastern localities. a reliable estimate of woody plant diversity on a larger Pinus uncinata forests did not show significantly scale is supported by correlation to records for larger different values of NDVI in August 2003 when pieces of land (10 3 10 km) obtained from plant compared to previous years (mean ¼ À0.22, SD ¼ 7.10, distribution data banks. Also, the observed autocorre- t ¼ À0.46, P ¼ 0.643) (Table 1), and this pattern lation in Mantel tests ensures that local heterogeneity remained present in the plots with higher species does not result in random patterns on a scale of 1 km. richness (Fig. 2). NDVI anomaly was significantly Finally, extensive forestry inventories are the most influenced by the UTM x coordinate, with less drought reliable source of information at a regional level on impact in eastern localities. species coexisting in the field. This empirical information avoids the problems of other estimates of regional DISCUSSION patterns of species richness based on merging individual The regional decrease in vegetation green cover species distribution maps, which do not take into (NDVI) in southern Europe (Gobron et al. 2005, Lobo account species interactions or local habitat variability and Maisongrande 2005) during the 2003 drought (Terradas et al. 2004). However, our study does not episode exhibited important differences between forest consider habitat heterogeneity within 1-km2 pixels. This types, although water deficit occurred across the whole may result in a source of error when estimates of species territory under study. Lobo and Maisongrande (2005), richness are scaled-up. after crossing the 2003 remote-sensing anomaly with The relationship between species richness and drought CORINE Land Cover 2000 cartography, reported resistance showed an important variability between the higher anomalies in herbaceous than in woody vegeta- different types of forests. Forest type is a complex tion, and in deciduous than in evergreen broadleaf category involving species composition and forest forests, but no analysis of coniferous forests was structure resulting from community assembly under undertaken. Our study excludes herbaceous communi- different climatic constrictions and human management. ties but also found more NDVI loss in F. sylvatica In fact, the five selected forests correspond to categories forests than in Q. ilex ones. Evergreen canopies are distributed in a complex gradient from drier, warmer expected to be more resistant to NDVI changes than conditions for open P. halepensis and close Q. ilex deciduous canopies, which should be able to respond forests to moister conditions for P. sylvestris and F. faster to changes in water availability by shedding leaves sylvatica ones, and to cold, mountain conditions for P. or losing other photosynthetic tissues. Unexpectedly, Q. uncinata ones. However the climatic gradient, synthe- ilex forest even showed higher NDVI values in the 2003 sized by the Thorntwaite index, failed in itself to explain summer than in previous years, perhaps due to the loss the pattern of NDVI anomaly variation, as reflected by of old leaves that are more likely to fall under drought the significant interaction between forest type and the conditions (Ogaya and Penuelas 2003). As expected, ˜ climatic index. The Thorntwaite index is a complex
  • 8. September 2007 DROUGHT RESISTANCE AND PLANT RICHNESS 2277 environmental variable correlated with altitude, temper- mountain P. uncinata forests where the drought effect ature, and precipitation that did not account for the was not significant, species richness was not related to complete set of factors contributing to forest canopy NDVI variability. response to drought. Structural differences among Therefore, the proportion of drought-tolerant species forests types also emerge (Gracia et al. 2004), associated within the community would play an important role in with different management including selection logging in explaining NDVI anomaly. In drier P. halepensis forests, Q. ilex and F. sylvatica forests, shelterwood systems in higher diversity would involve the recruitment of species P. sylvestris forests and seed tree systems in P. uncinata that are drought tolerant. In contrast, in F. sylvatica forest, while logging is relatively rare in unproductive P. forests, occurring in moister zones, higher diversity halepensis forests. Overall, these types of forest can be would be caused by the recruitment of drought- considered as distinct systems where the relationship intolerant species, and the more diverse canopy would between species diversity and ecosystem function may lead to higher evapotranspiration rates. Quercus ilex perform differently. forests, intermediate between dry and somewhat moister Within each type of forest, patterns of drought impact zones, seem to display a more complex response, in relation to species richness may result from the somewhere between that of the P. halepensis and F. interaction with other variables, such as those related to syvatica forests. climate. As previously reported in herbaceous commu- The recovery of forest canopy after the drought nities (Tilman and Downing 1994), the hypothesis of episode is not considered in this study, but canopy species richness enhancing drought resistance was greenness is expected to have achieved average values supported in forests growing under Mediterranean after rainfall, as reported by field observations in conditions, such as P. halepensis forests. According to previous drought episodes (Penuelas et al. 2001, Lloret ˜ the selection mechanism, the greater the number of et al. 2004). Since an increase of extreme climate species, the greater the probability of finding species able episodes is expected in some regions, further exploration to cope with drying conditions. In this case, the negative of the role of diversity in forest resistance in the face of effect of the drought episode on species performance frequent droughts may be achieved by increasing the coincides with the historical selective pressures that have effort put into long-term monitoring and the surveying promoted the acquisition of drought tolerance or ´ of climate forest diebacks (Suarez et al. 2004). avoidance traits in Mediterranean species (Mooney Our exploration of the relationship between species 1989, Martı´ nez-Ferri et al. 2000). This hypothesis is richness and ecosystem resistance may have also been also supported by the trend of drier localities of P. influenced by the parameter used to estimate ecosystem halepensis forests with more species to exhibit lower drought-resistance. NDVI is a rough estimate of some NDVI anomalies than moister ones. In the more mesic global ecosystem properties, such as productivity, that is Q. ilex forest, a more complex pattern of interaction affected by multiple factors, including canopy structure between species richness and climate appears. As in P. and moisture state. To minimize these limitations, we halepensis forests, NDVI values were higher in richer used forest homogeneous pixels, and the NDVI value forests growing in drier conditions, but the opposite obtained in the drought period was compared to average trend was observed in moister localities, where more values of normal years. Therefore, NDVI loss also NDVI was observed in forests with low richness. Sala illustrates the relevant ecological consequences of and Tenhunen (1994) also found that water deficits drought on the physiological (i.e., loss of photosynthetic during dry summers were more severe in valley bottom activity), structural (i.e., crown partial dieback), func- localities of Q. ilex forests than in ridge top ones, where tional (i.e., complete or partial foliage drop and trees may have developed more conservative strategies reduction leaf longevity with consequences on nutrient of water use. cycling), and demographic (i.e., tree mortality) proper- Significant relationships between species richness and ties of the forest ecosystem, although it reflects poorly drought resistance tended to disappear in more humid the details of these responses in the understory P. sylvestris forests, where NDVI decrease became vegetation. significant in drier localities. In these types of forests, Species homogeneity may be partly responsible for the historical selective pressures may have not favoured unexplained effect of richness on drought impact: plots those species able to face drought, making the whole with a high number of species may be dominated by just community more sensitive to drier conditions. Within a few of them, while a few species on poor plots may be the moister F. sylvatica forests, the climatic gradient evenly represented in the canopy, greatly influencing would not be sufficiently contrasted to produce such a NDVI. Unfortunately, our forestry inventories did not pattern. The distribution of these forests is restricted in provide enough reliable information to calculate this the moister temperate localities of the region and they parameter because the estimates of the abundance of are a refuge for many Euro-Siberian species (Folch rare species within plots were not accurate enough. 1981). In these cases, species-rich communities made up Nevertheless, we managed to detect that the number of of many drought-sensitive species exhibited high nega- species significantly explained the variability of NDVI tive NDVI anomalies. Finally, as expected, in high anomalies, probably because plot richness acts as a
  • 9. 2278 F. LLORET ET AL. Ecology, Vol. 88, No. 9 robust indicator of diversity patterns in this group of biophysical variables and Landsat ETMþdata. Remote plants on a larger scale, as supported by correlations Sensing of Environment 84:561–571. ´ ´ Direccion General de Conservacion de la Naturaleza. 2006. with the number of woody species recorded at a scale of Tercer Inventario Forestal Nacional 1997–2006, Barcelona. 10 3 10 km in the BIOCAT data bank (see footnote 6). Ministerio de Medio Ambiente, Madrid, Spain. In spite of the difficulties of scaling up the species ´ Folch, R. 1981. La vegetacio dels Paı¨ sos Catalans. Ketres, diversity patterns, our study provides a novel insight Barcelona, Spain. Gibelin, A. L., and M. Deque. 2003. Anthropogenic climate into large-scale empirical patterns in the relationship change over the Mediterranean region simulated by a global between the species richness and drought-resistance of variable resolution model. Climate Dynamics 20:327–339. temperate forests, in the face of increasing episodes of Gobron, N., B. Pinty, F. Melin, M. Taberner, M. M. rapid climate change. Thus, our study expands the Verstraete, A. Belward, T. Lavergne, and J. L. Widlowski. information provided by experiments in diversity 2005. The state of vegetation in Europe after following the 2003 drought. International Journal of Remote Sensing 26: manipulation on herbaceous communities across climat- 2013–2020. ic gradients that have shown a positive correlation ` ˜ Gracia, C., J. A. Burriel, J. J. Ibanez, T. Mata, and J. Vayreda. between species diversity and productivity (Hector et al. ` 2004. Inventari Ecologic i Forestal de Catalunya, Catalunya. 1999). ` Centre de Recerca Ecologica i Aplicacions Forestals, Bellaterra, Spain. Our study supports the idea that diversity–stability Hagolle, O., A. Lobo, P. Maisongrande, B. Duchemin, and A. relationships are not simple, as established by other De Pereira. 2005. Quality assessment and improvement of empirical and theoretical studies (Loreau 2000, Pfisterer SPOT/VEGETATION level temporally composited products and Schmid 2002). Overall, a shift in this relationship of remotely sensed imagery by combination of VEGETA- TION 1 and 2 images. Remote Sensing of Environment 94: seems to appear across the regional aridity gradient. 172–286. Forests from drier localities seem to have a pool of Hagolle, O., J. M. Nicolas, B. Fougnie, F. Cabot, and B. species that allow a selection mechanism to operate Henry. 2004. Absolute calibration of VEGETATION de- under extreme drought conditions. This results in an rived from an interband method based on the sun glint over improvement in resistance in accordance with species ocean. IEEE Transactions of Geoscience and Remote Sensing 42:1–20. richness. However, in moister localities, drought-resis- Hector, A., et al. 1999. Plant diversity and productivity tant species are likely to be competitively suppressed by experiments in European grasslands. Science 286:1123–1127. drought-sensitive ones, with higher growth rates under Hernandez-Stefanoni, J. L., and R. Ponce-Hernandez. 2004. moist climate regimes. In other words, there would be a Mapping the spatial distribution of plant diversity indices in a tropical forest using multi-spectral satellite image classifi- higher likelihood of co-occurrence of species sharing cation and field measurements. Biodiversity and Conserva- similar moist climatic requirements. Thus, if the tion 13–14:2599–2621. proportion of drought-sensitive species increases with Holben, B. N. 1986. Characteristics of maximum-values species richness in moist communities, these forests composite images from temporal AVHRR data. Internation- al Journal of Remote Sensing 7:1417–1434. would be more vulnerable to drought events. Finally, Houghton, J. T., Y. Ding, D. J. Griggs, M. Noguer, P. J. van when the climatic episode is not intense enough, as in the der Linden, X. Dai, K. Maskell, and C. A. Johnson, editors. P. uncinata forests of the Pyrenean Mountains, no 2001. Climate change 2001: the scientific basis. Contribution relationship is found. Thus, the study points to the of Working Group I. Third Assessment Report of the Intergovernmental Panel on Climate Change. Cambridge necessity of incorporating into the analysis of the University Press, Cambridge, UK. richness–resistance relationship an axis relating the Huston, M. A. 1997. Hidden treatments in ecological experi- causes of disturbance (i.e., in our case, water availabil- ments: re-evaluating the ecosystem function of biodiversity. ity) to current environmental gradients and to historical Oecologia 110:449–460. environmental constraints on the community. Li, S. G., J. Asanuma, A. Kotani, W. Eugster, G. Davaa, D. Oyunbaatar, and M. Sugita. 2005. Year-round measurements ACKNOWLEDGMENTS of net ecosystem CO2 flux over a montane larch forest in Mongolia. Journal of Geophysical Research: Atmospheres We thank J. Penuelas for the comments to an earlier version ˜ 110(D9): Article No. D09303. of the manuscript and J. J. Ibanez for his advice on the ˜ Lloret, F., H. Estevan, J. Vayreda, and J. Terradas. 2005. Fire inventory data. We also are grateful to P. Lambdon and an regenerative syndromes of forest woody species across fire anonymous reviewer for their suggestions. The study has been and climatic gradients. Oecologia 146:461–468. supported by SI02IR0010 project of the Institut d’Estudis Lloret, F., D. Siscart, and C. Dalmases. 2004. Canopy recovery Catalans (IEC), by REN 2003-07198 and CGL2006-01293/BOS after drought dieback in holm-oak Mediterranean forests of projects of the Spanish MCYT and by project HIDROLIM, of Catalonia (NE Spain). Global Change Biology 10:2092–2099. the Departament d’Universitats, Recerca i Societat de la Lobo, A., and P. Maisongrande. 2005. Stratified analysis of ´ ´ Informacio of the Generalitat de Catalunya (Spain) and Region satellite imagery of SW Europe during summer 2003: the ´ des Midi-Pyrinees (France). differential response of vegetation classes to increased water deficit. Hydrology and Earth System Sciences Discussions 2: LITERATURE CITED 2025–2060. Chen, J. M., and J. Cihlar. 1996. Retrieving leaf area index of Loreau, M. 2000. Biodiversity and ecosystem functioning: boreal conifer forests using Landsat TM images. Remote recent theoretical advances. Oikos 91:3–17. Sensing of Environment 55:153–162. Lucht, W. I., W. I. C. Prentice, R. B. Myneni, S. Sitch, P. Cohen, W. B., T. K. Maiersperger, S. T. Gower, and D. P. Friedlingstein, W. Creamer, P. Bousquet, W. Buermann, and Turner. 2003. An improved strategy for regression of B. Smith. 2002. Climatic control of the high-latitude
  • 10. September 2007 DROUGHT RESISTANCE AND PLANT RICHNESS 2279 vegetation greening trend and Pinatubo effect. Science 296: ´ Suarez, M. L., L. Ghermandi, and T. Kitzberger. 2004. Factors 1687–1688. predisposing episodic drought-induced tree mortality in Martı´ nez-Ferri, E., L. Balaguer, F. Valladares, J. M. Chico, Nothofagus: site, climatic sensitivity and growth trends. and E. Manrique. 2000. Energy dissipation in drought- Journal of Ecology 92:954–966. avoiding and drought-tolerant tree species at midday during Tarpley, J. P., S. R. Schneider, and R. L. Money. 1984. Global the Mediterranean summer. Tree Physiology 20:131–138. vegetation indices from NOAA-7 meteorological satellite. McGrady-Steed, J., J. M. Harris, and P. J. Morin. 1997. Journal of Climate and Applied Meteorology 23:491–494. Biodiversity regulates ecosystem predictability. Nature 390: Terradas, J., R. Salvador, J. Vayreda, and F. Lloret. 2004. 162–165. Maximal species richness: an empirical approach for Mooney, H. A. 1989. Chaparral physiological ecology: evaluating woody plant forest biodiversity. Forest Ecology paradigms revisited. Pages 85–90 in S. C. Keeley, editor. and Management 189:241–249. The California chaparral. Paradigms re-examined. Natural Thorntwaite, C. W. 1948. An approach toward a rational History Museum of Los Angeles County, Los Angeles, classification of climate. Geographical Review 38:55–94. California, USA. Tilman, D., and J. A. Downing. 1994. Biodiversity and stability Naeem, S., and S. Li. 1997. Biodiversity enhances ecosystems in grasslands. Nature 367:363–365. reliability. Nature 390:507–509. Tilman, D., C. Lehman, and K. Thompson. 1997. Plant Nemani, R. R., C. D. Keeling, J. Hashimoto, W. M. Jolly, S. C. diversity and ecosystem productivity: theoretical consider- Pipar, C. J. Tucker, R. B. Myneni, and S. W. Running. 2003. ations. Proceedings of the National Academy of Science Climate-driven increases in global terrestrial net primary (USA) 94:1857–1861. production from 1982 to 1999. Science 300:1560–1563. Tucker, C. J., and P. J. Sellers. 1986. Satellite remote-sensing of Ogaya, R., and J. Penuelas. 2003. Phenological patterns of ˜ primary production. International Journal of Remote Sens- Quercus ilex, Phyllirea latifolia and Arbutus unedo growing ing 7:1395–1416. under a field experimental drought. Ecoscience 11:262–270. Paruelo, J. M., E. G. Jobbagy, and O. E. Sala. 2001. Current Voss, R., W. May, and E. Roeckner. 2002. Enhanced resolution distribution of ecosystem functional types in temperate South modelling study an anthropogenic climate change: changes in America. Ecosystems 4:683–698. extremes of the hydrological cycle. International Journal of Penuelas, J., F. Lloret, and R. Montoya. 2001. Severe drought ˜ Climatology 22:755–777. effects on Mediterranean woody flora in Spain. Forest Williams, M., and E. B. Rastetter. 1999. Vegetation character- Science 47:214–219. istics and primary production along an arctic gradient Pfisterer, A. B., and B. Schmid. 2002. Diversity-dependent transect: implications for scaling-up. Journal of Ecology 87: production can decrease the stability of ecosystem function- 885–898. ing. Nature 416:84–86. Wylie, B. K., D. A. Johnson, E. Laca, N. Z. Saliendra, T. G. ´ Pons, X. 2000. Miramon. Sistema d’Informacio Geografica i ` Gilmanov, B. C. Reed, L. L. Tieszan, and B. B. Worstell. ´ software de Teledeteccio. CREAF, Bellaterra, Spain. 2003. Calibration of remotely sensed, coarse resolution Sala, A., and J. D. Tenhunen. 1994. Site-specific water relations NDVI to CO2 fluxes in a sagebrush–steppe ecosystem. and stomatal response of Quercus ilex in a Mediterranean Remote Sensing of Environment 85:243–255. watershed. Tree Physiology 14:601–617. Zhou, L., C. J. Tucker, R. K. Kaufmann, D. Slayback, N. Sanchez, E., C. Gallardo, M. A. Gaertner, A. Arribas, and M. Shabnov, and R. B. Myneni. 2001. Variations in northern Castro. 2004. Future climate extreme events in the Mediter- vegetation activity inferred from satellite data of vegetation ranean simulated by a regional climate model: a first index during 1981 to 1999. Journal of Geophysical Research approach. Global and Planetary Change 44:163–180. 106(D17):20069–20083.